Doppler velocimeter based on dual-comb absorption spectroscopy  Download: 719次
1. INTRODUCTION
As an important application of optical frequency combs (OFCs), dual-comb absorption spectroscopy (DCAS) uses two phase-locked combs with a slightly different repetition to one-to-one map the amplitude and phase information of the comb teeth from the optical domain to the RF domain on a single photodetector [1,2]. It has been demonstrated to be a powerful tool in various scientific fields for time-resolved, broadband, and high-resolution spectroscopic measurements with excellent sensitivity [3–9]. In particular, a series of remarkable works about the sensitive detection of trace gas molecules and the open-path atmospheric monitoring with frequency comb spectroscopy already has made dramatic progress [10–16]. Meanwhile, it is an urgent demand for the parallel sensing of multiple dynamic trace molecules, such as the leakage and diffusion process of pollutants, to realize the sensitive detection of gas molecules and the determination of the flow direction of molecules simultaneously.
Besides the dynamic trace pollutants, the capability of experimentally determining the flow velocity is beneficial to the study of scientific fields, such as the prediction of physical mechanisms, aerodynamic systems, weather forecasting, and biomedical engineering [17–22]. Among all solutions for the flow velocity measurement, the optical velocimeter stands out due to its rapid and nonintrusive nature [23] and has been playing an important role in various applications since its invention. By using the laser-induced fluorescence velocity measurement, a series of flow visualizations in high-speed compressible flows with the velocity up to 4060 m/s was performed, and the accuracies of a few percent of the maximum velocity at an effective acquisition rate of 10 Hz were obtained [24,25]. However, the absolute concentration of exhaust emissions cannot be measured, and the addition of seed molecules may be harmful to sensitive ground test facilities. Furthermore, a nonlinear optical method such as coherent anti-Stokes Raman scattering (CARS), with the advantages of spectral selectivity and laser-like directional signal was applied in a velocity measurement for the low-enthalpy wind tunnels. With this velocimeter, the laminar flow for the expected velocity of 1382 m/s can be measured with the accuracy of 6% [26], but it may suffer from the low intensity level of the CARS signal, limiting the acquisition time to 40 s [27]. For the range-resolved wind detection in the low-speed airflow, the velocimeter using the molecular scattering has been proved to be an effective instrument within the velocity sensitivity of 5% at the temporal resolution of seconds, but the necessity of the laser pulse with high energy hinders its further wide application [28,29]. Tunable diode laser absorption spectroscopy (TDLAS) for the flow velocity measurement offers the practical advantages of robustness and sensitivity, and besides that, velocity, temperature, pressure, and mass flux can also be inferred from details of the absorption lines [30,31]. Combining TDLAS with the wavelength modulation spectroscopy with detection, the time-resolved velocity measurements for the practical applications ranging from the low-speed wind tunnel to advanced aero-propulsion devices were achieved within the uncertainty of 1% due to superior noise rejection capabilities [32–34]. However, to recover the complete absorption line, TDLAS usually requires the repetitive wavelength scanning and one etalon signal as the frequency marker to provide a fine calibration of the wavenumber axis of the absorption spectrum simultaneously [35].
Benefiting from the broadband and extremely precise spectroscopic performance of the DCAS, the airflow velocity measurement based on the DCAS has several advantages. (1) Through the analysis of Doppler shifts of absorption lines, not only does DCAS have the capacity of distinguishing multiple unknown gas molecules sensitively but also can determine the flow direction of molecules simultaneously. This is significant for research on leakage and diffusion process of pollutants in the wind flow. (2) A broadband spectrum in a single measurement enables parallel measurement of hundreds of molecular absorption lines simultaneously, which improves the precision of Doppler-shifted frequency measurements [36,37]. Furthermore, parallel sensing of gas molecules with broadband OFCs [38] is able to select series of spectral regions that minimize the interference from ambient interfering molecules, thus eliminating the risk from overlapped absorption lines. (3) Using the heterodyne detection of two combs with slightly different repetition frequencies, DCAS gets rid of scanning processes and obtains the periodic interferograms with a period of milli- or microseconds, allowing for time-resolved spectroscopy [39]. The comb requires no additional calibration and can be either phase-locked to the ultrastable RF reference through self-referencing technique [40] or referenced to a stable narrow linewidth laser [41]. (4) DCAS, as a Fourier transform spectrometer, inherits the Fellgett’s advantage over an equivalent scanning monochromator because all spectral information is measured simultaneously on a single photodetector. This basically results in the consistency of the measurement and a relative improvement in the detector noise limit. Moreover, the heterodyne detection characteristic of DCAS in the RF spectrum (10s–100s of megahertz) can effectively reduce the noise.
In the experiments, we present a comb-mode-resolved dual-comb spectrum to extract the Doppler shift frequency, which covers the P branch of a molecule ranging from 193.4 to 196.6 THz. The signal-to-noise ratio (SNR) of multiple absorption lines is obtained, and its impact on the statistical uncertainty of the line center fitting is discussed, which turns out to be consistent with experimental results. We also introduce the weighted average model for the unequal-uncertainty measurements to optimize the measuring uncertainty. The velocities of acetylene ranging from 8.72 m/s to 44.87 m/s with an uncertainty down to 0.19 m/s are obtained within a 15 s measurement time. Through the implementation of a time-dependent dynamic monitoring of various flow velocities with an invariant measuring uncertainty (, that is, 1.5% of the maximum velocity) at the effective time resolution of 1 s throughout, the potential applications of the DCAS velocimeter in the diagnostics of propulsion system and pollutant diffusion in the wind flow are demonstrated.
2. EXPERIMENTAL SCHEMATIC AND SETUP
Figure 1(a) presents the concept of our DCAS-based velocimetry system. When the laser beam propagates forward in a cell, multiple absorption line centers of the moving gaseous molecule are Doppler-shifted up in frequency. Conventionally, accurate quantification of frequency shifts is achieved through assessing the centers of absorption line profiles in DCAS, which is given by , where is the airflow velocity, is the speed of light, is the line-center frequency, and is the angle between the velocity vector and the optical axis. We propose a counterpropagating collinear laser beam arrangement to cancel the residual frequency drift and allow the flow velocity to be derived from the absorption peak pairs in both blue and red Doppler-shifted spectra. Since the flow velocities are obtained from dozens of parallel shifted lines in the broadband spectrum, our measuring uncertainty is improved compared to single-peak measurements.

Fig. 1. Schematic and experimental layout for the gas flow velocity measurements based on DCAS. (a) Multiple absorption lines experience Doppler shifts in the line-center frequency. DCAS enables the extraction of the precise position of each absorption line center, and the flow velocity can be derived from frequency shifts of multiple absorption lines. (b) The outputs of two combs are combined and split into two subbeams for the counterpropagating arrangement. The airflow is produced in the test facility by a commercially vacuum pump. PBS, polarization beam splitter; BS, beam splitter; BP, bandpass filter; HWP, half-wave plate; BD, balanced detector.
Figure 1(b) presents the configuration of our DCAS-based velocimetry system, and the generation of the passive mutually coherent dual-comb spectrometer is based on our previous work using the ultrafast optical modulation technique [42]. The optical sources are two frequency combs with comb repetition rates of 108 MHz that differ by . Two combs have 3 THz spectral bandwidths to cover 193.4 to 196.6 THz (1550–1525 nm). It means that the combs consist of 30,000 frequency modes, which is equivalent to the output of the same amount of narrow linewidth continuous wave (CW) frequency components. Then, two combs are combined spatially on a polarization beam splitter and transmitted through the sample together, which achieves a symmetric approach. Such an approach overcomes random variations of the laser phase when the system is subject to turbulent or chaotic environments [2,43]. It is worth mentioning that a 50:50 beam splitter is utilized to split the combined beams to obtain two counterpropagating measuring beams. This not only eliminates the residual frequency drift of combs but also receives twice the magnitude of the Doppler shift between the respective blue- and redshifted frequency signals. The counterpropagating beams are spatially offset with a slight angle of 1 deg. As such, both beams are separate when the detector is far from the beam splitter. The flow velocity measurements are performed in an airflow test facility. The gas cell is a 40-cm long cylindrical tube with a diameter of 4 mm. The small diameter can obtain a relative high flow velocity with the same air-pump power. A pair of quartz plates with wedge angles of 3 deg located at both ends of the tube serves as optical windows. The air-pump equipment is a commercially available, 250 L/min exhaust-flow vacuum pump (ISP-250c from ANEST IWATA). The airflow is produced at whole circular pipelines once a parallel connection is established between the cell and pump, and the airflow velocity is controlled by an adjustable split-flow component. After the gas-flowing cell, we use an optical bandpass filter to optimize the spectral region to meet Nyquist sampling conditions, thereby avoiding the aliasing effects. Certainly, ultrabroadband lasers such as supercontinuum sources have the potential to realize parallel gas sensing and velocity measurements simultaneously [44]. A half-wave plate and a polarizing beam splitter are used to fine-tune the balancing of light levels. Then, the two comb lasers with the same power levels are guided to two ports of a 150 MHz commercial balanced detector (PDB450 C from Thorlabs) for the heterodyne spectral signal detection. To avoid the nonlinearity or full saturation of the detector that could lead to slight distortions of the measured absorption line centers, the total average power of the two combs into each port of the detector is attenuated to . A low-pass filter at 48 MHz is applied to the electronic signals to avoid aliasing of signals. The detector signals are then digitized by a 160 MS/s 16-bit data-acquisition board (ATS9462 from AlazarTech). In this experiment, the adaptive sampling technique is adopted to eliminate the residual drift of the repetition frequency difference between two combs. The streams of recorded raw data are then directly fast Fourier-transformed to achieve the dual-comb spectrum.
3. RESULTS AND DISCUSSIONS
To evaluate the performance of our dual-comb spectroscopy, we measure a mode-resolved spectrum of static acetylene at a pressure of 5 mbar. Streams of data containing series of interferograms spaced by are recorded within a time window of up to 10 s. The spectrum of the raw data is obtained by the fast Fourier transform (FFT) and is shown in Fig. 2(a). For the measurement time of 10 s, the SNR culminates at 421 around , and the average SNR across the entire span of 3.2 THz is 198. The resulting figure of merit ( at 1-s averaging time), calculated for the average SNR, is therefore , where is the number of comb lines across the optical bandwidth. Figure 2(b) is a zoomed view of the spectrum, which clearly shows the discrete comb line intensities shaped by absorption profiles. Our optical sampling is (stabilized to the Rb frequency standard) and is essential especially for highly crowded spectral features at low pressure, such as a P branch composed of Doppler-broadened lines. Moreover, for our homemade frequency combs, this spacing is easy to adjust to match the requested spectral resolution. The full width at half-maximum (FWHM) of the RF comb lines is 100 MHz (9 kHz in the optical scale), which equals to the Fourier-transform limit of the 10 s-long recording time. In this experiment, our DCAS is passively phase-locked to the narrow linewidth CW laser (Koheras Adjust E15, NKT Photonics, with a claimed free-running linewidth of less than 0.1 kHz at a 100 μs integration time). Although there is a long-term frequency shift resulting from the drift of the commercial CW reference laser of roughly 1 MHz/min, the concern of the DCAS-based Doppler velocimeter is the Doppler-shifted frequency between two counter-propagating laser beams, which can effectively eliminate the residual frequency drift from the CW laser. In principle, when the combs are referenced to a frequency standard by means of self-referencing technique [45] (which is not adopted in this experiment) the long-term frequency shift can all be removed, enabling the unidirectional measurements with a high precision. As presented in Fig. 2(c), the retrieved dual-comb spectrum is highly consistent with the transmission spectrum computed from the HITRAN database. Multiple rovibrational lines in the half of the P branch of are clearly identified, which enables multiple flow velocity measurements in a single spectrum measurement simultaneously.

Fig. 2. Comb-mode-resolved DCAS. (a) Broadband optical spectrum (log scale) obtained via FFT from a 10-s-long recording. (b) Zoomed figures display comb-tooth-resolved spectra with absorbed energy modes resulting from
As in the traditional TDLAS velocimeter, determining the line centers of the absorption profiles for a DCAS velocimeter is also crucial. DCAS takes advantage of the parallel recording of multiple absorption lines and realizes flow velocity measurements with multiline analysis. Figure 3 shows the measured absorption spectra retrieved from counterpropagating beams and several blue- and red-shifted absorption peak pairs in 1 s recording time. The FWHM of the absorption line varies from 720 to 1200 MHz due to the combined effect of Doppler- and collision-broadening in the airflow. A higher sampling rate can result in a better line fitting, and thus more precise line-center identification. As such, we use the zero-padding approach to achieve fine interpolation line shapes in the frequency spectrum [46]. Then, the profiles near the peak of rovibrational lines are least-squares fitted by a Lorentzian distribution function using a nonlinear Levenberg–Marquardt algorithm. We observe that there is little difference between the Lorentzian and Voigt line shapes for the fitting of the data points near the peak. The precise position of each absorption line center is obtained through the least-squares fitting routine. Flow velocity is obtained by calculating the Doppler shifts between multiple blue- and red-shifted line pairs across the measured bandwidth.
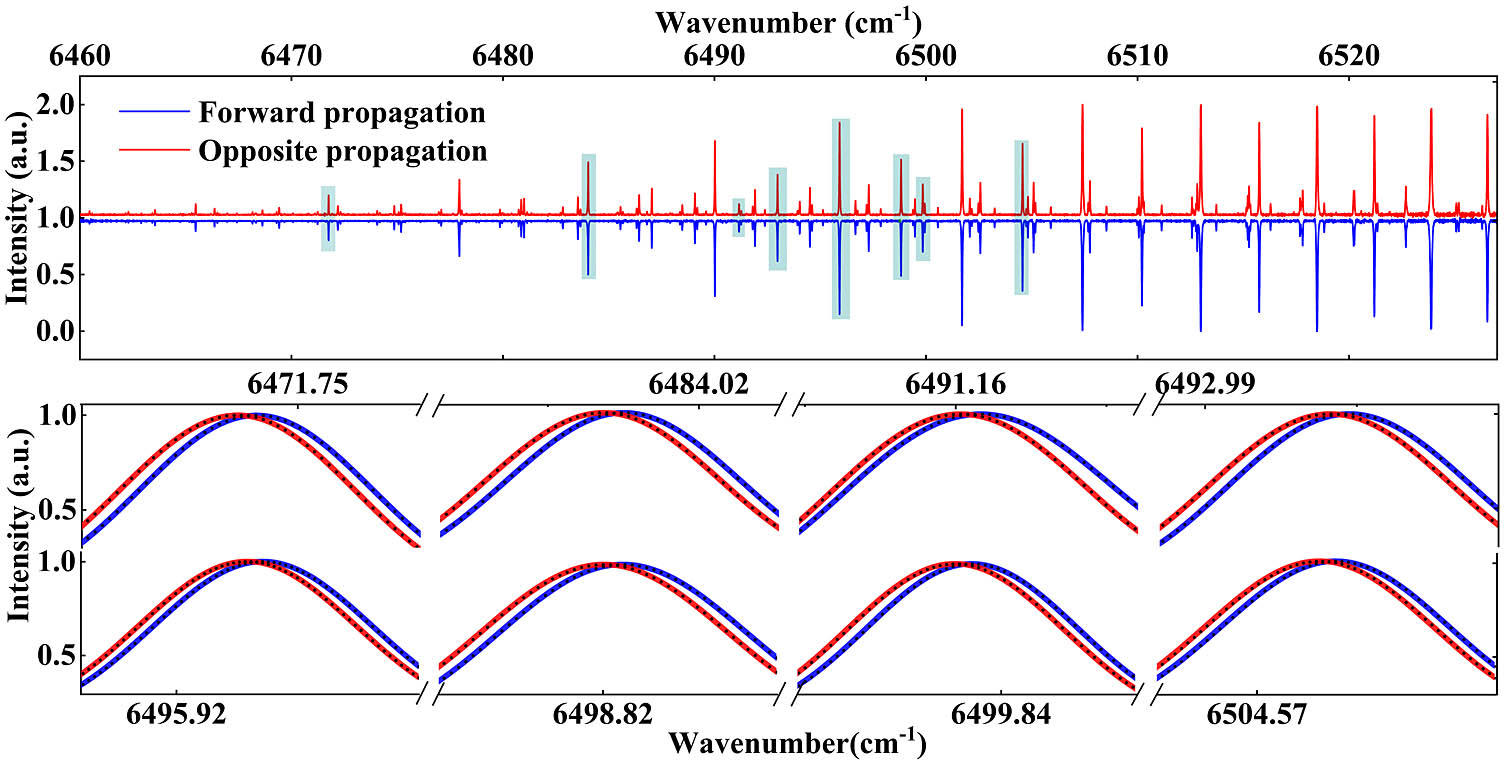
Fig. 3. Absorption spectra of the acetylene flow at a pressure of 15 mbar from forward (blue curve) and opposite (red curve) measurements in 1 s recording time. Doppler-shifted absorption peak pairs in cyan-shaded boxes are shown in the zooms below.
For the Doppler velocimeter, the flow velocity is derived from the determination of the line centers between the Doppler shift absorption profiles. Therefore, the uncertainty of the optical velocity measurement mainly depends on two factors: the stability of the laser source, and the uncertainty of the data acquired. The stability of the frequency comb has been demonstrated in series of works [47,48]. The error in our experiment is mainly due to the line-shape fitting process used for extracting the Doppler shift frequency. One concern is the limited SNR of our DCAS due to the presence of the noise (as in all laser spectrometers) and its influence on the line-center determination [49]. In theory, the statistical uncertainty on the th fitting line center for the Lorentzian fitting is [50]
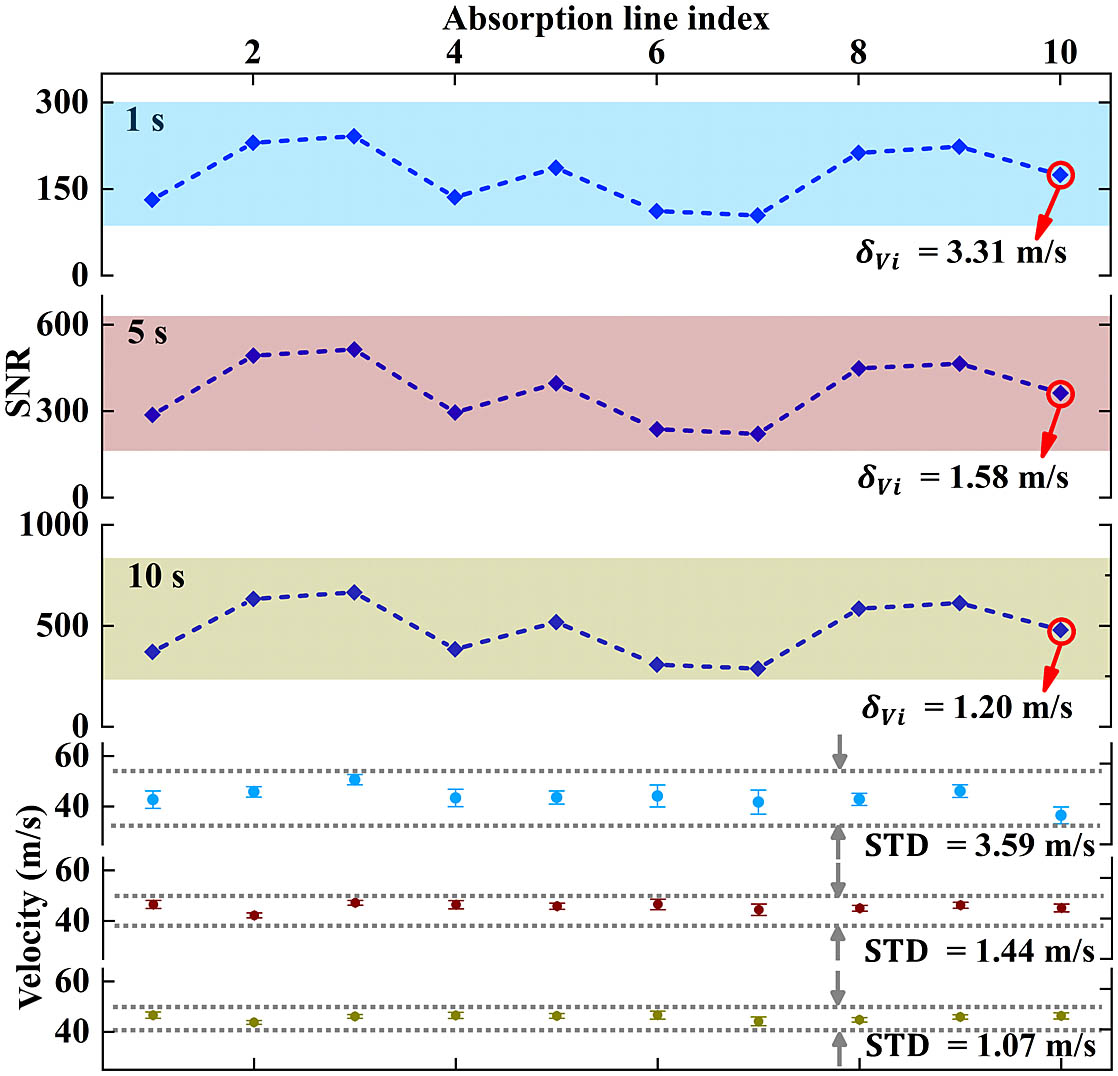
Fig. 4. Comparison between the theoretical uncertainty
DCAS is capable of sensing dozens of Doppler-shifted absorption lines and achieves a superior measuring uncertainty over single-peak measurements. Since the statistical uncertainty is inversely proportional to of the th peak, multiple peaks with different in a single spectrum can be treated as an unequal-uncertainty measurement. We thereby introduce weighted average to obtain the optimal measuring uncertainty for the unequal-uncertainty measurement. The weight of the th peak is
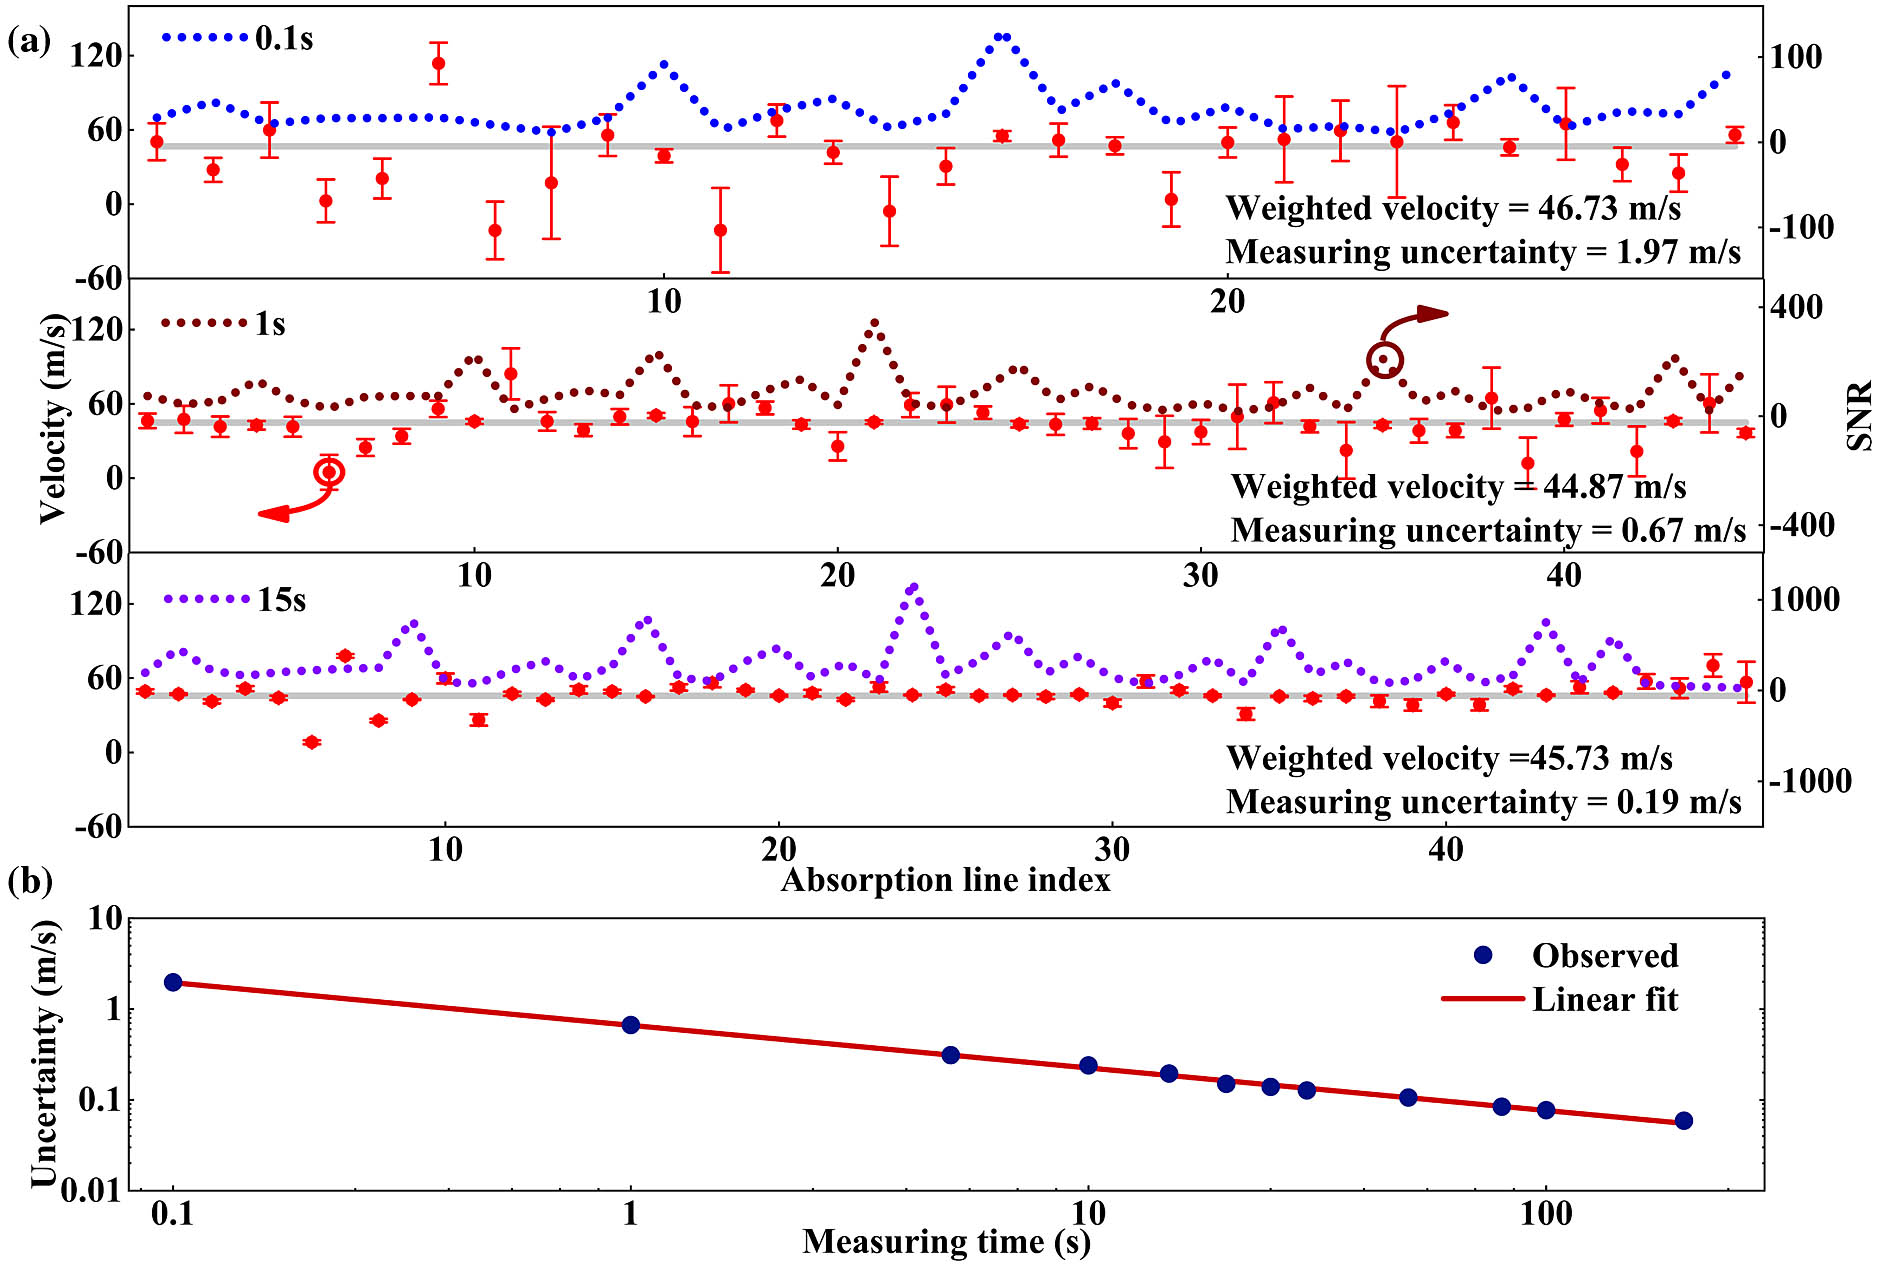
Fig. 5. Gas flow velocity measurements with DCAS. (a) Experimental flow velocities (red dots) are derived from Doppler shifts of dozens of absorption lines. The SNR (the dotted-line from top to bottom corresponding to 0.1, 1, and 15 s measurement time, respectively) of each absorption line is applied to Eq. (1 ), and then extracted to calculate the statistical uncertainty at the fitting line center. The increasing number of available absorption lines is attributed to undistorted absorption lines with the signal averaging. The weighted-average flow velocities (gray curve) with different measuring uncertainties are obtained. (b) Evolution of the measuring uncertainty with the acquisition time. A linear fit with a slope of 0.469 indicates that the measuring uncertainty is inversely proportional to the square root of the measurement time.
An important factor to assess the noise characteristics of the different types of spectroscopic instruments is the figure of merit (quality factor) because it takes into account both the spectral coverage and the SNR. In case the laser relative intensity noise is suppressed to a relatively low level, the DCAS and the TDLAS both have the same level of figure of merit when the same optical sensing configuration and detection elements are used. However, the SNR of the TDLAS is higher than that of the former, generally due to the narrow bandwidth of the TDLAS. According to the basic scaling law of the figure of merit, it illustrates the trade-off between the average SNR and the number of comb lines across the optical bandwidth [53]. In principle, the SNR of the DCAS can be increased up to the level of the TDLAS when the measured bandwidth is decreased to that of the latter if a high-precision velocity measurement is required.
The measuring uncertainty of the DCAS velocimeter can be further validated experimentally by the measured velocity when the airflow is static (the velocity is zero). In this static condition, Fig. 6(a) shows several measured absorption peak pairs retrieved from counterpropagating beams in 1 s measurement time. Figure 6(b) shows the measured flow velocities from multiple absorption peak pairs with different SNRs. According to the model of weighted average for the multiple absorption lines, the flow velocity in the static gas is 0.38 m/s with a measuring uncertainty of 0.72 m/s in 1 s measurement time, and with an uncertainty of 0.21 m/s in 15 s. The results for the measured velocities (0.38 and ) within the range of the measuring uncertainties (0.72 and 0.21 m/s) in different recording times demonstrate the validity of the measuring uncertainty based on Eq. (4). For practical applications such as combustion chambers, the molecules of carbon dioxide and water vapor, and , tend to be the key species for tracing the diffusion velocity of the airflow field. Note that most molecules in the gas phase have relatively strong rovibrational transitions in the mid-infrared spectral range. The effective improvement of the DCAS sensitivity with mid-infrared frequency combs can be proposed as the solution.
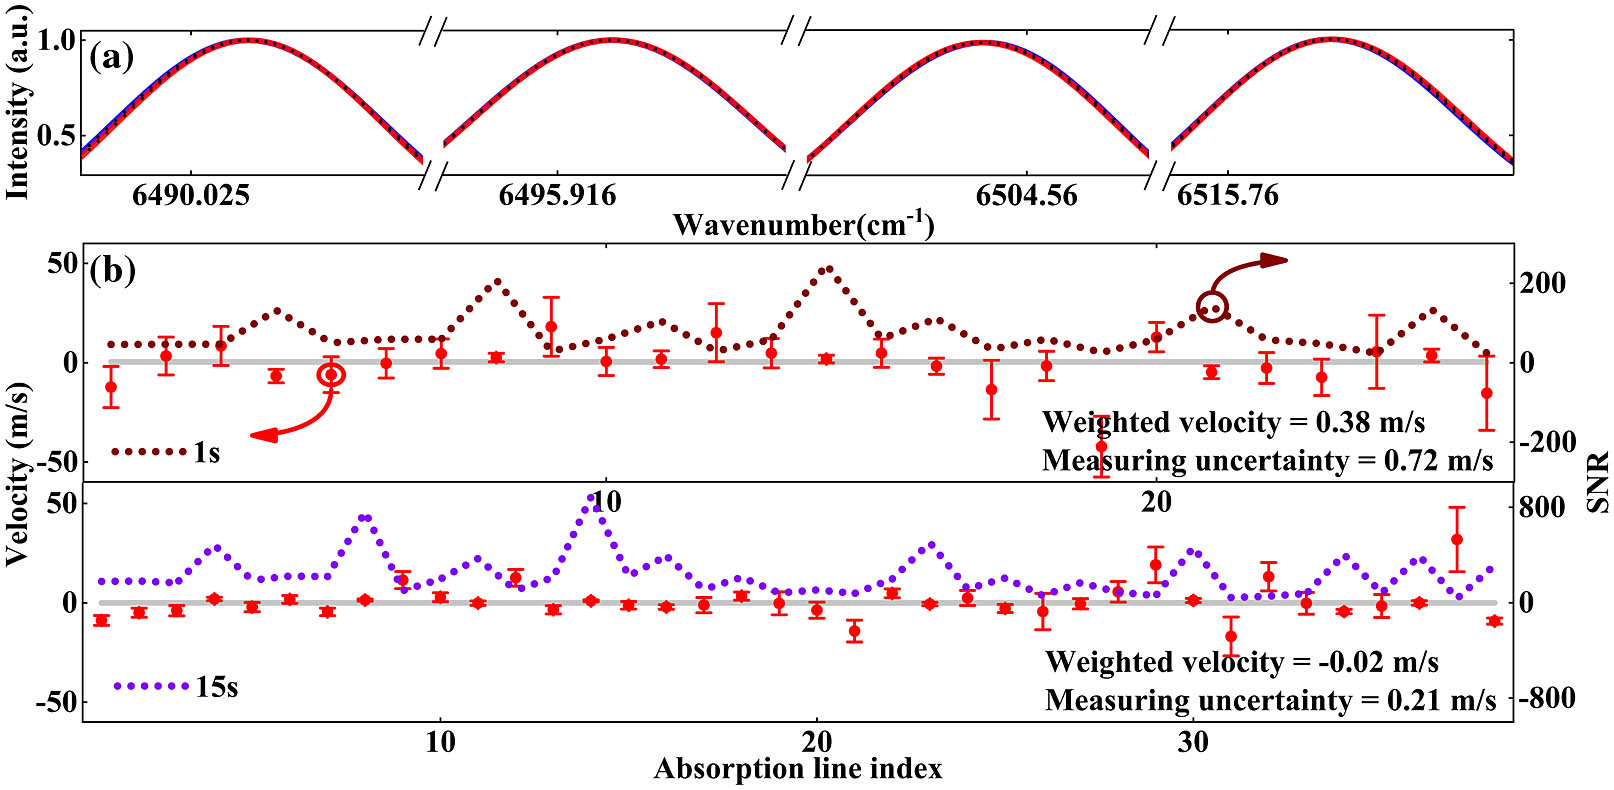
Fig. 6. Velocity measurements of static gas with DCAS. (a) Absorption peak pairs in 1 s measurement time; (b) measured flow velocities (red dot) and the SNR (brown and purple dotted lines corresponding to 1 s and 15 s recording times) extracted from multiple absorption peak pairs.
Experiments for various flow velocity measurements are also carried out by the DCAS velocimeter. The Doppler shift varies within the range from 11.33 to 58.29 MHz, as shown in Fig. 7(a). The measured maximum and minimum flow velocities are 44.87 and 8.72 m/s, respectively, when the valves in the test facility are fully closed and opened. The Doppler-shifted peak pairs in Fig. 7(b) show the increasing frequency shift with the flow velocity. It is worth noting that all measured flow velocities still maintain similar measuring uncertainty () in 1 s time resolution at various flow velocities throughout. The minimum measuring uncertainty for flow determination is 1.5% within 1 s, and this is expected to decrease as the flow velocity increases. As such, the DCAS velocimeter has the potential to perform a high-precision measurement for high-speed applications such as hypersonic wind tunnels.
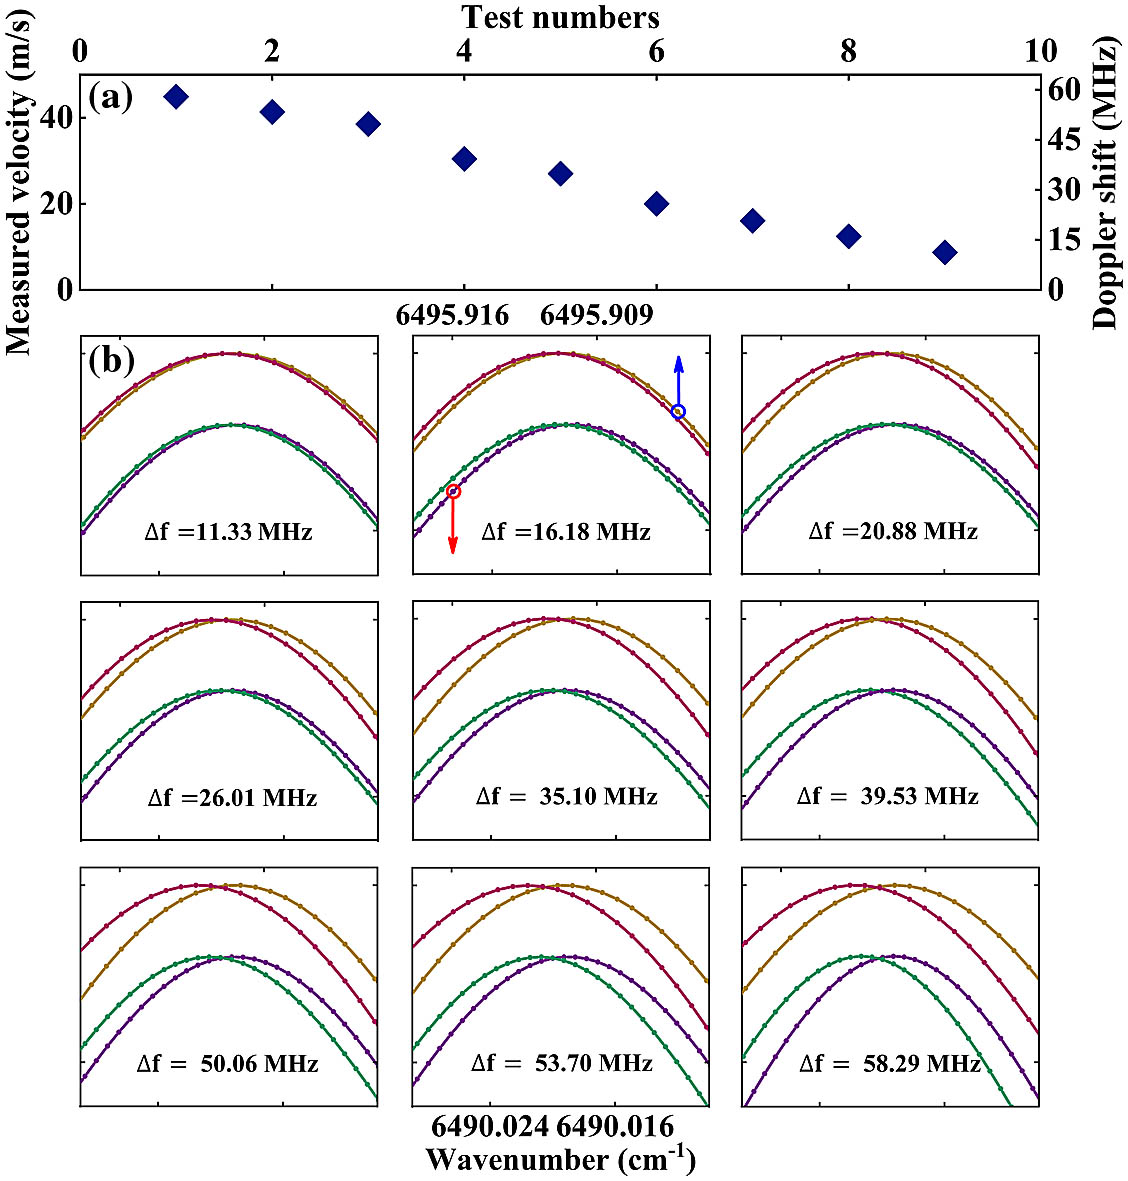
Fig. 7. Experiments for various flow velocities with DCAS. (a) Flow velocity measurements with DCAS in the range from 8.72 to 44.87 m/s;(b) two selected absorption line pairs with forward (red and green curves) and opposite (yellow and purple curves) Doppler shifts in an acquisition time of 1 s at different flow velocities. The Doppler shift varies from 11.33 to 58.29 MHz with the velocity.
Figure 8 shows a continuous dynamic monitoring of the flow velocity in 40 s by the DCAS velocimeter. The test facility is stepped up to successively higher velocities at 8.72, 20.00, 30.43, and 44.87 m/s through the control of the valve in a 10 s time interval. The recorded data are provided at an effective time resolution of 1 s without postprocessing and reach a measuring uncertainty of submeter per second. The velocity fluctuations of less than 2 m/s can be observed in the zoomed plots in Fig. 8. The fluctuation is mainly due to the unsteady exhaust flow of the vacuum pump and the turbulent flow in the test facility.
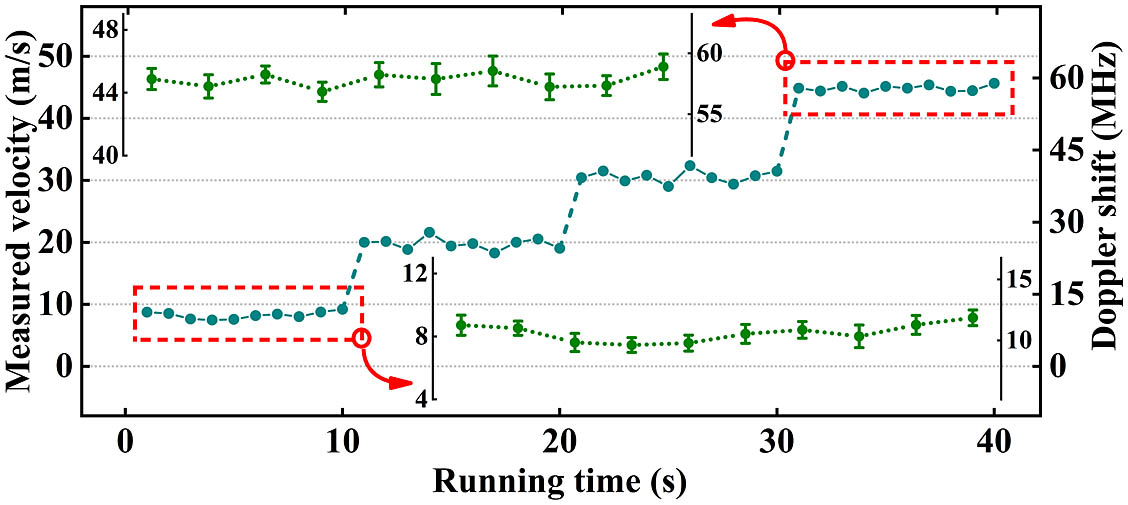
Fig. 8. Dynamic monitoring at 1 Hz over 40 s in the airflow test facility. The measured flow velocity is stepped up in a 10 s time interval. A velocity fluctuation caused by unsteady exhaust-flow
4. CONCLUSION
In conclusion, we have developed and experimentally validated accurate velocity measurements in the airflow test facility with the DCAS velocimeter. In this pilot demonstration, a measuring uncertainty down to submeter per second at various flow velocities is achieved when the multiple absorption lines are processed with the weighted average model. This solution has the potential capability for low- and high-speed environmental applications such as pollutant diffusion, boundary-layer profiling, and hazardous plume and combustion systems. In addition, the performance of the DCAS velocimeter promises to be further improved by broadband OFCs in the mid-infrared region reported by several groups [54–57], where the stronger and highly crowded spectral lines are addressed. Going forward, utilizing the wavelength division configuration in multidimension based on the broadband DCAS, quantitative visualization of the flow field would be possible with a single photodetector.
Article Outline
Chenglin Gu, Xing Zou, Zhong Zuo, Daowang Peng, Yuanfeng Di, Yang Liu, Daping Luo, Wenxue Li. Doppler velocimeter based on dual-comb absorption spectroscopy[J]. Photonics Research, 2020, 8(12): 12001895.

