Photonics Research, 2020, 8 (10): 10001642, Published Online: Sep. 30, 2020  

Fast and wide-band tuning single-mode microlaser based on fiber Fabry–Pérot microcavities Download: 758次

Author Affiliations
1 CAS Key Laboratory of Quantum Information, University of Science and Technology of China, Hefei 230026, China
2 CAS Center for Excellence in Quantum Information and Quantum Physics, University of Science and Technology of China, Hefei 230026, China
3 e-mail: jmcui@ustc.edu.cn
4 e-mail: cfli@ustc.edu.cn
Abstract
A narrow-linewidth laser operating at the telecommunications band combined with both fast and wide-band tuning features will have promising applications. Here we demonstrate a single-mode (both transverse and longitudinal mode) continuous microlaser around 1535 nm based on a fiber Fabry–Pérot microcavity, which achieves wide-band tuning without mode hopping to the 1.3 THz range and fast tuning rate to 60 kHz and yields a frequency scan rate of 1.6×10¹⁷ Hz/s. Moreover, the linewidth of the laser is measured as narrow as 3.1 MHz. As the microlaser combines all these features into one fiber component, it can serve as the seed laser for versatile applications in optical communication, sensing, frequency-modulated continuous-wave radar, and high-resolution imaging.

1. INTRODUCTION

Lasers with properties of low threshold, single-mode output, narrow linewidth, fast tuning rate, and wide tuning range are desired in many studies [14" target="_self" style="display: inline;">4], and combining these features into one device is critical and feasible for many practical applications. For this purpose, microlasers supported by optical microcavities with high quality factor (Q) are ideal platforms, as the microcavity has a small mode volume (V) and a large Q/V value, which implies the ability to realize low-threshold and narrow-linewidth lasers [5]. In previous research, microlasers are mainly based on whispering gallery mode (WGM) microcavities, which have made great progress in the past decades. [59" target="_self" style="display: inline;">9]. However, it is still challenging to implement all of the above features on one device. Although a lot of tunable lasers are proposed in WGM resonators [7,8,1012" target="_self" style="display: inline;">–12], tunable microlasers in the nanometer (nm) range without mode hopping have not yet been reported. The upcoming fiber Fabry–Pérot cavities (FFPCs) with concave mirrors have been widely researched in recent years [13], which also provide a high Q value like WGM cavities [13,14], and they have been used in various fundamental and applied research areas [1317" target="_self" style="display: inline;">17]. Compared with the mechanical tuning method of WGM microcavities [18], the FFPCs can be electrically tuned with a much higher mechanical bandwidth [19]. As the FFPC can select a peak mode while suppressing the others, a single longitudinal mode is naturally feasible. Besides, the short cavity length enables a large free spectrum range. These properties make the FFPCs an outstanding candidate to build microlasers.

In this work, we demonstrate a microlaser based on an FFPC. The laser device is a compact module with a single-mode fiber output, which is capable of emitting a single-mode (both transverse and longitudinal mode) laser around 1535 nm. The microlaser wavelength can be electrically tuned in the 10 nm (1.3 THz) range without mode hopping. A fast tuning rate is also realized on our microlasers, as the FFPC device is designed with high mechanical bandwidth [19], and the tuning bandwidth is tested as 60 kHz, which yields a frequency scan rate of 1.6×10¹⁷  Hz/s. The linewidth of the laser is measured as 3.1 MHz, corresponding to a coherence length of 66 m. In general, we present that a wide-band tunable laser without mode hopping has the characteristics of a fast tuning speed, a single fundamental mode, and a narrow linewidth simultaneously.

Benefiting from the combined qualities of the device, it has great potential applications in optical communication, sensing, frequency-modulated continuous-wave (FMCW) radar [2022" target="_self" style="display: inline;">–22], and high-resolution imaging. The range resolution δz of an FMCW measurement is determined by δz=c/2B [23,24], where c is the speed of light and B is the total frequency excursion of the source. Therefore, the spatial resolution of an imaging system is inversely proportional to the chirp bandwidth, and the longest range of the distance measurement is limited by the coherence length, which is determined by the linewidth of the laser. Besides, the laser seed with high chirp rate can significantly suppress the simultaneous stimulated Brillouin scattering (SBS) that is currently limiting the output power of narrow-linewidth fiber amplifiers [25,26]. It also can serve as an optical beat source for continuously tunable terahertz (THz) radiation. [27,28]. Conventionally, distributed-feedback (DFB) lasers, vertical-cavity surface-emitting lasers (VCSELs), and external-cavity diode lasers (ECDLs) are widely used in those applications [26,29,30]. However, DFB lasers have a low chirp of 1014  Hz/s and a limited tuning range to gigahertz (GHz) scale [30], and the broadband ECDL to 5 THz has a much lower chirp of 6×10¹²  Hz/s [21]. Most VCSELs can achieve a linear chirp of 5×10¹⁵  Hz/s [26], although a 100× faster chirp is obtained by moving the external mirror, and the coherent length is limited to 5 m due to the 40 MHz linewidth [25]. Compared with the traditional swept lasers, our FFPC microlaser demonstrated the most rapid chirp under the THz tuning range with narrow linewidth at the same time.

2. CAVITY AND CAVITY MEASUREMENT

We use an FFPC as the resonant cavity of a laser, which is formed by a fiber mirror and a flat mirror [Fig. 1(a)]. The fiber mirror is a concave spherical mirror, which is fabricated on the end facet of a single-mode optical fiber by using a CO2 laser ablation process [13,16]. After the laser ablation process, the curvature of the machined fiber end facet can be measured by a white-light profilometer. An interferometric image of the end-face image is shown in Fig. 1(b), where concentric fringes correspond to a radius of curvature (ROC) of 100 μm. The flat mirror is a K9 glass mirror with a diameter of 12 mm. Both of the mirrors are coated with distributed Bragg reflectors by ion beam sputtering, whose high reflection band is between 1400 and 1650 nm. The reflectivity of the fiber mirror reaches 99.94%, while the flat mirror has a lower reflectivity of 99.8% in order to collect the transmitted light more efficiently. The mirror coating is composed of Ta2O5/SiO2 dielectric stacks, and the final layer is SiO2. An Er3+/Yb3+ co-doped silica film with a thickness of 35.1 μm is inserted into the cavity, which acts as the gain medium of the microlaser. It is bonded to the flat mirror by the chemical reaction between SiO2 and NaOH solution [31]. The silica film is doped with Yb3+ concentration of 19.0 wt% and Er3+ concentration of 1.0 wt%, whose gain peak is at 1535 nm.

Fig. 1. Schematic of the FFPC for lasing. (a) The FFPC is formed by a concave fiber mirror and a flat mirror. An Er3+/Yb3+ co-doped silica film (thickness of 35.1 μm) is set inside the cavity and bonded onto the flat mirror. (b) An interferometric image of the concave surface of the fiber mirror (with the scale bar of 30 μm), and the radius of curvature of the concave mirror is calculated as 100 μm from the concentric fringes.

下载图片 查看所有图片

To assemble the cavity, the flat mirror with the doped silica film is fixed to a mount, and the fiber is clamped to a six-axis nanoscale stage (Thorlabs MAX603D/M). The six-axis nanoscale stage is mainly used to enable angular alignment and cavity length control, which is precisely adjusted by electrically driving the piezo on the stage.

Once a cavity is made up, the transmission and reflection spectra of the cavity are measured to determine the finesse of the cavity. The measurement diagram is presented in Fig. 2(a): a tunable laser (Toptica CTL 1500) and two photodetectors (PD1, PD2) are used. The light from the tunable laser is injected into the cavity through a circulator, then the transmitted light from the cavity is collected onto PD1 by a lens, and the reflected light by the cavity passes through the circulator to PD2. By scanning the incident wavelength from 1460 to 1570 nm while monitoring the cavity’s transmission spectrum at different cavity lengths, we observe a two-dimensional (2D) transmission spectrum shown in Fig. 2(b). The cavity length is changed by increasing the voltage applied to the nanoscale stage with a step length of 10 nm. The transmission and reflection spectra are recorded at every step, and 400 sets of spectral data corresponding to a total variation of 4 μm in cavity length are recorded.

Fig. 2. Measurement of cavity longitudinal modes. (a) The scheme to measure the transmission and reflection of the FFPC. A tunable laser is coupled into the fiber cavity, and the transmitted (reflected) light is detected by PD1 (PD2). A transmission (reflection) spectrum is obtained by scanning the laser wavelength from 1460 to 1570 nm. (b) A two-dimensional transmission spectrum by gathering 400 sets of transmission spectrum data as a function of the cavity length L. (c), (d) Measured transmission and reflection spectra of the bare cavity (film-in cavity) and corresponding FSR in length to 22.07 nm (17.6 nm), respectively. (e), (f) Close-up view of the peaks marked in (c) and (d), respectively. Lorentzian line shape is used to fit the data, and the corresponding fitted linewidth δν is 10 pm (17 pm).

下载图片 查看所有图片

A one-dimensional model is used to fit the waveform in the 2D transmission spectrum [14], and the resonant frequencies ν are given by the following equation: where n is the refractive index of the doped silica film, L is the cavity length, Ld is the thickness of the doped silica film, m is an integer, and θ=LLdnLdLLd+nLdmπ. Fitting Eq. (1) to the 2D cavity transmission spectrum results in Ld=35.1  μm, L=46  μm, and n=1.58.

The waveform also can be explained in an intuitive way: if the cavity is considered as two separate cavities, an air cavity and a film cavity, they have different resonance frequencies; νair=mc/2(LLd) is linear to the cavity length, while νfilm=mc/2nLd is a constant, which will offer a vertical line in the 2D spectrum. However, these modes are actually coupled to one another, which leads to the bent spectral pattern that appears in the figure.

The finesse of the cavity, which is expressed as F=FSR/δν, can be obtained from the ratio of the free spectral range (FSR) and linewidth δν. A typical spectrum is shown in Figs. 2(c)–2(f). Figures 2(c) and 2(d) show the FSRs of the bare cavity and film-in cavity, respectively. Figures 2(e) and 2(f) are the corresponding close-up views of the peaks marked in Figs. 2(c)–2(d), respectively. The measurement data are fitted by a Lorentzian line shape, and the linewidth δν is defined as the full width at half-maximum (FWHM) of the Lorentzian line shape. The finesse corresponds to Fbare=2207 and Ffilm=1035 for the bare cavity and film-in cavity. The designed finesse of the bare cavity is 2414, according to F=πR1R24/(1R1R2) [13], where R1 and R2 are the reflectivity of the fiber mirror and flat mirror, respectively. This is in agreement with the measured result. The finesse for the film-in cavity is significantly dropped, mainly owing to the absorption of a doped silica film in the cavity, as the measured absorption loss of the silica film is 0.3% at the wavelength of 1535 nm.

3. CAVITY LASER ASSEMBLY AND MEASUREMENT

After the properties of the fiber cavity are characterized, we assemble the cavity to a device with shear piezoelectric transducers (PZTs, Noliac CSAP03) to adjust cavity length. They are glued on a piece of stainless steel mount with a thick base to make the assembled device emit a stable laser. A photo of the device is shown in Fig. 3(a). From the picture we can see the upright part serves as a mount for the flat mirror. The mirror is stuffed into half-inch hole and fixed by a snap ring and a top wire at the same time. The bottom left part is the base for a stack composed of a ceramics piece, a PZT, and a V-groove, where a ceramics piece is used for insulation. They are glued in place using epoxy (Epotek 301). When all of them are prepared, the fiber mirror will be aligned to the flat mirror with proper cavity length by the six-axis stage and glued in the V-groove by UV curing adhesive (Epotek H20E). A fiber microcavity device is finally accomplished after the UV adhesive is cured, and it is used in a microcavity laser experiment.
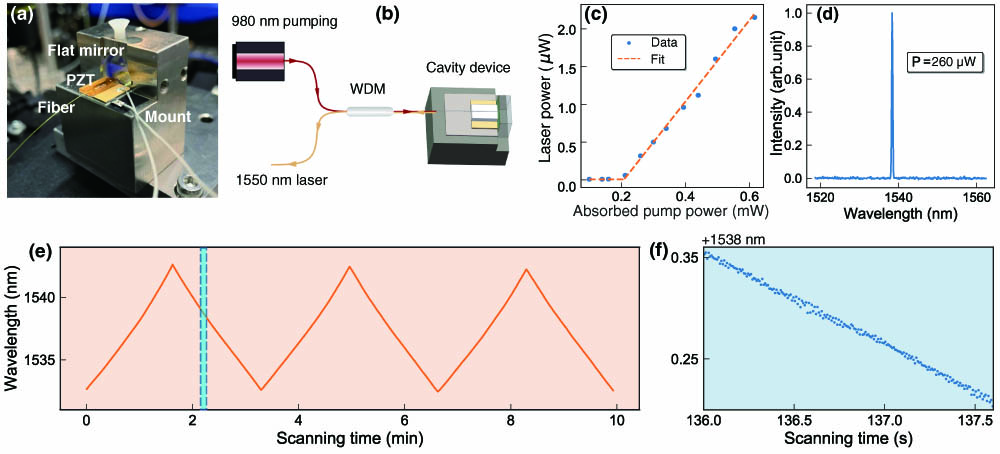
Fig. 3. (a) Image of the assembled microlaser device. A thick stainless steel bracket is used to support the device, the fiber mirror is glued on a shear PZT, and the flat mirror is mounted on the right part of the bracket. (b) Schematic of the fiber cavity laser. A 980 nm laser is used as the pumping source, and a fiber-based WDM (980/1550 nm) is used to separate the 1550 nm laser output from the 980 nm pumping input. (c) Laser threshold measurement of the fiber cavity laser. The threshold is 210 μW with pump wavelength at 980 nm and lasing wavelength at 1538 nm. (d) The lasing spectrum beyond the threshold, which indicates a single longitudinal mode. (e) Tunable range measured by a wavelength meter; (f) is the zoomed chart of the shade range in (e), which shows that the laser tunable range without mode hopping can reach 10 nm.

下载图片 查看所有图片

To make the device emit laser near 1550 nm, a 980 nm pumping laser is coupled into a cavity device through a wavelength division multiplexer (WDM) as depicted in Fig. 3(b). A 1550 nm laser from the microcavity is coupled back from the input fiber of the device and injected to the 1550 nm port of the WDM. Next, the identities of the fiber cavity laser are measured below.

The laser threshold of the fiber cavity laser is measured by changing the power of the 980 nm pump laser. For the Yb3+/Er3+ co-doped silica film, the absorption coefficient of the 980 nm laser is measured as 4.5%. The output intensity of the microlaser at 1538 nm along with the absorbed pumping power is plotted in Fig. 3(c). Based on a linear fitting, a threshold of 210 μW is demonstrated. Above the threshold, the laser output power increases linearly with the absorbed pump power. To verify that the output laser has a single longitudinal mode, the laser beyond the threshold is measured by an optical spectrum meter (HORIBA iHR 550), and the measured spectrum is shown in Fig. 3(d). It is also in single transverse mode because the output laser is coupled into the fundamental fiber mode.

The wavelength tunability is a very important function for a microlaser. In this work, we achieve a large tunable range of the output wavelength from 1532 to 1542 nm by electrically controlling the cavity length. The free stroke of the shear PZT is 1.5 μm; as a cavity length variation of 0.5 μm (from 47.7 to 48.2 μm) can drive the cavity mode from 1532 to 1542 nm through Fig. 3(e), the PZT has the ability to tune the laser wavelength more than 10 nm. To measure the no-hopping tunable range, we couple the output laser into an infrared wavelength meter and synchronously record the wavelength with a 5 MHz sawtooth signal driving the PZT. The measurement result is shown in Fig. 3(e); the dynamic curve of the laser wavelength is also a sawtooth wave that is consistent with the drive signal of the piezo, and it shows a peak-to-peak value of 10 nm. To further confirm whether it tunes without mode hopping, we present a partial enlargement view of Fig. 3(e) in Fig. 3(f). It intercepts part of the data within 1.5 s to show the details and presents a continuous and linear tunable result. Except for the measurement by a wavelength meter to show the no-hopping tunable range, the data recorded by the optical spectrum meter is also presented in the form of a waterfall diagram as shown in Fig. 4. By changing the cavity length 12.5 nm each step, 45 sets of laser spectra are grouped together in the waterfall diagram, which shows the intensity variation during wavelength tuning.
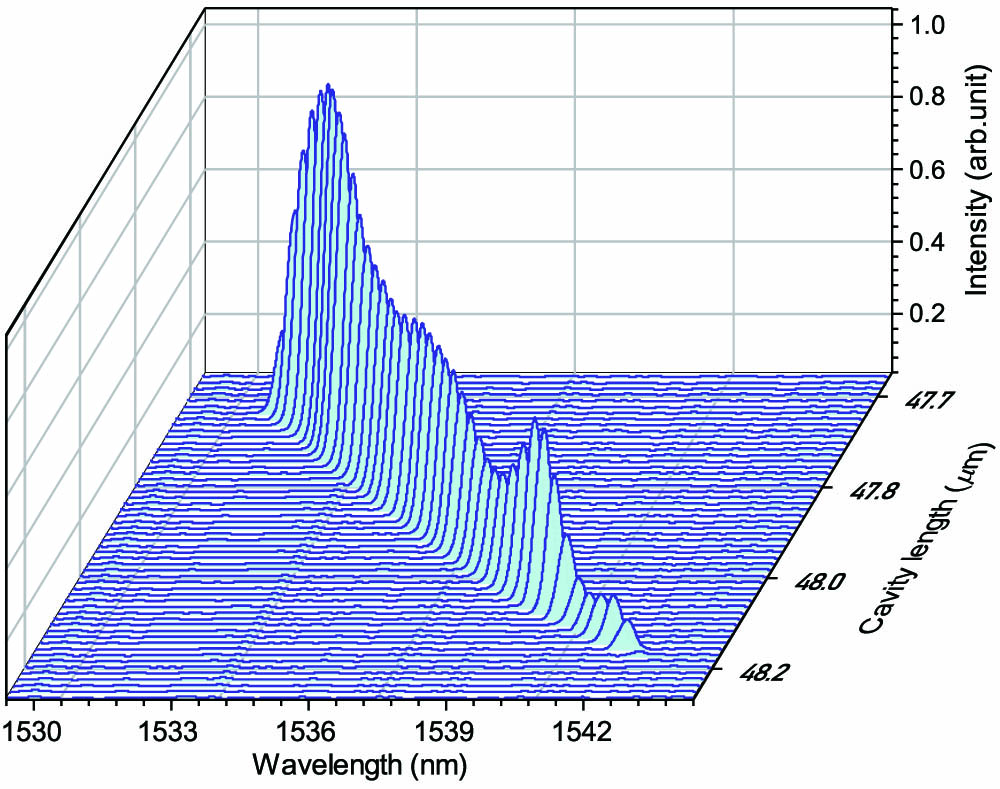
Fig. 4. Waterfall diagram of emission spectrum of the cavity laser. It shows the intensity variation versus the tunable wavelength.

下载图片 查看所有图片

Here, we show that the wide-band tunable laser can be tuned rapidly at the same time. Benefitting from the high resonance frequency of the shear PZT and the small mass of the fiber mirror, where the shear PZT is used to scan the cavity length, the theoretically achievable tunable frequency is limited by the no-load resonance frequency of the shear PZT to about 1.75 MHz. However, the mechanical resonance frequency of the laser device may be a more restrictive restriction.

A frequency response analyzer is used to investigate the mechanical resonance frequency of the fiber cavity laser assembly. At first, we measure a transmission spectrum by coupling the Toptica 1550 nm laser to the cavity and scanning the PZT to change cavity length; the envelope of one transmission peak is presented in Fig. 5(a). Then we create a “small signal” from the full spectrum by applying a certain bias voltage and small amplitude sinusoidal modulation to the electrode of the PZT. Driven by the small sinusoidal signal, the spectrum response with a synchronized frequency (160 Hz) is shown in the picture. Based on this small signal, we measure the mechanical resonance frequency by monitoring the magnitude and phase stability of the response signal in the frequency domain. The results recorded by a frequency response analyzer are presented in Fig. 5(b). As the sinusoidal drive frequency is increased, we eventually encounter mechanical resonances that induce the first π-phase delay and violent moves of amplitude at 60 kHz. Therefore, we achieve a fast tuning rate at 60 kHz. The mechanical resonance frequency can be further improved by minimizing the length of overhanging fiber from the piezo, reducing the thickness of the epoxy holding the fiber and optimizing the geometry of the mount [19].

Fig. 5. Mechanical bandwidth of the laser device by measuring the driving response. (a) The envelope of the transmission spectrum in green and the spectrum response driven by the small sinusoidal signal. (b) Frequency response diagram of the assembled laser device. From both magnitude and phase variations, the first direct resonance is indicated at 60 kHz.

下载图片 查看所有图片

Besides, we independently demonstrate the laser linewidth by measuring fringe contrast based on a Michelson interferometer with different-length delays. Figure 6(a) presents the experimental configuration of the measurement system. A Michelson interferometer splits the 1550 nm laser into two arms: a short arm with a fiber phase shifter and a long arm with relatively long round-trip time delay Δt. As in the standard Michelson configuration, each arm is retro-reflected by a Faraday reflector, correctly compensating for polarization changes that are caused by the polarization-free fiber. Here is also a fiber attenuator to guarantee the equal intensity of the two arms. Recombination of the two arms generates interference fringes that can be detected by a photodiode and presented on an oscilloscope. Figure 6(b) is an interference fringe when the delay length is at 20 m. Fringe contrast can be calculated by where Imax and Imin are maximum and minimum intensity in the interference fringe.
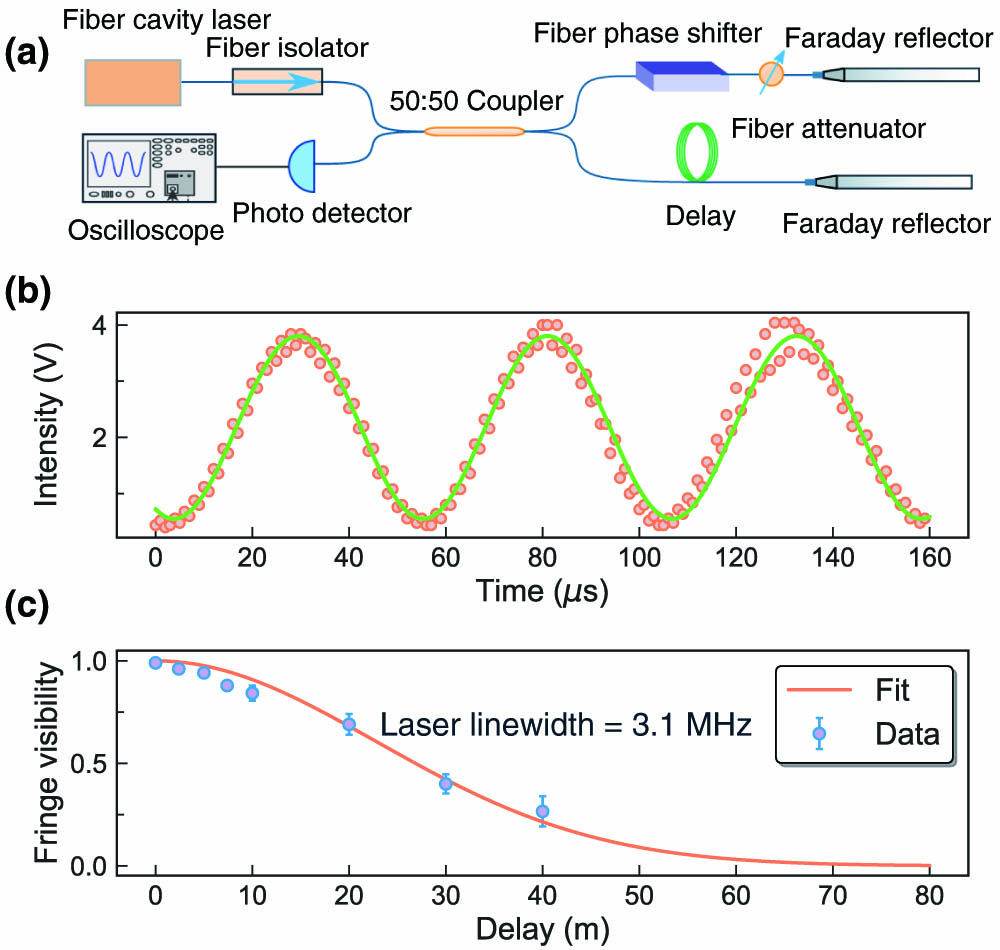
Fig. 6. Measurement of the laser linewidth. (a) Schematic of laser linewidth measurement, showing the Michelson interferometer with two arms: a short arm with a fiber phase shifter and a long arm producing optical path difference by different-length delay. Each arm is retro-reflected by the Faraday reflector and a fiber attenuator to guarantee the same intensity of the two arms. The interference fringes of the two arms are shown on an oscilloscope. (b) The interference fringes at the delay length of 20 m (fit overlaid in green). (c) The measured results (blue) are fitted by the theoretical curve (orange) corresponding to the laser linewidth of 3.1 MHz.

下载图片 查看所有图片

On the other hand, considering the power spectrum of the laser with a Gaussian noise, the fringe contrast V is proportional to the normalized Fourier transform of the source power spectrum [32], which is where gaus(ν)=exp(πν2), Δν is the linewidth of the laser, and the time difference Δt corresponds to the optical path difference L=cΔt, which arises from the delay in the long arm. We set different fiber delays and measured the corresponding fringe contrasts; the results are shown in Fig. 6(c). By applying Eq. (3) to fit the measured results, the laser linewidth is obtained as 3.1±0.2  MHz.

In order to confirm the stability of the output laser, we measure the laser power at a fixed wavelength of 1535 nm. The results are recorded by an optical power meter with a sample interval of 1 s for continual 4 h. Under ambient conditions, the measured intensity of the output laser is displayed in Fig. 7, which corresponds to the stability of ±0.85%. The stability of the output power can be further improved if a temperature-controlled environment is created.
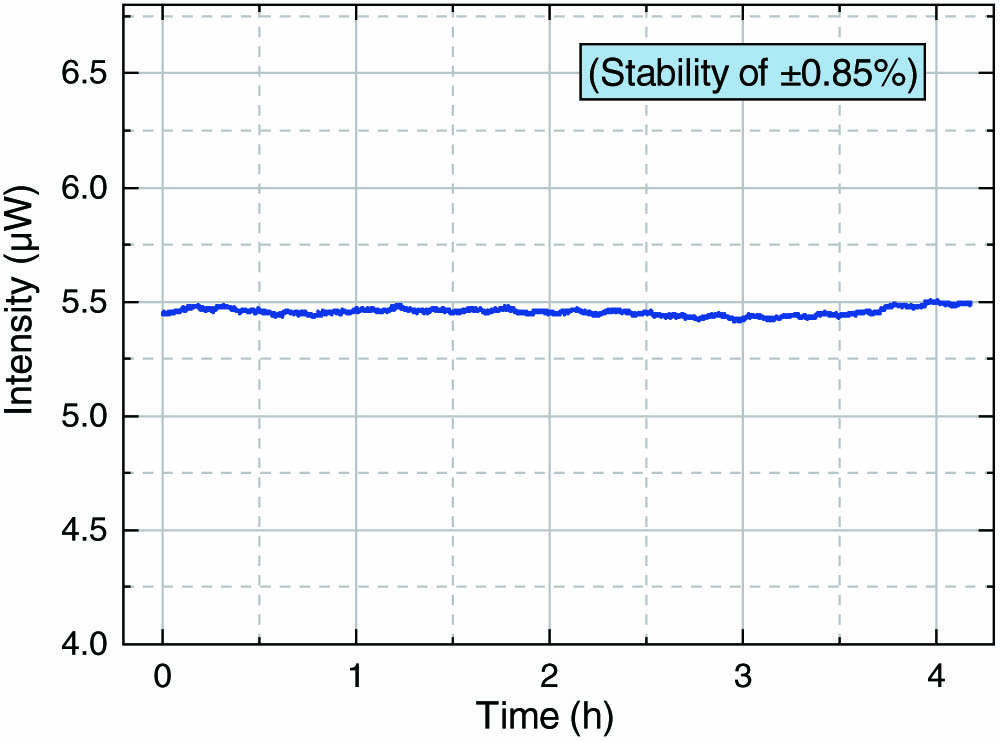
Fig. 7. Stability measurement of the laser intensity, corresponding to the stability of ±0.85% for 4 h.

下载图片 查看所有图片

4. CONCLUSION AND OUTLOOK

In summary, we have designed and fabricated an infrared single-mode microlaser based on an FFPC, and demonstrated fast chirp of 1.6×10¹⁷  Hz/s, wide-band tuning range of 1.3 THz without mode hopping, and narrow linewidth of 3.1 MHz at the same time. As a bare FFPC with concave mirrors has achieved high finesse in excess of 100,000 [13], the finesse of the FFPC in our device can be further improved by decreasing the absorption of the doped film inside the cavity, and thus the linewidth of the laser can be much narrower than 1 MHz. The integrated design of the cavity mount allows a high mechanical bandwidth of 60 kHz, which corresponds to a frequency scan rate of 1.6×10¹⁷  Hz/s. The tuning frequency can also be further increased by reducing the load of epoxy on the shear PZT and optimizing the geometry of the mount. These combined properties make it able to enhance the spatial resolution, the measuring range, and the measurement speed in optical communication, sensing, FMCW radar, and high-resolution imaging.

References

[1] Z. Sun, D. Popa, T. Hasan, F. Torrisi, F. Wang, E. J. Kelleher, J. C. Travers, V. Nicolosi, A. C. Ferrari. A stable, wideband tunable, near transform-limited, graphene-mode-locked, ultrafast laser. Nano Res., 2010, 3: 653-660.

[2] S. Wu, S. Buckley, J. R. Schaibley, L. Feng, J. Yan, D. G. Mandrus, F. Hatami, W. Yao, J. Vučković, A. Majumdar, X. Xu. Monolayer semiconductor nanocavity lasers with ultralow thresholds. Nature, 2015, 520: 69-72.

[3] S. Smith, F. Zarinetchi, S. Ezekiel. Narrow-linewidth stimulated Brillouin fiber laser and applications. Opt. Lett., 1991, 16: 393-395.

[4] M. C. Huang, Y. Zhou, C. J. Chang-Hasnain. A nanoelectromechanical tunable laser. Nat. Photonics, 2008, 2: 180-184.

[5] L. He, Ş. K. Özdemir, L. Yang. Whispering gallery microcavity lasers. Laser Photon. Rev., 2013, 7: 60-82.

[6] S. Spillane, T. Kippenberg, K. Vahala. Ultralow-threshold Raman laser using a spherical dielectric microcavity. Nature, 2002, 415: 621-623.

[7] S. Zhu, L. Shi, B. Xiao, X. Zhang, X. Fan. All-optical tunable microlaser based on an ultrahigh-Q erbium-doped hybrid microbottle cavity. ACS Photon., 2018, 5: 3794-3800.

[8] Y. Yang, F. Lei, S. Kasumie, L. Xu, J. M. Ward, L. Yang, S. N. Chormaic. Tunable erbium-doped microbubble laser fabricated by sol-gel coating. Opt. Express, 2017, 25: 1308-1313.

[9] L. Yang, K. Vahala. Gain functionalization of silica microresonators. Opt. Lett., 2003, 28: 592-594.

[10] E. P. Ostby, L. Yang, K. J. Vahala. Ultralow-threshold Yb3+:SiO2 glass laser fabricated by the solgel process. Opt. Lett., 2007, 32: 2650-2652.

[11] J. M. Ward, Y. Yang, S. N. Chormaic. Glass-on-glass fabrication of bottle-shaped tunable microlasers and their applications. Sci. Rep., 2016, 6: 25152.

[12] Y. Liu, L. Shi, X. Xu, P. Zhao, Z. Wang, S. Pu, X. Zhang. All-optical tuning of a magnetic-fluid-filled optofluidic ring resonator. Lab Chip, 2014, 14: 3004-3010.

[13] D. Hunger, T. Steinmetz, Y. Colombe, C. Deutsch, T. W. Hänsch, J. Reichel. A fiber Fabry-Perot cavity with high finesse. New J. Phys., 2010, 12: 065038.

[14] E. Janitz, M. Ruf, M. Dimock, A. Bourassa, J. Sankey, L. Childress. Fabry-Perot microcavity for diamond-based photonics. Phys. Rev. A, 2015, 92: 043844.

[15] M. Steiner, H. M. Meyer, C. Deutsch, J. Reichel, M. Köhl. Single ion coupled to an optical fiber cavity. Phys. Rev. Lett., 2013, 110: 043003.

[16] K. Zhou, J.-M. Cui, Y.-F. Huang, Z. Wang, Z.-H. Qian, Q.-M. Wu, J. Wang, R. He, W.-M. Lv, C.-K. Hu, Y. J. Han. An ultraviolet fiber Fabry-Pérot cavity for florescence collection of trapped ions. Chin. Phys. Lett., 2017, 34: 013701.

[17] F. Haas, J. Volz, R. Gehr, J. Reichel, J. Estève. Entangled states of more than 40 atoms in an optical fiber cavity. Science, 2014, 344: 180-183.

[18] K. N. Dinyari, R. J. Barbour, D. A. Golter, H. Wang. Mechanical tuning of whispering gallery modes over a 0.5 THz tuning range with MHz resolution in a silica microsphere at cryogenic temperatures. Opt. Express, 2011, 19: 17966-17972.

[19] E. Janitz, M. Ruf, Y. Fontana, J. Sankey, L. Childress. High mechanical bandwidth fiber-coupled Fabry-Perot cavity. Opt. Express, 2017, 25: 20932-20943.

[20] K. Numata, J. R. Chen, S. T. Wu. Precision and fast wavelength tuning of a dynamically phase-locked widely-tunable laser. Opt. Express, 2012, 20: 14234-14243.

[21] P. A. Roos, R. R. Reibel, T. Berg, B. Kaylor, Z. W. Barber, W. R. Babbitt. Ultrabroadband optical chirp linearization for precision metrology applications. Opt. Lett., 2009, 34: 3692-3694.

[22] X. Zhang, J. Pouls, M. C. Wu. Laser frequency sweep linearization by iterative learning pre-distortion for FMCW lidar. Opt. Express, 2019, 27: 9965-9974.

[23] BurdicW. S., Radar Signal Analysis (Prentice-Hall, 1968), Chap. 5.

[24] J. Zheng. Analysis of optical frequency-modulated continuous-wave interference. Appl. Opt., 2004, 43: 4189-4198.

[25] J. O. White, M. Harfouche, J. Edgecumbe, N. Satyan, G. Rakuljic, V. Jayaraman, C. Burgner, A. Yariv. 1.6 kW Yb fiber amplifier using chirped seed amplification for stimulated Brillouin scattering suppression. Appl. Opt., 2017, 56: B116-B122.

[26] J. White, A. Vasilyev, J. Cahill, N. Satyan, O. Okusaga, G. Rakuljic, C. Mungan, A. Yariv. Suppression of stimulated Brillouin scattering in optical fibers using a linearly chirped diode laser. Opt. Express, 2012, 20: 15872-15881.

[27] M. Y. Jeon, N. Kim, S.-P. Han, H. Ko, H.-C. Ryu, D.-S. Yee, K. H. Park. Rapidly frequency-swept optical beat source for continuous wave terahertz generation. Opt. Express, 2011, 19: 18364-18371.

[28] MittlemanD., “Terahertz imaging,” in Sensing with Terahertz Radiation (Springer, 2003), pp. 117153.

[29] N. Satyan, G. Rakuljic, A. Yariv. Chirp multiplication by four wave mixing for wideband swept-frequency sources for high resolution imaging. J. Lightwave Technol., 2010, 28: 2077-2083.

[30] N. Satyan, A. Vasilyev, G. Rakuljic, V. Leyva, A. Yariv. Precise control of broadband frequency chirps using optoelectronic feedback. Opt. Express, 2009, 17: 15991-15999.

[31] M. Phelps, M. M. Reid, R. Douglas, A.-M. van Veggel, V. Mangano, K. Haughian, A. Jongschaap, M. Kelly, J. Hough, S. Rowan. Strength of hydroxide catalysis bonds between sapphire, silicon, and fused silica as a function of time. Phys. Rev. D, 2018, 98: 122003.

[32] J. M. Simon, S. A. Comastri. Fringe localization depth. Appl. Opt., 1987, 26: 5125-5129.

Xin-Xia Gao, Jin-Ming Cui, Zhi-Hao Hu, Chun-Hua Dong, Jian Wang, Yun-Feng Huang, Chuan-Feng Li, Guang-Can Guo. Fast and wide-band tuning single-mode microlaser based on fiber Fabry–Pérot microcavities[J]. Photonics Research, 2020, 8(10): 10001642.


引用该论文: TXT   |   EndNote

相关论文

加载中...

关于本站 Cookie 的使用提示

中国光学期刊网使用基于 cookie 的技术来更好地为您提供各项服务,点击此处了解我们的隐私策略。 如您需继续使用本网站,请您授权我们使用本地 cookie 来保存部分信息。
全站搜索
您最值得信赖的光电行业旗舰网络服务平台!