First experimental demonstration of coherent beam combining of more than 100 beams  Download: 788次
1. INTRODUCTION
With the increasing demands of high-power lasers in industrial processing, medical care, and scientific research domains, fiber lasers have drawn more and more interest and attention for their advantages such as compact structure, convenient maintenance, and high efficiency [1,2]. As a promising method to get higher output power while maintaining excellent beam quality, coherent beam combining (CBC) breaks through the limitations of the monolithic fiber laser [3–5]. The fiber laser array can also be utilized for generating vortex beam, which can be used in free-space optical communication, optical manipulation, and so on [6,7]. Increasing the number of combining channels and enhancing the output power of a single channel are two approaches to improve the overall output power. In the last decade, high average combined power has been improved to multi-kW [8–11], and over 10 kW output power has been achieved in both pulsed and continuous wave CBC systems recently [8,12]. In the aspect of the CBC of a large number of fiber lasers, many phase-locking methods have been used for the CBC of tens of fiber lasers, such as interference measurement, stochastic parallel gradient descent (SPGD) algorithm, and phase-intensity mapping [13–20]. In 2006, 48 fiber lasers were coherently combined by an interference fringes measurement [21]. In 2011, the CBC of 64 fiber lasers was demonstrated by the shearing interferometer technique [16]. In 2019, the CBC of 60 fiber lasers by SPGD algorithm was realized [15,22]. In 2020, 61 fs fiber lasers were coherently combined by an interference fringes measurement [14]. However, the array scale of CBC still remains at tens of elements. With the scaling of lasers number, combining efficiency degrades because of the system errors and control bandwidth. The influences of combining non-ideal lasers have been theoretically studied [23,24]. Nevertheless, the experimental analysis of a large number of laser arrays has rarely been reported.
In this work, we demonstrated the CBC of 107 beams by SPGD algorithm for the first time, to the best of our knowledge, which is the largest fiber laser array for CBC. The fringe contrast of the far-field was , and the ratio of the energy in the central lobe was when the system was in the closed loop. The system errors were analyzed in detail, and corresponding numerical simulations were carried out. We also proposed a solution to increase the control bandwidth and combining efficiency by gradient processing inspired by the training process of deep learning.
2. EXPERIMENT SETUP
The experiment setup is shown in Fig. 1. The inset is a three-dimensional (3D) model of the experimental system. A single frequency laser seed with 1064 nm central wavelength was amplified by a pre-amplifier, and then split into 120 sub-channels by using a splitter (only six outputs were used) and six splitters. Limited by the number of phase modulators available in our experiment, 107 phase modulators were inserted in the laser channels for phase control. They were then connected directly to the combiner without second amplification by polarization maintaining fibers with a length of 2 m. The combiner was composed of two parts: an optical fiber connector array based on a flexible hinge, and a collimating lens array. The homemade connector had the ability to adjust the 3D position of the fiber tip based on the flexure hinge technique. The collimating lenses were configured as a hexagon distribution, and the maximum number of outputs of the combiner was 127. The diameter of collimating lens was 23 mm and the distance of the adjacent lenses was 25 mm. Thus, the structure fill factor was 92%. The beam waist diameter after collimating was 21 mm. Then the size of the output laser array was compressed by a concave mirror and a convex mirror. The compressed laser array was divided into two parts by a mirror. Most of the light was emitted to free space; the rest of the light was further divided into two parts. One part was focused on a charged-coupled device (CCD) to observe the far-filled pattern; another was focused on a photoelectric detector (PD) with a pinhole to collect data on the evaluation function. The phase controller made by a field-programmable gate array (FPGA) calculated control voltages of each channel on the basis of the evaluation function acquired by the PD. The execution frequency of the SPGD algorithm [25] was over 1 MHz/s to compensate phase noises. Compared to our previous works [22], the parameters of the SPGD algorithm such as gain and time delay, were optimized. An adaptive acquiring device is currently in the development process to avoid the saturation of the analog-to-digital converter (ADC). This is because when the array is larger, there is a big difference in the energy acquired in the open and closed loops, which may deactivate the algorithm.
The structure of a homemade optical fiber connector is shown in Fig. 2. The overall view of the connector is shown in Fig. 2(a). The homemade connector is formed by a sandwich structure, including base, briquetting, and connector with a flexing hinge. The base and briquetting play roles in supporting fixing and the part that actually works is the connector with the flexing hinge in the middle. The connector in the middle includes four parts: an outer layer, a flexing hinge, an inner connector, and a fastening sheet. The outer layer and the inner connector are linked by the flexing hinge. Four screw holes are put in the base by pressing the fastening sheet to extrude the inner connector movements in the x and y directions. Correspondingly, the tip of fiber moves, and the tilt of beam changes as shown in Fig. 2(d). The z-position of the fiber tip can also be changed by adjusting the fixed location of the connector in the array. Thus, the collimation of beams changed as well. The tilt of each beam in the far-field was adjusted carefully by observing the position of each beam at the CCD located in the far-field. The collimation of each beam was measured by a shearing interferometer.

Fig. 2. Structure of optical fiber connector. (a) Overall view. (b) Bottom view. (c) Sectional view. (d) Principle of operation for homemade connector.
3. EXPERIMENTAL RESULTS AND DISCUSSION
In our experiment, when the system was in open loop, the pattern in the far-field was disordered and varied time-wise. The 40 s long-exposure graph of the open loop is shown in Fig. 3(a). When the system was in the closed loop, the far-field pattern had a distinct main lobe in the center and six weaker side lobes; the 40 s long-exposure graph is shown in Fig. 3(b). The fringe contrast is with the definition of , where and are the maximum optical intensity and the adjacent minimum optical intensity on the intensity pattern. The energy in the central lobe was obviously improved. The ideal pattern of the far-field with no tilt and phase error is shown in Fig. 3(c). The calculated power in the bucket (PIB) with the solid angle of , where is the diameter of the laser array, in the experiment is , and the ideal value of Fig. 3(c) is . The combining efficiency is , and the total combined power is .

Fig. 3. Long-exposure far-field pattern. (a) Measured in open loop. (b) Measured in close loop. (c) Simulated result.
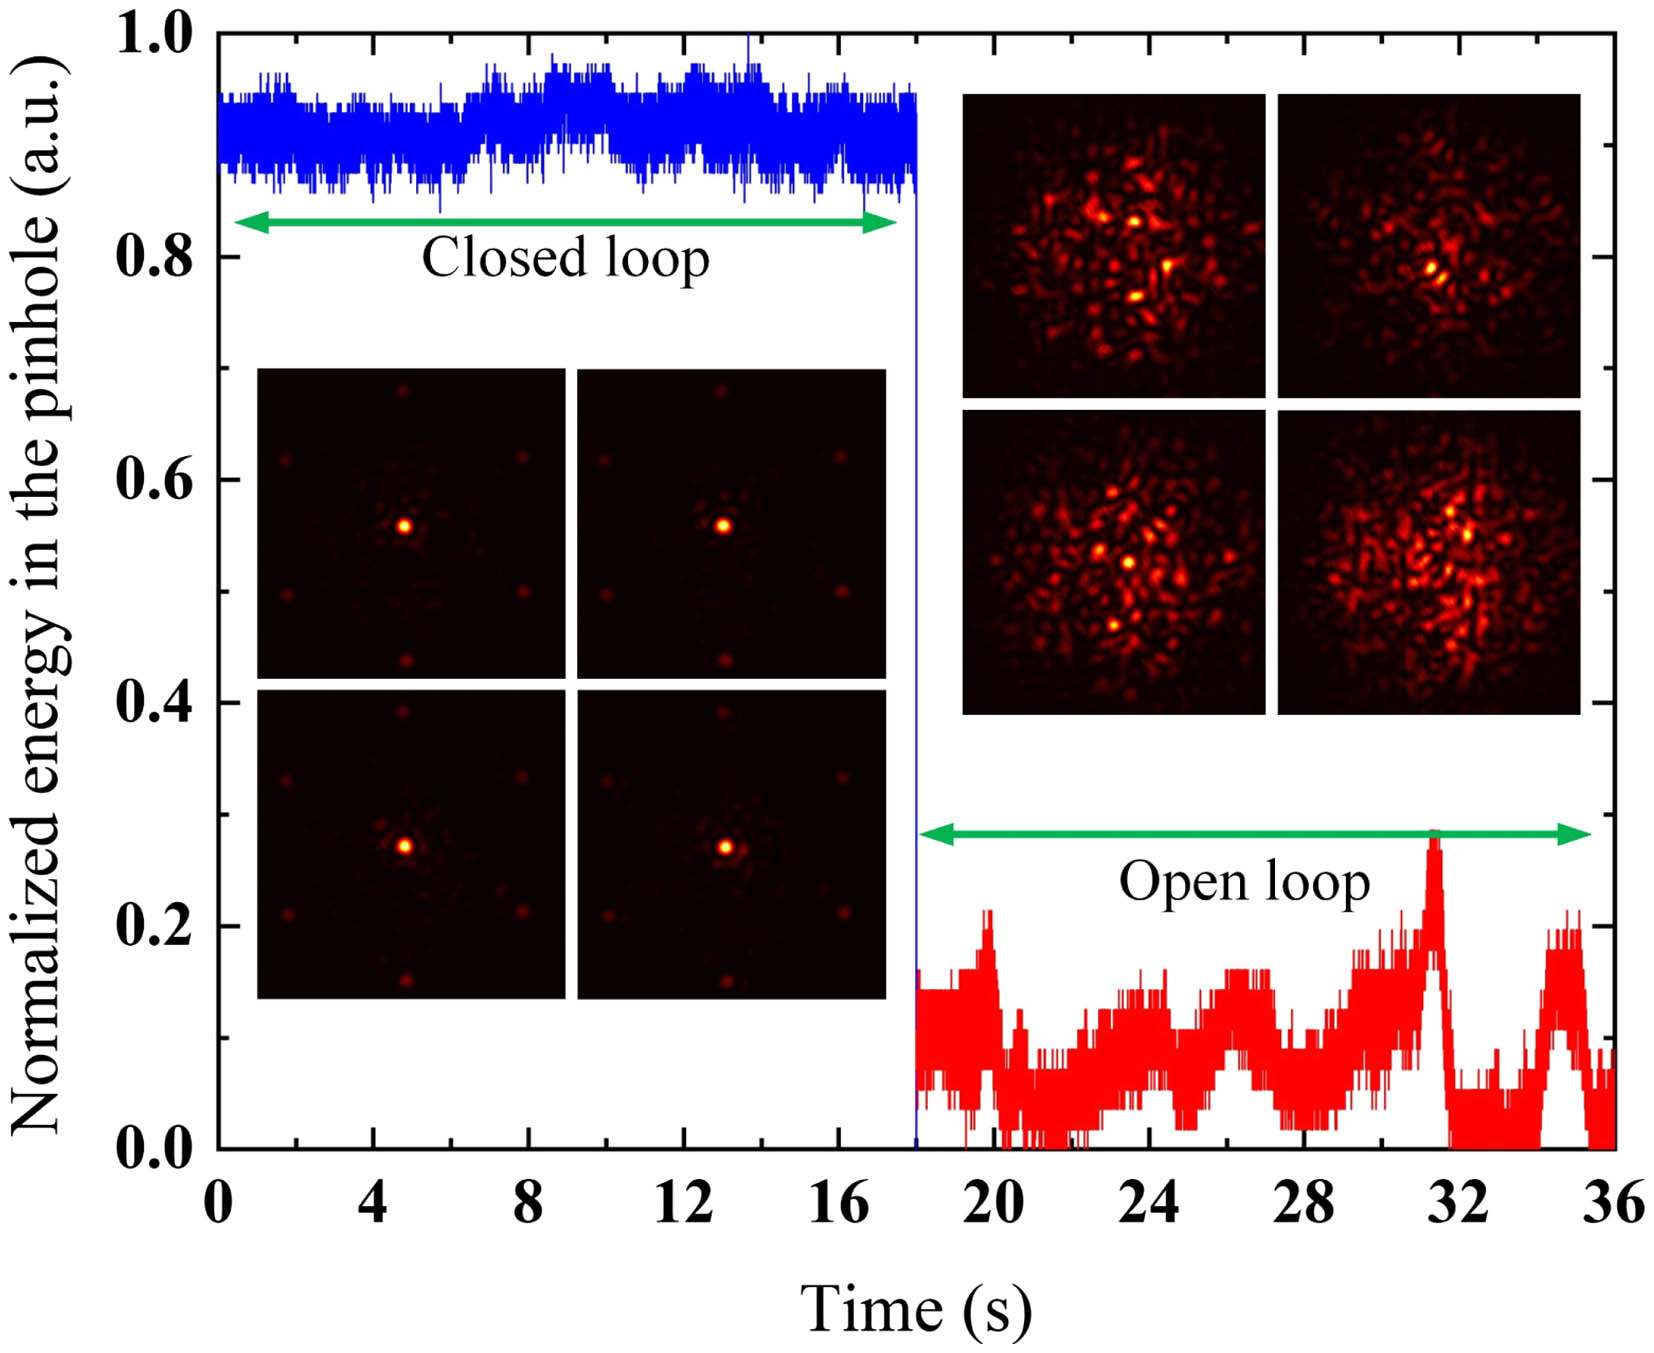
The normalized variation of energy in the pinhole in the closed and the open loops is shown in Fig. 4. There are four typical photographs of closed and open loops, respectively, as shown in Fig. 4. We can find that the normalized energy was above 0.9 most of the time and that the patterns at different moments were similar when the system was in the closed loop. When the system was in open loop, the energy in the pinhole was at a low level and drifted randomly, and the pattern was time varying.
However, there was a big difference between the ideal state and the experimental result. The following sections will examine the reasons for the decline of the PIB in our system. We theoretically and experimentally analyzed the system errors including the dynamic tilt error, the piston phase error, and the power inconsistency. Among those errors, the dynamic tilt error was emphasized.
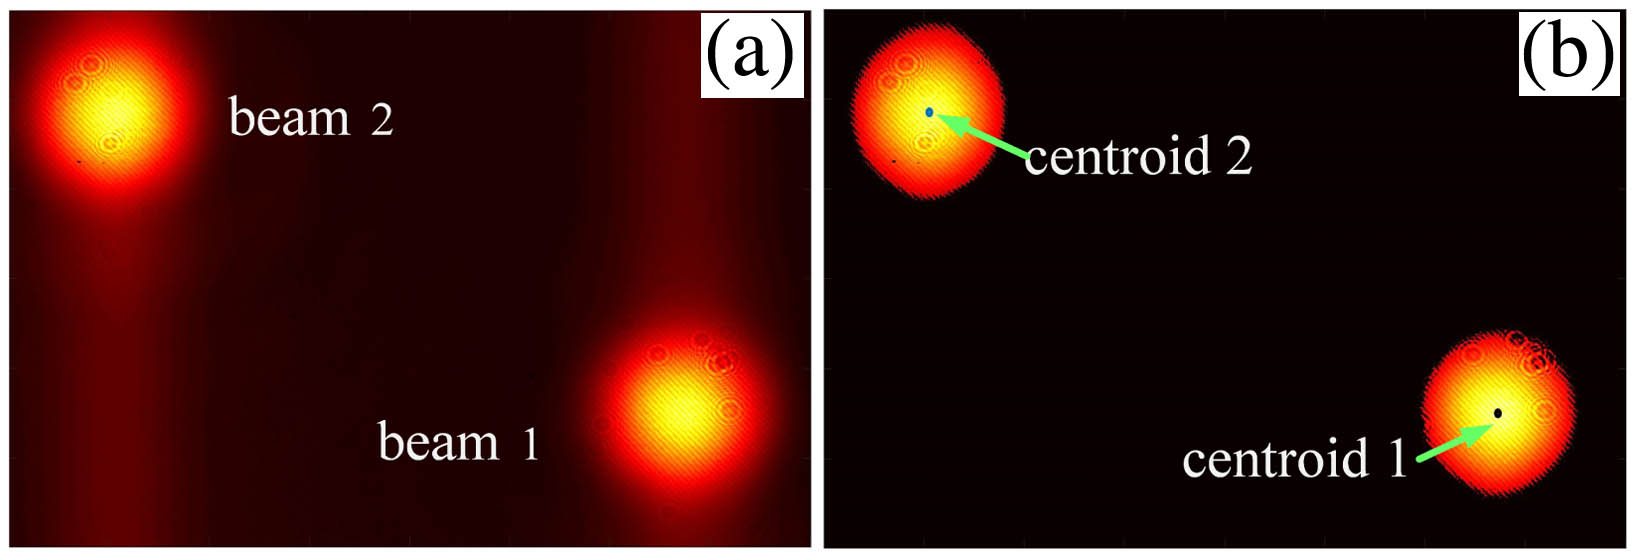
First, the dynamic tilt error was measured and analyzed. There were static tilt errors and dynamic tilt errors in the system. The dynamic tilt error mainly resulted from the mechanical vibration. The static tilt error was caused by an operating error, mechanical precision when adjusting the static tilt angle by the homemade optical fiber connector. The dynamic tilt error was particularly analyzed and further measured by a statistical approach as follows. Two adjoining elements in the laser array were randomly selected to find out the general distribution law of dynamic tilt errors of the single beam and the potential relationships of dynamic tilt errors between different beams. By adjusting the optical fiber connectors, the two adjoining beams were focused on different places in the far-field, as shown in Fig. 5(a). So, the tilt dithering of the two adjoining beams can be observed at the same time. The framerate of the camera was frames per second. For time average, the speed of the camera had little influence on the distribution law observed. The laser spots were segmented from the background by the fuzzy c-means (FCM) algorithm [26]. The FCM algorithm is an unsupervised fuzzy clustering method and has been widely used in image segmentation and data classification. Then the centroids of each beam spot were further calculated, as shown in Fig. 5(b).
A total of 300 frames in about 40 s were acquired for analysis. Then frequency histograms of the relative tilt angles were drawn, and the fitting process was conducted on the histograms. The frequency histograms are shown in Fig. 6. Relative tilt errors of and of beam spot 1 ( and ) are respectively shown in Figs. 6(a) and 6(b). Relative tilt errors of and of beam spot 2 ( and ) are respectively shown in Figs. 6(c) and 6(d). The blue lines in Fig. 6 are fitting curves, where means normal distribution with a mean value of and a standard deviation of . The origin in Fig. 6 is the statistic average. In each direction, the deviation obeys normal distribution and fits well, and the standard deviations of the two beam spots are very close to each other. This indicates that the tilt dithering is general in the and axes in each beam spot.
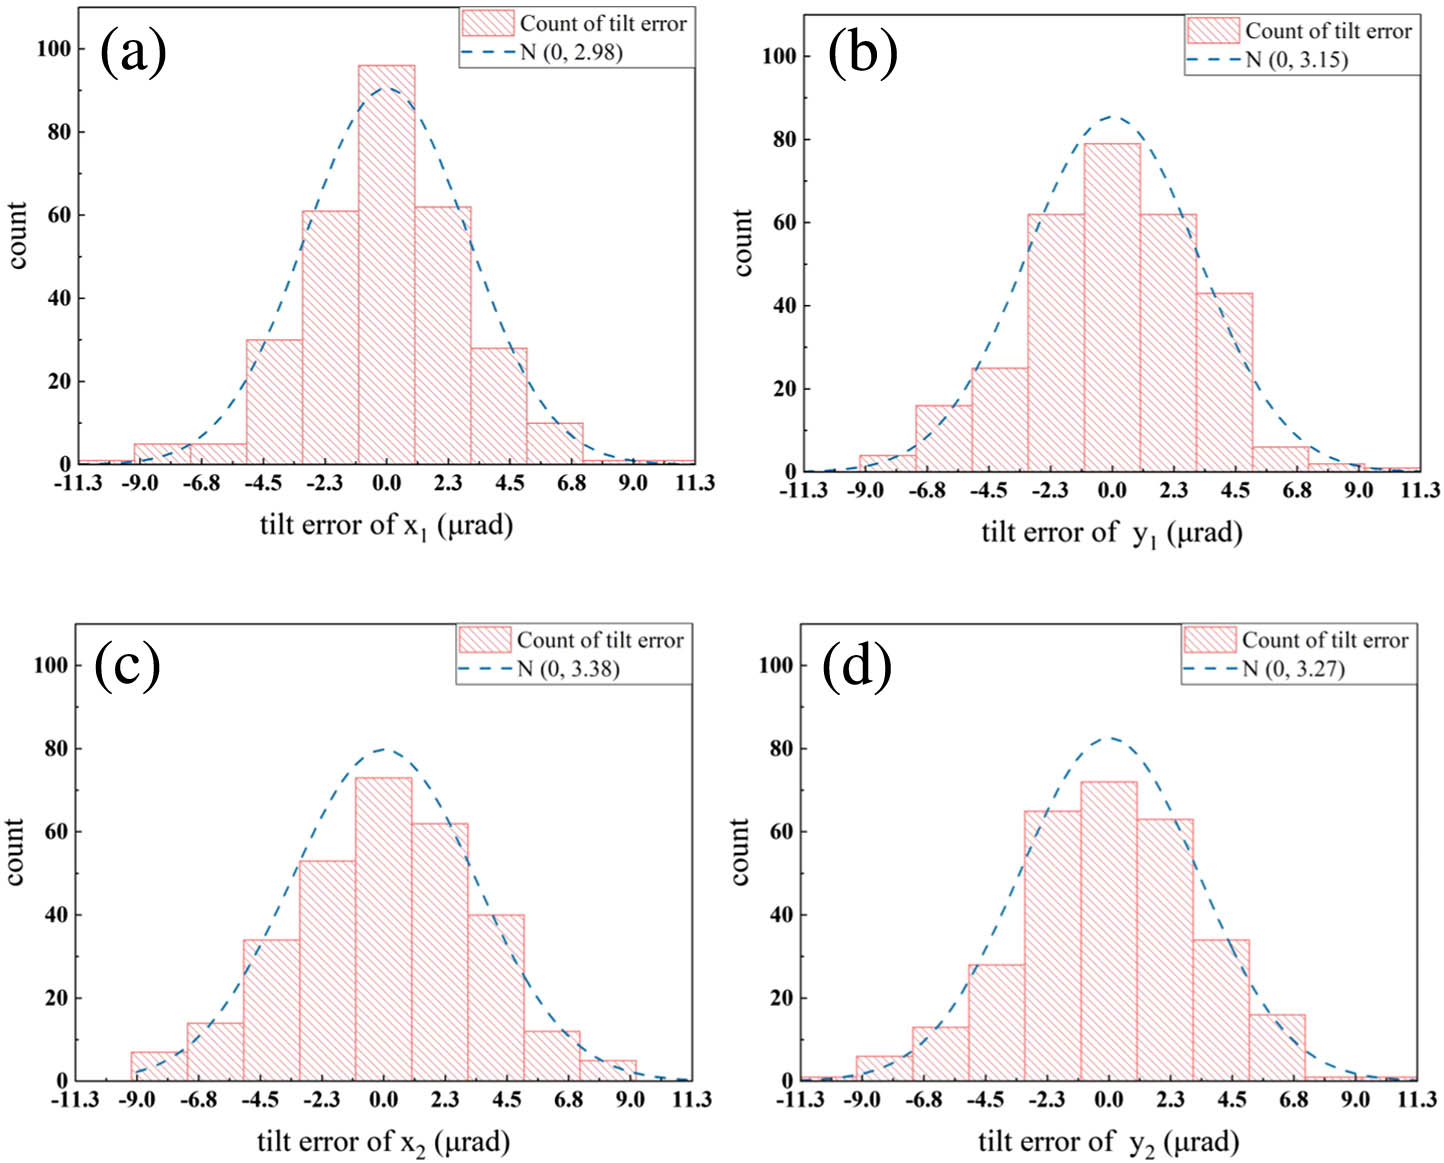
Fig. 6. Frequency histogram and fitting curve of relative tilt angles of (a)
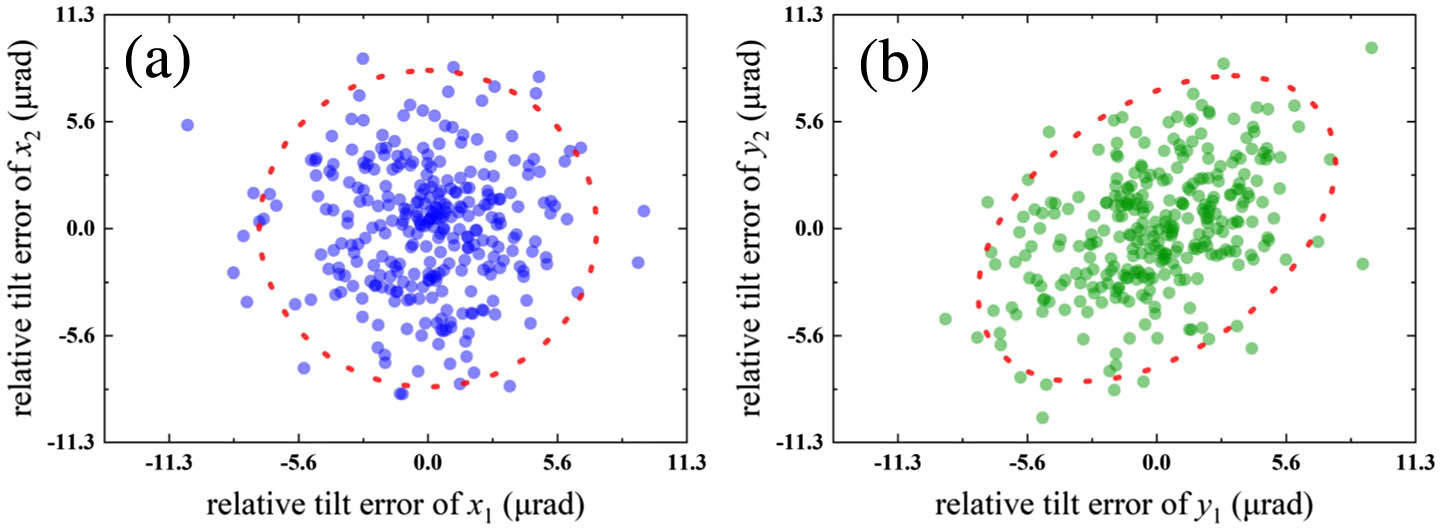
Considering the condition of the experiment, the tilt dithering of the -axis of the two beam spots, which is perpendicular to the optical platform, may be correlative. Scatter plots of the -axis and the -axis are shown in Fig. 7. The red ellipses in Fig. 7 are 95% confidence ellipses, which reflect the distribution law of each axis of the two beam spots. Intuitively, the correlation of the -axis is small and there is a correlation between the -axis of the two beam spots. Pearson correlation is a measurement of the linear correlation between two variables [27]. The linear correlation of the -axis and the -axis between beam spot 1 and beam spot 2 was calculated by Pearson correlation analysis. The Pearson correlation coefficient of the -axis was −0.02. When the Pearson correlation coefficient is closer to 0, the correlation is lower. There is no significant relationship between the tilt dithering of the -axis of the two beam spots (, where is at a significant level). Different from the -axis, the Pearson correlation coefficient of the -axis was 0.43, which means there is a moderate correlation between the -direction of different beam spots, and that the significance level is extremely high (P < 5.7 × 10⁻¹⁵). Except for the two adjoining beams mentioned above, the array elements in the emitting surface of the different distance obey the similar law. Thus, it can be considered that the tilt dithering of the -axis has no linear correlation, and that the tilt dithering of the -axis is partially linearly correlative. We may as well set the weight of the common dithering of the -axis between the array elements as a Pearson correlation coefficient in error evaluation. The correlation of tilt dithering in the -axis may help control the tilt angle.
When the environment of the laboratory was quieter, the value of the standard deviation of the tilt dithering declined from to . Taking the dynamic tilt errors into the numerical simulation, the result shows that the PIB drops from to , which makes a major contribution to the loss of the PIB.
Then, the piston phase error was evaluated by the variation of energy in the pinhole. The phase-locking accuracy could be calculated by the root-mean-square (RMS) error of the energy in the pinhole [28]. The calculated phase residue error was , which could make the PIB decline from to .
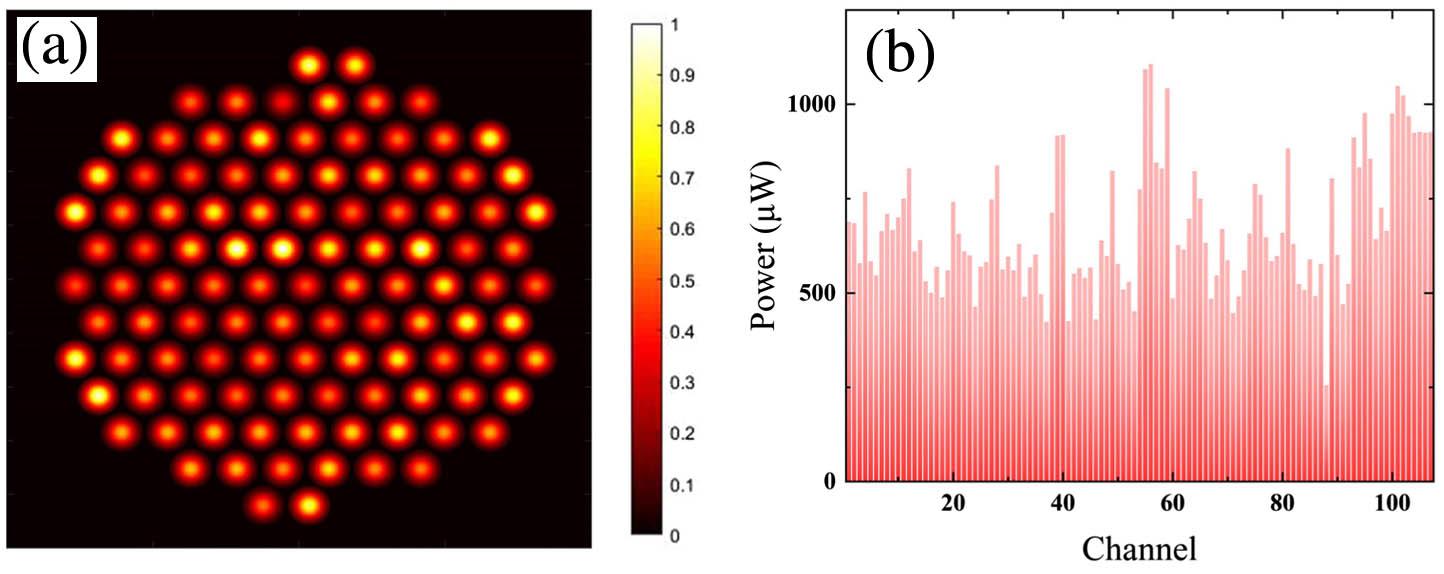
Finally, the power inconsistency was measured. There were some differences of power between channels due to the different insertion loss of phase modulators and the discrepancy of splitters. In a high-powered CBC system, the amplitude will change the varying time and further influence the energy distribution in the far-field [29]. The power of each channel was measured and drawn, as shown in Fig. 8. The PIB in the numerical simulation drops from to with power inconsistency.
In conclusion, three reasons for the descent of the PIB in our experiment were analyzed: dynamic tilt error, piston phase error, and power inconsistency. The comprehensive influence of those errors was numerically simulated. The results of the numerical simulation are shown in Fig. 9. Each pattern was averaged from 200 repeated numerical simulations. The idea pattern is shown in Fig. 9(a); the PIB was . Then the tilt error obeying distribution was appended to the simulation, and the PIB declined to . The far-field pattern with a tilt error is shown in Fig. 9(b). Next, the phase residue error of was added and the PIB descended further to . The pattern with the piston and the tilt error is shown in Fig. 9(c). When the normalized powers of each channel were added to the numerical simulation, the PIB continued to decline to . The pattern with tilt, phase, and power inconsistency is shown in Fig. 9(d). The experimental pattern is shown in Fig. 9(e). The rest of the differences are related to static tilt errors, polarization, divergence angle, spot size, statistical errors of the piston phase, dynamic tilt errors, and power inconsistency estimated above. The contributions counting for the PIB loss are listed in Table 1.

Fig. 9. (a) Ideal far-field pattern. (b) Far-field pattern with
Table 1. Contributions Counting for the PIB Loss
|
As for tilt error, which is the main cause of the PIB descent, an adaptive fiber-optics collimator (AFOC) or a fast piezo steering mirror (FPSM) can be utilized to correct tilt error [30,31]. However, the fill factor of the laser array will drop for the larger volume of the AFOC/FPSM and the complication of the collimator array will increase. As for piston phase error, the bandwidth of the SPGD algorithm drops as the number of lasers increases and is further reflected in a decrease of the PIB. The PIB goes down almost linearly with the increase of combined channels. As for power inconsistency, it could be solved by configuring a fiber amplifier in each channel.
New techniques such as artificial intelligence (AI) may also help to improve the bandwidth of phase control for array enlarging [32–34]. There are two approaches to utilize the AI technique in the CBC of the fiber laser array. One is using the overall AI technique, for example, using a high-speed camera or a PD to collect the pattern or cost function at the far-field, and reverse mapping the phase of each channel by a well-trained model. It is the prevailing method of an AI-assisted CBC system, and the convolutional neural networks (CNNs) of various structures have been employed such as the VGG-16 model [32] and the Inception-v3 model [34]. Another approach is treating the process of phase control as the training process of AI and using an optimal algorithm of AI for parameter updating. This is just the same as online learning in machine learning. Inspired by the training process of deep learning, optimal algorithms based on the gradient of AI may help to improve the bandwidth of the SPGD algorithm. In the training process of AI, there are many optimal algorithms for parameter updating such as stochastic gradient descent (SGD), momentum, adaptive gradient (AdaGrad), adaptive delta (AdaDelta), adaptive moment estimation (Adam), Nesterov accelerated gradient (NAG), and root mean square propagation (RMSProp) [35]. Those optimal algorithms are all first order optimization and need not calculate the second order derivative. The SPGD algorithm can be regarded as the parallelized SGD algorithm. Other optimal algorithms can also be parallelized as the SPGD algorithm is. The gradient can descend more quickly by other optimal algorithms. This work has already been done in some recent research [36]. It is predictable that other optimal algorithms using the AI technique may also be helpful to CBC.
4. CONCLUSIONS
In this work, the CBC of 107 beams has been demonstrated for the first time. The fringe contrast can reach and the phase residue error was . The influences of dynamic tilt errors, phase errors, and power inconsistency were calculated respectively and the correlation of tilt dithering in the -axis has been studied. Further work will involve improving the bandwidth of the phase-locking algorithm to increase the PIB, such as utilizing the AI technique and updating control circuits. For a tiled CBC of large array, the dynamic tilt error and the piston phase error must be controlled simultaneously to guarantee the combining result. Another combiner for a large laser array with the ability of auto adjusting the tilt of the fiber tip will also be involved in our future work.
5 Acknowledgment
Acknowledgment. We thank Jinhu Long, Wenchang Lai, Xu Yang, Jiazhong Yang, and Xiangrong Yu for providing help in system building.
Article Outline
Hongxiang Chang, Qi Chang, Jiachao Xi, Tianyue Hou, Rongtao Su, Pengfei Ma, Jian Wu, Can Li, Man Jiang, Yanxing Ma, Pu Zhou. First experimental demonstration of coherent beam combining of more than 100 beams[J]. Photonics Research, 2020, 8(12): 12001943.

