组织光声弹性成像  下载: 1521次特邀综述
Photoacoustic Elastography for Biological Tissue
1 上海理工大学医疗器械与食品学院生物医学光学与视光学研究所, 上海 200093
2 上海理工大学教育部光学仪器与系统工程研究中心上海市现代光学系统重点实验室, 上海 200093
图 & 表
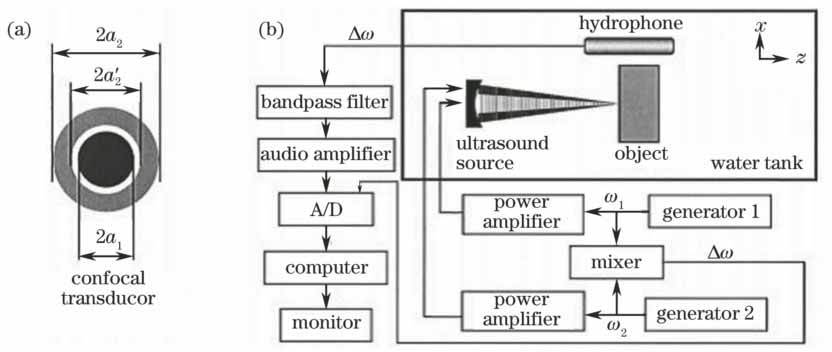
图 1. (a)共聚焦环形阵列换能器及(b)振动声成像系统结构图[7]
Fig. 1. Structural diagrams of (a) confocal annular array transducer and (b) vibro-acoustography system[7]
下载图片 查看原文
图 2. 基于光谱域OCT系统的共振式ARF-OCE系统结构图[10]
Fig. 2. Structural diagram of resonant ARF-OCE system based on spectral-domain OCT system[10]
下载图片 查看原文
图 3. 光声弹性成像系统装置图[11]
Fig. 3. Experimental setup of photoacoustic elastography system[11]
下载图片 查看原文
图 4. 三种样品的光声粘弹成像(肌肉、脂肪、肝组织)。(a)样品照片;(b)样品的光声粘弹成像[11]
Fig. 4. Photoacoustic viscoelasticity imagings of three samples (muscle, fat and liver). (a) Photograph of sample; (b) photoacoustic viscoelasticity imaging of sample[11]
下载图片 查看原文
图 5. 基于锁相测量的光声信号振幅和相位检测过程[18]
Fig. 5. Detection process of amplitude and phase of photoacoustic signal based on lock-in measurement[18]
下载图片 查看原文
图 6. 小鼠EMT6肿瘤的光学吸收成像及粘弹成像。(a)肿瘤部位光吸收成像;(b)肿瘤部位粘弹成像;(c)肿瘤照片;(d)与正常组织相比肿瘤区域的光声信号平均幅值和相位延迟;苏木素-伊红染色的(e)正常组织和(f)肿瘤组织[18]
Fig. 6. Optical absorption and viscoelasticity images of murine EMT6 tumor. (a) Optical absorption image of the tumor; (b) viscoelasticity image of the tumor; (c) photograph of the tumor; (d) averaged amplitude and phase delay of the photoacoustic signal from the marked tumor region compared to the normal tissue; (e) normal tissue and (f) tumor with hematoxylin-eosin stain[18]
下载图片 查看原文
图 7. QPAE系统原理图。(a)光声成像探头的侧视图和正视图;(b) QPAE系统装置[24]
Fig. 7. Schematic of QPAE system. (a) Lateral and front view of photoacoustic imaging probe; (b) QPAE system setup[24]
下载图片 查看原文
图 8. 人体二头肌在不同负荷下的在体QPAE。(a) 0 kg;(b) 2.5 kg;(c) 5.0 kg;(d) 7.5 kg;(e) 10.0 kg;(f)每层中平均的杨氏模量值随负荷的变化[24]
Fig. 8. QPAE images of the human musculus biceps in vivo at different loadings. (a) 0 kg; (b) 2.5 kg; (c) 5.0 kg; (d) 7.5 kg; (e) 10.0 kg; (f) averaged Young's modulus value in each layer as a function of load[24]
下载图片 查看原文
图 9. (a)在内部对样品进行360°扫描得到的纵向立体和平面展开的光声弹性成像图;(b)在z=0.8 mm处的光声弹性成像和相应的组织学照片以及该平面的相位分布[27]
Fig. 9. (a) Photoacoustic elastography images of vertical and en-face expansion scanned by 360° in the interior of the sample; (b) photoacoustic elastography image and the corresponding histology image and phase distribution at z=0.8 mm[27]
下载图片 查看原文
表 1各弹性成像的对比
Table1. Comparison of various elastography
| Characteristic | UE | OCE | Photoacousticelastography |
|---|
| Contrast | Bad | Excellent | Good | | Spatialresolution | Bad | Excellent | Good | | Maximumimaging depth | Excellent | Bad | Good |
|
查看原文
表 2两种组织的定量表征[20]
Table2. Quantitative characterization of two kinds of tissues[20]
| Parameter | Tissue 1 (benign) | Tissue 2 (malignant) |
|---|
| Tr | 5.6 μs | 3.5 μs | | Pn | 5 | 2 | | Pr | 6.2 | 30.7 |
|
查看原文
表 3各光声弹性成像方法的对比
Table3. Comparison of photoacoustic elastography methods
| Imaging contrast | Relation to photoacoustic signal | Imaging method |
|---|
| Phase delay time | Phase delay between photoacoustic signal and laser pulseas a function of viscosity-elasticity ratio | Viscoelasticity | | Relaxation time peaknumbers and peak ratio | Relaxation time, peak numbers and peak ratio of photoacousticsignal as a function of viscosity | Viscoelasticity | | Main frequency | Relation between photoacoustic signal and elastic modulus | Elastography | | Young's modulus | Local strain measurement gained from photoacoustic imaging'sdifferent displacements before and after compression | Elastography |
|
查看原文
王成, 董肖娜, 蔡干, 项华中, 郑刚, 张大伟. 组织光声弹性成像[J]. 中国激光, 2018, 45(3): 0307010. Wang Cheng, Dong Xiaona, Cai Gan, Xiang Huazhong, Zheng Gang, Zhang Dawei. Photoacoustic Elastography for Biological Tissue[J]. Chinese Journal of Lasers, 2018, 45(3): 0307010.


 PDF全文
PDF全文

