Spectrophotometer with enhanced sensitivity for uric acid detection  Download: 800次
1 Faculty of Electrical Engineering, Universiti Teknologi Malaysia, 81310 Johor Bahru, Johor, Malaysia
2 Faculty of Electrical and Electronic Engineering, Universiti Tun Hussein Onn Malaysia, 86400 Bt. Pahat, Johor, Malaysia
3 Industrial Biotechnology Research Centre, SIRIM Berhad, 40200 Shah Alam, Selangor, Malaysia
Figures & Tables
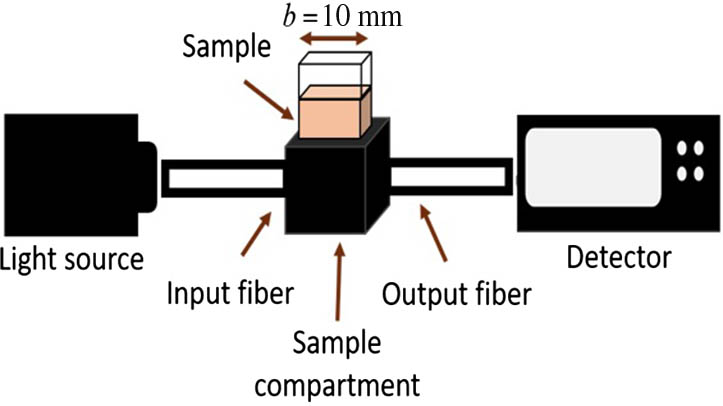
Fig. 1. Configuration of spectrophotometer.
下载图片 查看原文
Fig. 2. Samples with different uric acid concentrations (a) before and (b) after stirring.
下载图片 查看原文
Fig. 3. Light beam at 10 mm distance from the input fiber. (a) Halogen beam. (b) Gray-scale percentage for halogen light. (c) LED beam (460 nm wavelength). (d) Gray-scale percentage for LED light.
下载图片 查看原文
Fig. 4. Spectrometer output spectra. (a) Halogen. (b) LED (460 nm wavelength).
下载图片 查看原文
Fig. 5. Light absorbance with variations of uric acid concentration at wavelengths of 460, 525, and 630 nm. (a) Halogen. (b) LED.
下载图片 查看原文
Fig. 6. Human urine sample in cuvette after mixing with NaOH solution.
下载图片 查看原文
Fig. 7. Absorbance analysis on human urine sample at 460 nm wavelength.
下载图片 查看原文
Table1. Comparison of Light Characteristics Between Halogen and LED Light Sources at 460 nm Wavelength
| Parameter | Halogen | LED |
|---|
| (μW) | 15.4 | 1.7 | | () | 33.18 | 9.08 | | (nlm) | 7.3337 | 2.9582 | | (mlm/W) | 0.4762 | 1.7401 |
|
查看原文
Table2. Comparison of Spectrophotometer Performance
| Light Source | Wavelength (nm) | Sensitivity (dL/mg) | Accuracy (%) |
|---|
| Halogen | 460 | 0.0012 | 86.51 | | 525 | 0.0011 | 91.17 | | 630 | 0.0008 | 84.27 | | LED | 460 | 0.0046 | 96.62 | | 525 | 0.0031 | 77.57 | | 630 | 0.0045 | 79.43 |
|
查看原文
Nurfatihah Che Abd Rashid, Nor Hafizah Ngajikin, Asrul Izam Azmi, Rashidah Arsat, Suhaila Isaak, Noran Azizan Cholan, Nur Ellina Azmi. Spectrophotometer with enhanced sensitivity for uric acid detection[J]. Chinese Optics Letters, 2019, 17(8): 081701.


 PDF全文
PDF全文

