Chinese Optics Letters, 2016, 14 (7): 072701, Published Online: Aug. 3, 2018
Correction of the second-order degree of coherence measurement  Download: 884次
Figures & Tables
Fig. 1. Schemes to measure g ( 2 ) ( τ ) g ( 2 ) ( τ ) C ( τ ) g ( 2 ) ( τ ) = 1 C ( τ ) = e − a τ g ( 2 ) ( τ ) = 1 − e − b τ C ( τ ) = e − a τ − e − b τ
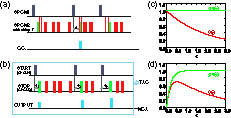
Fig. 2. Schematics of the experimental configuration with a home-built confocal microscope setup and HBT measurement. The diamond sample with a NV center on the piezo-stage (PZT) was excited by a continuous laser (λ = 532 nm N.A. = 0.9 g ( 2 ) ( τ )

Fig. 3. Results from the prototype measurement with tunable electronic delay (large red dots, obtained by averaging the results of several repeated measurements) and the TAC-MCA system (small black dots). (a) The inset shows the measurement results with τ < 1 μs τ n stop = 60 k / s

Fig. 4. Measurement results from the prototype measurement with tunable electronic delay (large dots) and TAC-MCA system (small dots) with different counting rates of the stop channel (n stop n stop = 10 , 20 , 30 , 40 , 50 , and 60 k / s

Fig. 5. (a) shows the fitting result of C ( τ ) n stop = 60 k / s a n stop n stop 4 .

Congcong Li, Xiangdong Chen, Shen Li, Fangwen Sun. Correction of the second-order degree of coherence measurement[J]. Chinese Optics Letters, 2016, 14(7): 072701.


 PDF全文
PDF全文

