Chinese Optics Letters, 2018, 16 (12): 121701, Published Online: Dec. 7, 2018  

Dual-modal photoacoustic/CT imaging system

Author Affiliations
Department of Biomedical Engineering, College of Engineering, Peking University, Beijing 100871, China
Abstract
Photoacoustic (PA) tomography (PAT) breaks the barrier for high-resolution optical imaging in a strong light-scattering medium, having a great potential for both clinical implementation and small animal studies. However, many organs and tissues lack enough PA contrast or even hinder the propagation of PA waves. Therefore, it is challenging to interpret pure PAT images, especially three-dimensional (3D) PA images for deep tissues, without enough structural information. To overcome this limitation, in this study, we integrated PAT with X-ray computed tomography (CT) in a standalone system. PAT provides optical contrast and CT gives anatomical information. We performed agar, tissue phantom, and animal studies, and the results demonstrated that PAT/CT imaging systems can provide accurate spatial registration of important complementary contrasts.

Small animals, especially mice and rats, are widely used in biomedical research. Various imaging techniques have been developed for small animal studies[1]. In comparison with conventional imaging techniques like magnetic resonance imaging (MRI), X-ray computed tomography (CT), positron emission tomography (PET), and single-photon emission computed tomography (SPECT), optical imaging has superior characteristics, including non-radioactivity, high sensitivity, and cost-effectiveness. Although tissues’ optical properties contain rich structural and functional information, the strong light scattering by tissues makes pure optical imaging methods always suffer low spatial resolution when imaging deep in live animals. Over the past decade, the emerging photoacoustic (PA) tomography (PAT) has become a very promising method for small animal imaging, including structural[26" target="_self" style="display: inline;">6], functional[79" target="_self" style="display: inline;">–9], and molecular imaging[1015" target="_self" style="display: inline;">15].

PAT is a hybrid imaging technique that combines optical absorption contrast and ultrasonic detection[1619" target="_self" style="display: inline;">19]. In PAT, short-pulsed light illuminates the tissue surface and endogenous or exogenous optical absorbers in the tissue absorb the diffused photons and become heated, then the subsequent thermoelastic expansion generates acoustic waves (PA signals). After receiving PA signals at multiple locations over the tissue surface, images of these underneath absorbers can be reconstructed. Since the soft tissue scatters ultrasound waves about two orders weaker than light, PAT can achieve high ultrasonic resolution based on optical absorption contrast. Although PAT has demonstrated its power in label-free deep tissue imaging for animal study, such as small-animal whole-body imaging[2024" target="_self" style="display: inline;">24], most of these results relied on high PA contrast from limited blood-rich tissues, such as the blood vessels, liver, or kidney. It is challenging to interpret pure PA 3D imaging of deep tissues accurately without other complementary information. Ultrasound is a commonly used method to integrate with PAT, but ultrasound also suffers from low tissue contrast. Inspired by the successful PET-CT, which integrates high-resolution anatomical information by CT and functional information by PET, in this study, we explored multimodal imaging that fused PAT with CT. Several previous works have been done on integrating PAT with X-ray imaging[25] or CT[2628" target="_self" style="display: inline;">–28]. However, in these previously reported works, PAT and X-ray imaging or CT were at different individual imaging facilities, i.e., the object (like a mouse) has to be relocated when performing different imaging, which may lead to the change of morphology.

In this study, we integrated PAT with an X-ray-based CT to develop a standalone system. Our results demonstrated that this dual-modality imaging system has the advantages of both PAT and CT. The dual-modal imaging system in this study contains a PAT and a micro-CT, as shown in Fig. 1. PAT and CT were nearly orthogonally aligned, and the imaging object locates in the center. Both PAT and CT were fixed on an optical table, and the imaging object was mounted on a rotational stage by a waterproof bearing and rotated during imaging.

Fig. 1. PAT-CT imaging system. (a) A schematic top view of the system describing the main components. (b) A photograph of the system. The phantom is positioned in the center.

下载图片 查看所有图片

The PAT system contains a 48-element customized US linear array (by TomoWave. Inc., Houston, Texas, USA) to detect the PA signal. Each element has a size of 1mm×1mm with a center frequency of 1 MHz. The element pitch is 1.35 mm. The water tank (made of a transparent acrylic material) has an inner diameter of 10 cm, and its side wall has an opening slit that allows the array to receive PA signals. The generated PA signal is amplified and acquired by a customized data acquisition (DAQ) system (by TomoWave. Inc., Houston, Texas, USA). More detail of the PAT probe and the DAQ was described in our previous work[29]. The illuminating source is a Q-switched Nd:YAG laser (LS-2137/2, LOTIS TII, Minsk, Belarus) that generates 1064 nm, 10 Hz laser pulses. A one-to-four optical fiber bundle guides the light to the imaging target. The four-branch fiber bundle terminals are rectangular shaped, and evenly aligned around the imaging target, as shown in Fig. 1.

The micro-CT system consists of an X-ray tube (XRS-125-2-P-CW, Source-ray. Inc., USA) and a planar detector (Dexela 1512 CMOS X-ray Detector, Dexela Ltd., UK). The electrical voltage and the current of the tube were set to 80 kV and 0.5 mA, respectively. The anode is tungsten with a focal spot of 0.5 mm. To alleviate the beam-hardening artifact, a 4.5 mm thick aluminum sheet was placed in front of the X-ray tube. The X-ray detector has 1944pixel×1536pixel with a pixel size of 74.8 μm by 74.8 μm, forming a 114.4mm×145mm physical detection area.

We performed the imaging sequentially in two steps (the reason for this procedure will be explained later): CT imaging followed by a PAT. During the CT imaging, no water was filled in the water tank, and CT recordings were evenly acquired along 360 deg. Then we filled the water tank with deionized (DI) water and started the PAT imaging. The rotational stage moved continuously at a speed of 1.2 deg/s. The data acquisition was triggered by the laser at a repetition rate of 10 Hz. A total of 3000 PA data sets (each set stored 48×1536 data) were recorded at the sampling frequency of 25 MHz for a full 360 deg scanning.

For PAT reconstruction, we used the image reconstruction algorithm described in Ref. [30] for a 2D cylindrical detection configuration. The CT image reconstruction was based on the Feldkamp, Davis, and Kress reconstruction method[31]. The images were reconstructed to a 512×512×512 size with geometry calibration. The resolutions of PAT are 1.35 mm, 0.4 mm, and 0.75 mm for axial, radial, and tangential directions, respectively. The spatial resolution of micro-CT is about 100 μm.

Spatial calibration must be done to co-register PAT and CT images. In this study, we used a painted thin metal wire as the dual-modal contrast. After image reconstruction for both modalities, we loaded these two images into a 3D Slicer (version 4.6, slicer.org) and set the CT image of the wire in the center. Then we manually rotated and translated the corresponding PAT image to fuse them, finding the calibration parameters. Therefore, we can get the spatial rotational and translational parameters to be used for later image fusing.

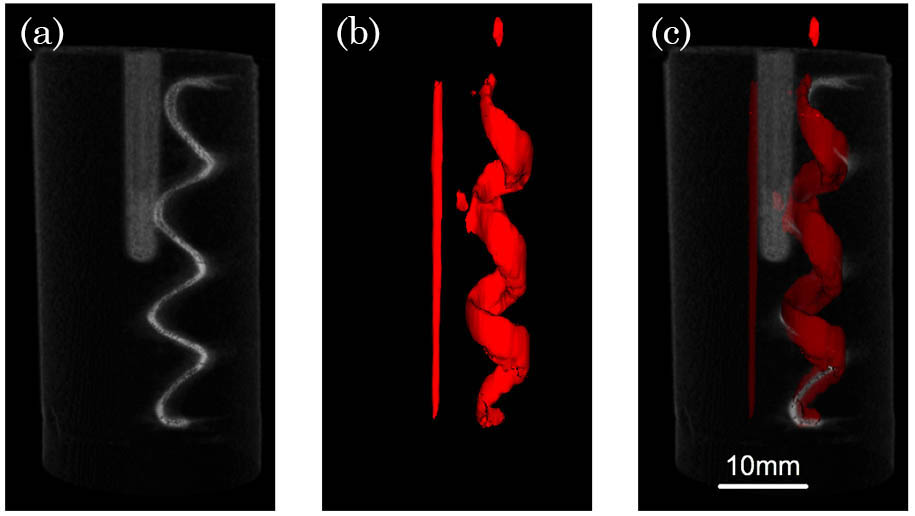
The agar phantom was a cylinder made of 1% intralipid and 3% agar, and it had a diameter of 27 mm. There were three objects buried in the agar: one black carbon rod with a diameter of 0.5 mm, one helix, and one transparent glass tube, as shown in Fig. 2(a). The helix consisted of black plastic wrapping and a thin metal wire. The carbon rod and the black wrapping of the helix are good imaging targets for PAT, and the metal wire and glass tube, which have densities much larger than water, are targets for CT. Figure 3 presented the dual-modal imaging result. The excitation laser shining on the phantom was 185 mJ/pulse. Due to the much higher mass density, both the metal wire and glass tube were prominently visualized in the CT result, as shown in Fig. 3(a). However, because the low-density objects (carbon rod and plastic wrapping) have a similar density to the surrounding medium, they become too faint to be well distinguished in the reconstructed CT result. However, they can be effectively imaged by PAT, as in Fig. 3(b). Then, CT and PAT results were co-registered with high spatial accuracy, as shown in Fig. 3(c). 3D visualization was given in an animation file online (Video 1) by 3D Slicer (version 4.6, slicer.org).

Fig. 2. Photographs of the two phantoms. (a) The agar phantom with the carbon rod, helix, and glass tube. The photo was taken after the experiment. (b) The chicken breast tissue phantom.
下载图片 查看所有图片

Fig. 3. Agar phantom imaging results. (a) The 3D rendering result for the CT reconstruction. (b) The 3D rendering result for the photoacoustic imaging. (c) The co-registered rendering of the PAT and CT images (Video 1).

下载图片 查看所有图片

To demonstrate the potential of the system for tissue study, chicken breast tissue was also used in the study. One carbon rod with a diameter of 0.5 mm, one metal wire with a diameter of 0.4 mm, and one thin glass tube were imbedded in chicken breast tissue. Part of the metal wire was painted black. We inserted the chicken tissue into a plastic bottle made of low-density polyethylene (LDPE), which has a near-acoustic impedance with water.

In order to remove air bubbles, the bottle was also filled with water, as shown in Fig. 2(b). Similar to the agar phantom study, the CT reconstructed both the glass tube and metal [see Fig. 4(a)]. PAT visualized the carbon fiber and part of the painted wire, and the blood in the chicken was clearly seen [see Fig. 4(b)]. Since the PA signals generated by the nonpainted wire were several-fold weaker than the painted part, they are not displayed in Fig. 4(b) due to threshold. The co-registered image was presented in Fig. 4(c). Another 3D visualization was also given in an animation file online (Video 2) by 3D Slicer (version 4.6, slicer.org).
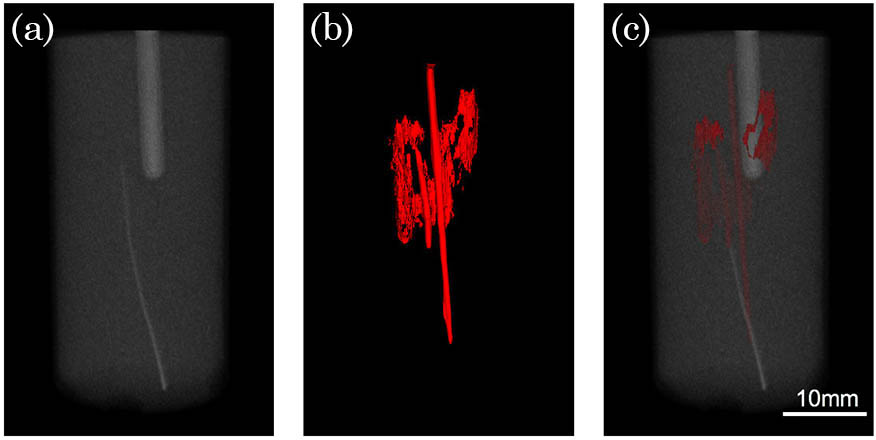
Fig. 4. Tissue phantom imaging results. (a) The 3D rendering result for the CT reconstruction. (b) The 3D rendering result for the photoacoustic reconstruction. (c) The co-registered image of the PAT and CT imaging (Video 2).

下载图片 查看所有图片

Then we carried out the animal experiment on a 20 g BALB/c female nude mouse. The mouse was euthanatized by CO2 and then fixed onto a custom-made mouse holder made of acrylic. The mouse’s arms were attached to the top part of the mouse holder and the legs of the mouse were attached to the bottom part of the holder, as shown in Fig. 5(a). All procedures of the mouse study were in compliance with the Institutional Animal Use and Care Committee (IACUC) protocol of Peking University. The CT image presented the skeleton of the mouse, including sternum, spine, tailbone, and so on [see Fig. 5(b)]. Figure 5(c) shows the photoacoustic volume of a nude mouse. The excitation laser shining on the animal was 270 mJ/pulse. Then the co-registered image was presented in Fig. 5(d); we found that, with the help of CT results as reference, the imaged PA results are highly suspected to be kidneys as well as the spleen and a partial lobe of the liver. Another 3D visualization was also given in an animation file online (Video 3) by 3D Slicer (version 4.6, slicer.org).
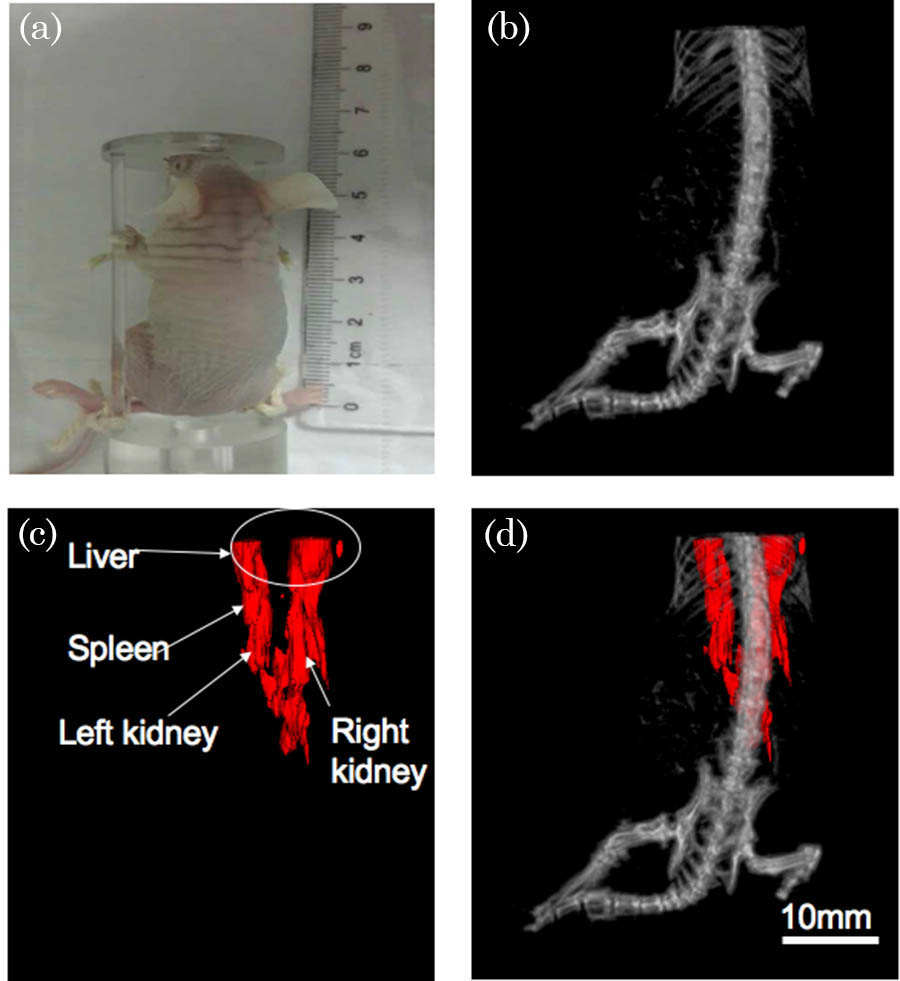
Fig. 5. Mouse imaging results. (a) The nude mouse picture that was taken before the experiment. (b) The 3D rendering result for the CT reconstruction. (c) The 3D rendering result for the photoacoustic reconstruction. (d) The co-registered image of the PAT and CT imaging (Video 3).

下载图片 查看所有图片

In this study, we presented a standalone dual-modal PAT-CT imaging system. PAT provides the optical absorption contrast, and CT gives the mass density distribution. The system obtains these two important complementary pieces of information with a highly accurate spatial registration. The imaging depth was demonstrated to be more than 2 cm in scattering biological tissues. The performance of this system has been demonstrated by two types of phantom studies and mouse experiments.

Because the X-ray source used in this study has a relative low power, the attenuated X-ray, after passing through the water in the tank, is too weak to be detected. Therefore, we first imaged the target by CT without filling water in the tank. A more powerful X-ray source would enable two modalities to image simultaneously in future. In addition, because it is limited by the element’s size, the geometry of the linear probe, and the bandwidth, our current PAT system has an imaging resolution of 1mm, which is not suitable for small animal imaging (a mouse body has a diameter of about 15 mm). A higher center-frequency ultrasonic array with an arc shape, as in Ref. [20], would improve the resolution.

References

[1] 1LewisJ. S.AchilefuS.GarbowJ. R.LaforestR.WelchM. J., Eur. J. Cancer38, 2173 (2002).EJCAEL0959-804910.1016/S0959-8049(02)00394-5

[2] 2SongK. H.WangL. V., Med. Phys.35, 4524 (2008).MPHYA60094-240510.1118/1.2977534

[3] 3BuehlerA.RazanskyD.HerzogE.NtziachristosV., Opt. Lett.35, 2475 (2010).OPLEDP0146-959210.1364/OL.35.002475

[4] 4WangX. D.KuG.WegielM. A.BornhopD. J.StoicaG.WangL. H. V., Opt. Lett.29, 730 (2004).OPLEDP0146-959210.1364/OL.29.000730

[5] 5GateauJ.CaballeroM. A. A.DimaA.NtziachristosV., Med. Phys.40, 013302 (2013).MPHYA60094-240510.1118/1.4770292

[6] 6LiL.LiQ.DaiC.ZhaoQ.YuT.ChaiX.ZhouC., Chin. Opt. Lett.15, 051101 (2017).CJOEE31671-769410.3788/COL

[7] 7WangX. D.XieX. Y.KuG. N.WangL. H. V., J. Biomed. Opt.11, 024015 (2006).JBOPFO1083-366810.1117/1.2192804

[8] 8TaruttisA.MorscherS.BurtonN. C.RazanskyD.NtziachristosV., PLOS ONE7, e30491 (2012).POLNCL1932-620310.1371/journal.pone.0030491

[9] 9XuM.LeiP.FengJ.LiuF.YangS.ZhangP., Chin. Opt. Lett.16, 031702 (2018).CJOEE31671-769410.3788/COL

[10] 10MallidiS.LarsonT.TamJ.JoshiP. P.KarpioukA.SokolovK.EmelianovS., Nano Lett.9, 2825 (2009).NALEFD1530-698410.1021/nl802929u

[11] 11JathoulA. P.LauferJ.OgunladeO.TreebyB.CoxB.ZhangE.JohnsonP.PizzeyA. R.PhilipB.MarafiotiT., Nat. Photonics9, 239 (2015).NPAHBY1749-488510.1038/nphoton.2015.22

[12] 12WeberJ.BeardP. C.BohndiekS. E., Nat. Meth.13, 639 (2016).1548-709110.1038/nmeth.3929

[13] 13KircherM. F.de la ZerdaA.JokerstJ. V.ZavaletaC. L.KempenP. J.MittraE.PitterK.HuangR.CamposC.HabteF.SinclairR.BrennanC. W.MellinghoffI. K.HollandE. C.GambhirS. S., Nat. Med.18, 829 (2012).1078-895610.1038/nm.2721

[14] 14JiangY.UpputuriP. K.XieC.LyuY.ZhangL.XiongQ.PramanikM.PuK., Nano. Lett.17, 4964 (2017).10.1021/acs.nanolett.7b02106

[15] 15ChenH.ChenZ.XuJ.HuJ., Chin. Opt. Lett.13, 111701 (2015).CJOEE31671-769410.3788/COL

[16] 16WangL. V., Nat. Photonics3, 503 (2009).NPAHBY1749-488510.1038/nphoton.2009.157

[17] 17LiC. H.WangL. V., Phys. Med. Biol.54, R59 (2009).PHMBA70031-915510.1088/0031-9155/54/19/R01

[18] 18WangL. V.HuS., Science335, 1458 (2012).SCIEAS0036-807510.1126/science.1216210

[19] 19BeardP., Interface Focus1, 602 (2011).10.1098/rsfs.2011.0028

[20] 20BrechtH. P., J. Biomed. Opt.14, 064007 (2009).JBOPFO1083-366810.1117/1.3259361

[21] 21LauferJ.NorrisF.ClearyJ.ZhangE.TreebyB.CoxB.JohnsonP.ScamblerP.LythgoeM.BeardP., J. Biomed. Opt.17, 061220 (2012).JBOPFO1083-366810.1117/1.JBO.17.6.061220

[22] 22SuR.ErmilovS. A.LiopoA. V.OraevskyA. A., J. Biomed. Opt.17, 101506 (2012).JBOPFO1083-366810.1117/1.JBO.17.10.101506

[23] 23DengZ.WangZ.YangX.LuoQ.GongH., J. Biomed. Opt.17, 081415 (2012).JBOPFO1083-366810.1117/1.JBO.17.8.081415

[24] 24LiL.ZhuL.MaC.LinL.YaoJ.WangL.MaslovK.ZhangR.ChenW.ShiJ., Nat. Biomed. Eng.1, 0071 (2017).

[25] 25HuangG.YangS.YuanY.XingD., Appl. Phys. Lett.99, 125 (2011).APPLAB0003-6951

[26] 26ChengL.LiuJ.GuX.GongH.ShiX.LiuT.WangC.WangX.LiuG.XingH., Adv. Mater.26, 1886 (2014).ADVMEW0935-964810.1002/adma.v26.12

[27] 27JingL.LiangX.DengZ.FengS.LiX.HuangM.LiC.DaiZ., Biomater.35, 5814 (2014).10.1016/j.biomaterials.2014.04.005

[28] 28TianG.ZhangX.ZhengX.YinW.RuanL.LiuX.ZhouL.YanL.LiS.GuZ., Small10, 4160 (2015).SMALBC1613-6810

[29] 29TanY.XiaK.RenQ.LiC., Opt. Express25, 8022 (2017).OPEXFF1094-408710.1364/OE.25.008022

[30] 30XuM.WangL. V., Phys. Rev. E71, 016706 (2005).10.1103/PhysRevE.71.016706

[31] 31FeldkampL. A.DavisL. C.KressJ. W., J. Opt. Soc. Am. A1, 612 (1984).JOAOD60740-323210.1364/JOSAA.1.000612

Kaiye Xia, Xiaohui Zhai, Zhaoheng Xie, Kun Zhou, Yutao Feng, Guangjie Zhang, Changhui Li. Dual-modal photoacoustic/CT imaging system[J]. Chinese Optics Letters, 2018, 16(12): 121701.

引用该论文: TXT   |   EndNote

相关论文

加载中...

关于本站 Cookie 的使用提示

中国光学期刊网使用基于 cookie 的技术来更好地为您提供各项服务,点击此处了解我们的隐私策略。 如您需继续使用本网站,请您授权我们使用本地 cookie 来保存部分信息。
全站搜索
您最值得信赖的光电行业旗舰网络服务平台!