基于谐波分析算法的干旱区绿洲土壤光谱特性研究  下载: 984次
Spectral Characteristics of Oasis Soil in Arid Area Based on Harmonic Analysis Algorithm
1 新疆大学资源与环境科学学院, 新疆 乌鲁木齐 830046
2 新疆大学绿洲生态教育部重点实验室, 新疆 乌鲁木齐 830046
3 新疆大学智慧城市与环境建模自治区普通高校重点实验室, 新疆 乌鲁木齐 830046
图 & 表
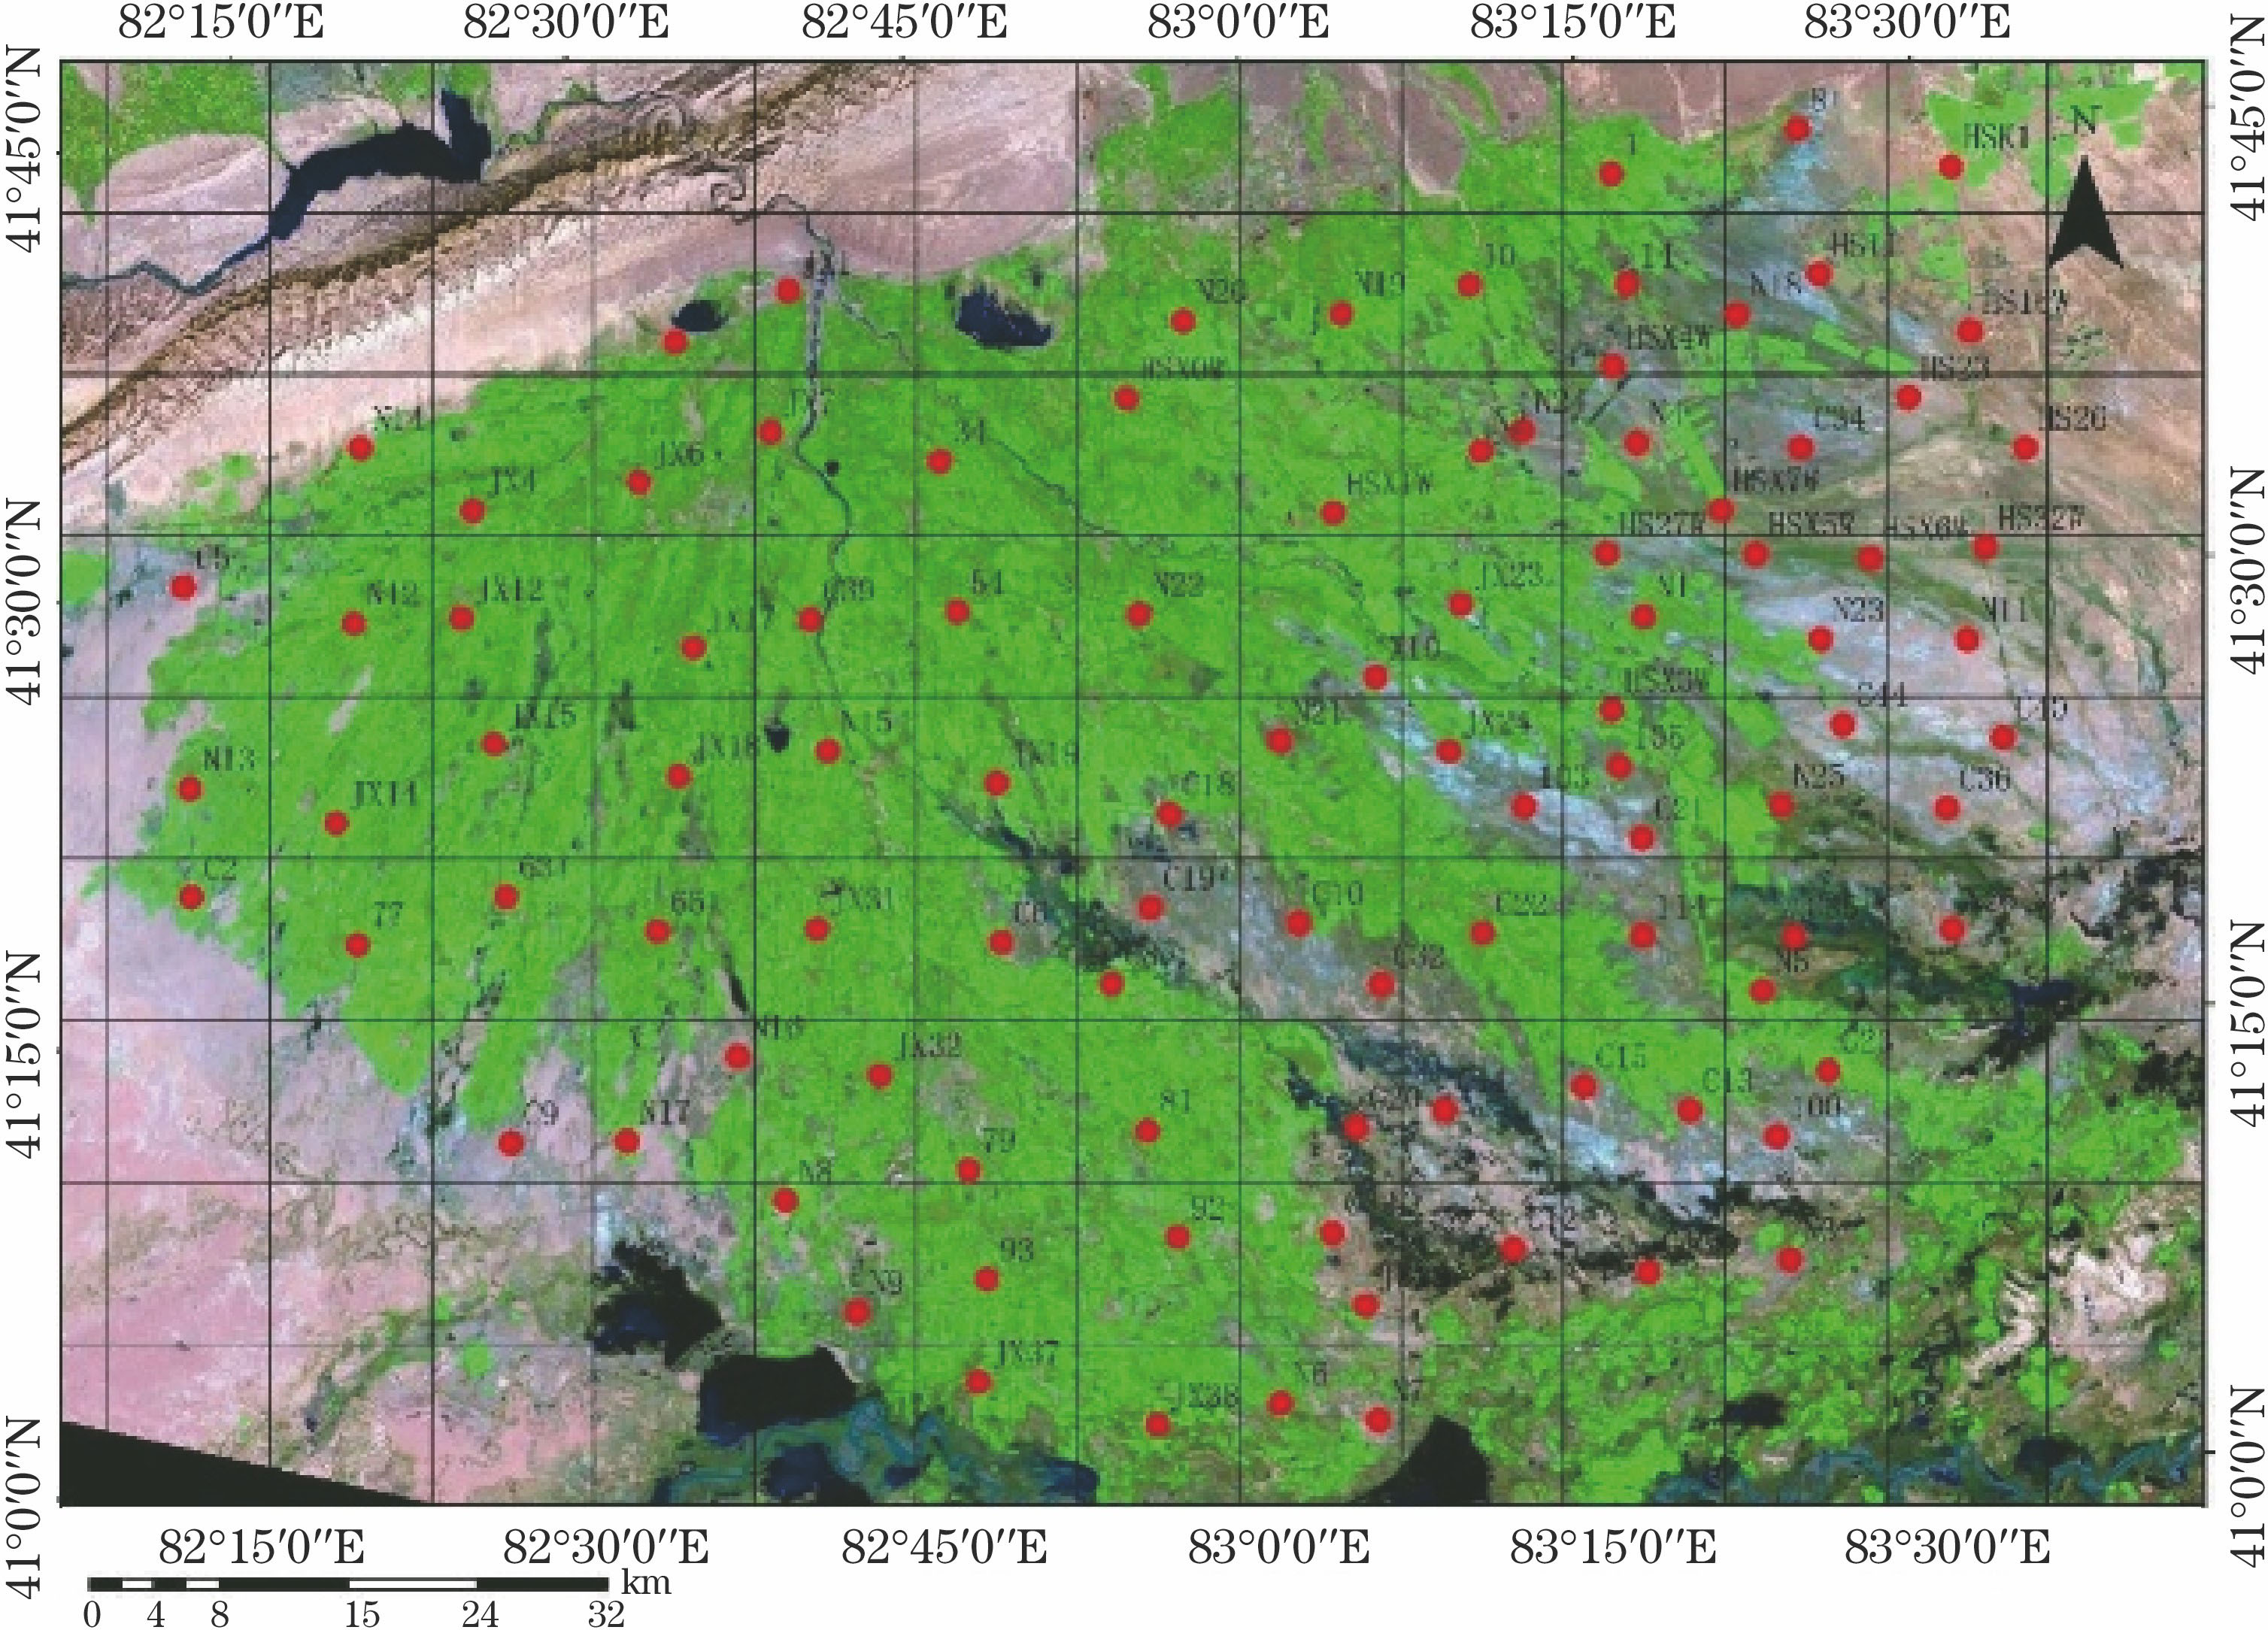
图 1. 研究区采样图
Fig. 1. Research area sampling chart
下载图片 查看原文
图 2. SOM含量估算的流程图
Fig. 2. Flow chart of SOM content estimation
下载图片 查看原文
图 3. 原始光谱、FD光谱与SOM含量的相关性曲线
Fig. 3. Correlation curves of original spectrum, FD spectrum and SOM content
下载图片 查看原文
图 4. 不同HA次数下谐波分量与SOM含量的相关系数图。(a)(e)(i)(m) At与SOM的相关系数;(b)(f)(j)(n) Bt与SOM的相关系数;(c)(g)(k)(o) Ct与SOM的相关系数;(d)(h)(l)(p) φt与SOM的相关系数
Fig. 4. Correlation coefficient diagrams of harmonic component and SOM content at different HA times. (a)(e)(i)(m) Correlation coefficient of At and SOM content; (b)(f)(j)(n) correlation coefficient of Bt and SOM content; (c)(g)(k)(o) correlation coefficient of Ct and SOM content; (d)(h)(l)(p) correlation coefficient of φt and SOM content
下载图片 查看原文
图 5. GA-BP神经网络的技术路线
Fig. 5. Technology roadmap of GA-BP neural network
下载图片 查看原文
图 6. 最优个体的适应度变化曲线
Fig. 6. Changing curve of optimal individual fitness
下载图片 查看原文
图 7. 不同模型SOM含量的实测值与估算值。(a) MLR模型; (b) BP模型; (c) GA-BP模型
Fig. 7. Measured and estimated SOM content for different models. (a) MLR model; (b) BP model; (c) GA-BP model
下载图片 查看原文
表 1SOM含量的统计特征
Table1. Statistical characteristics of SOM content
| Type of samples | Number of sample | SOM content (mass fraction) /10-3 | Standard deviation /10-3 | Coefficient of variation /% |
|---|
| Minimum | Maximum | Mean |
|---|
| Whole set | 101 | 2.32 | 18.06 | 10.94 | 3.45 | 31.51 | | Calibration set | 71 | 3.68 | 18.06 | 10.91 | 3.45 | 31.61 | | Validation set | 30 | 2.32 | 16.45 | 11.04 | 3.51 | 31.79 |
|
查看原文
表 2不同HA次数下At与SOM含量的相关系数统计特征
Table2. Statistical characteristics of correlation coefficients between At and SOM content at different HA times
| Harmonic decomposition times | Maximum positive correlation coefficient | Harmonic characteristic component | Maximum negative correlation coefficient | Harmonic characteristic component |
|---|
| 500 | 0.57 | 7 | -0.54 | 1 | | 1000 | 0.57 | 7 | -0.54 | 1 | | 1500 | 0.57 | 7 | -0.54 | 1 | | 2000 | 0.57 | 7,1993 | -0.54 | 1,1999 | | 2500 | 0.57 | 7,1993,2007 | -0.54 | 1,1999,2001 | | 3000 | 0.57 | 7,1993,2007 | -0.54 | 1,1999,2001 | | 3500 | 0.57 | 7,1993,2007 | -0.54 | 1,1999,2001 | | 4000 | 0.57 | 7,1993,2007,3993 | -0.54 | 1,1999,2001,3999 |
|
查看原文
表 3不同HA次数下Bt与SOM含量的相关系数统计特征
Table3. Statistical characteristics of correlation coefficient between Bt and SOM content at different HA times
| Harmonic decomposition times | Maximum positive correlation coefficient | Harmonic characteristic component | Maximum negative correlation coefficient | Harmonic characteristic component |
|---|
| 500 | 0.54 | 21 | -0.51 | 4 | | 1000 | 0.54 | 21 | -0.51 | 4 | | 1500 | 0.54 | 21 | -0.51 | 4 | | 2000 | 0.54 | 21 | -0.51 | 1979 | | 2500 | 0.54 | 21,2021 | -0.51 | 1979 | | 3000 | 0.54 | 21,2021 | -0.51 | 1979 | | 3500 | 0.54 | 21,2021 | -0.51 | 1979 | | 4000 | 0.54 | 21,2021 | -0.51 | 1979,3979 |
|
查看原文
表 4不同HA次数下Ct与SOM含量的相关系数统计特征
Table4. Statistical characteristics of correlation coefficient between Ct and SOM content at different HA times
| Harmonic decomposition times | Maximum positive correlation coefficient | Harmonic characteristic component | Maximum negative correlation coefficient | Harmonic characteristic component |
|---|
| 500 | 0.47 | 1 | -0.56 | 6 | | 1000 | 0.47 | 1 | -0.56 | 6 | | 1500 | 0.47 | 1 | -0.56 | 6 | | 2000 | 0.47 | 1,1999 | -0.56 | 6,1994 | | 2500 | 0.47 | 1,1999,2001 | -0.56 | 6,1994,2006 | | 3000 | 0.47 | 1,1999,2001 | -0.56 | 6,1994,2006 | | 3500 | 0.47 | 1,1999,2001 | -0.56 | 6,1994,2006 | | 4000 | 0.47 | 1,1999,2001,3999 | -0.56 | 6,1994,2006,3994 |
|
查看原文
表 5不同HA次数下φt与SOM含量的相关系数统计特征
Table5. Statistical characteristics of correlation coefficient between φt and SOM content at different HA times
| Harmonic decomposition times | Maximum positive correlation coefficient | Harmonic characteristic component | Maximum negative correlation coefficient | Harmonic characteristic component |
|---|
| 500 | 0.30 | 68 | -0.30 | 20 | | 1000 | 0.30 | 68 | -0.32 | 532 | | 1500 | 0.30 | 68 | -0.32 | 532 | | 2000 | 0.32 | 1468 | -0.32 | 532 | | 2500 | 0.32 | 1468 | -0.32 | 532 | | 3000 | 0.32 | 1468 | -0.32 | 532,2532 | | 3500 | 0.32 | 1468,3468 | -0.32 | 532,2532 | | 4000 | 0.32 | 1468,3468 | -0.32 | 532,2532 |
|
查看原文
表 6PCA特征值和方差贡献率
Table6. Characteristic value of PCA and variance contribution rate
| Principle component | Characteristic value | Variance contribution /% | Accumulative contribution /% |
|---|
| PCA1 | 16.33 | 77.80 | 77.80 | | PCA2 | 1.45 | 6.91 | 84.71 | | PCA3 | 1.09 | 5.19 | 89.90 | | PCA4 | 0.91 | 4.34 | 94.24 | | PCA5 | 0.52 | 2.58 | 96.82 | | PCA6 | 0.26 | 1.43 | 98.25 | | PCA7 | 0.16 | 0.88 | 99.13 | | … | … | … | … | | PCA21 | -3.13×10⁻¹⁶ | -1.49×10⁻¹⁵ | 100 |
|
查看原文
表 7不同估算模型的精度统计结果
Table7. Accuracy statistical results of different estimate models
| Validation model | R2 | RMSEP /10-3 | RPD |
|---|
| MLR | 0.77 | 4.76 | 1.59 | | BP | 0.87 | 4.07 | 1.85 | | GA-BP | 0.92 | 3.92 | 1.93 |
|
查看原文
张子鹏, 丁建丽, 王敬哲. 基于谐波分析算法的干旱区绿洲土壤光谱特性研究[J]. 光学学报, 2019, 39(2): 0228003. Zipeng Zhang, Jianli Ding, Jingzhe Wang. Spectral Characteristics of Oasis Soil in Arid Area Based on Harmonic Analysis Algorithm[J]. Acta Optica Sinica, 2019, 39(2): 0228003.


 PDF全文
PDF全文

