Design and experimental demonstration of a high conversion efficiency OPCPA pre-amplifier for petawatt laser facility  Download: 623次
1 National Laboratory on High Power Laser and Physics
,
Shanghai Institute of Optics and Fine Mechanics
,
Chinese Academy of Sciences
,
Shanghai 201800
,
China
2 University of Chinese Academy of Sciences
,
Beijing 100049
,
China
Figures & Tables
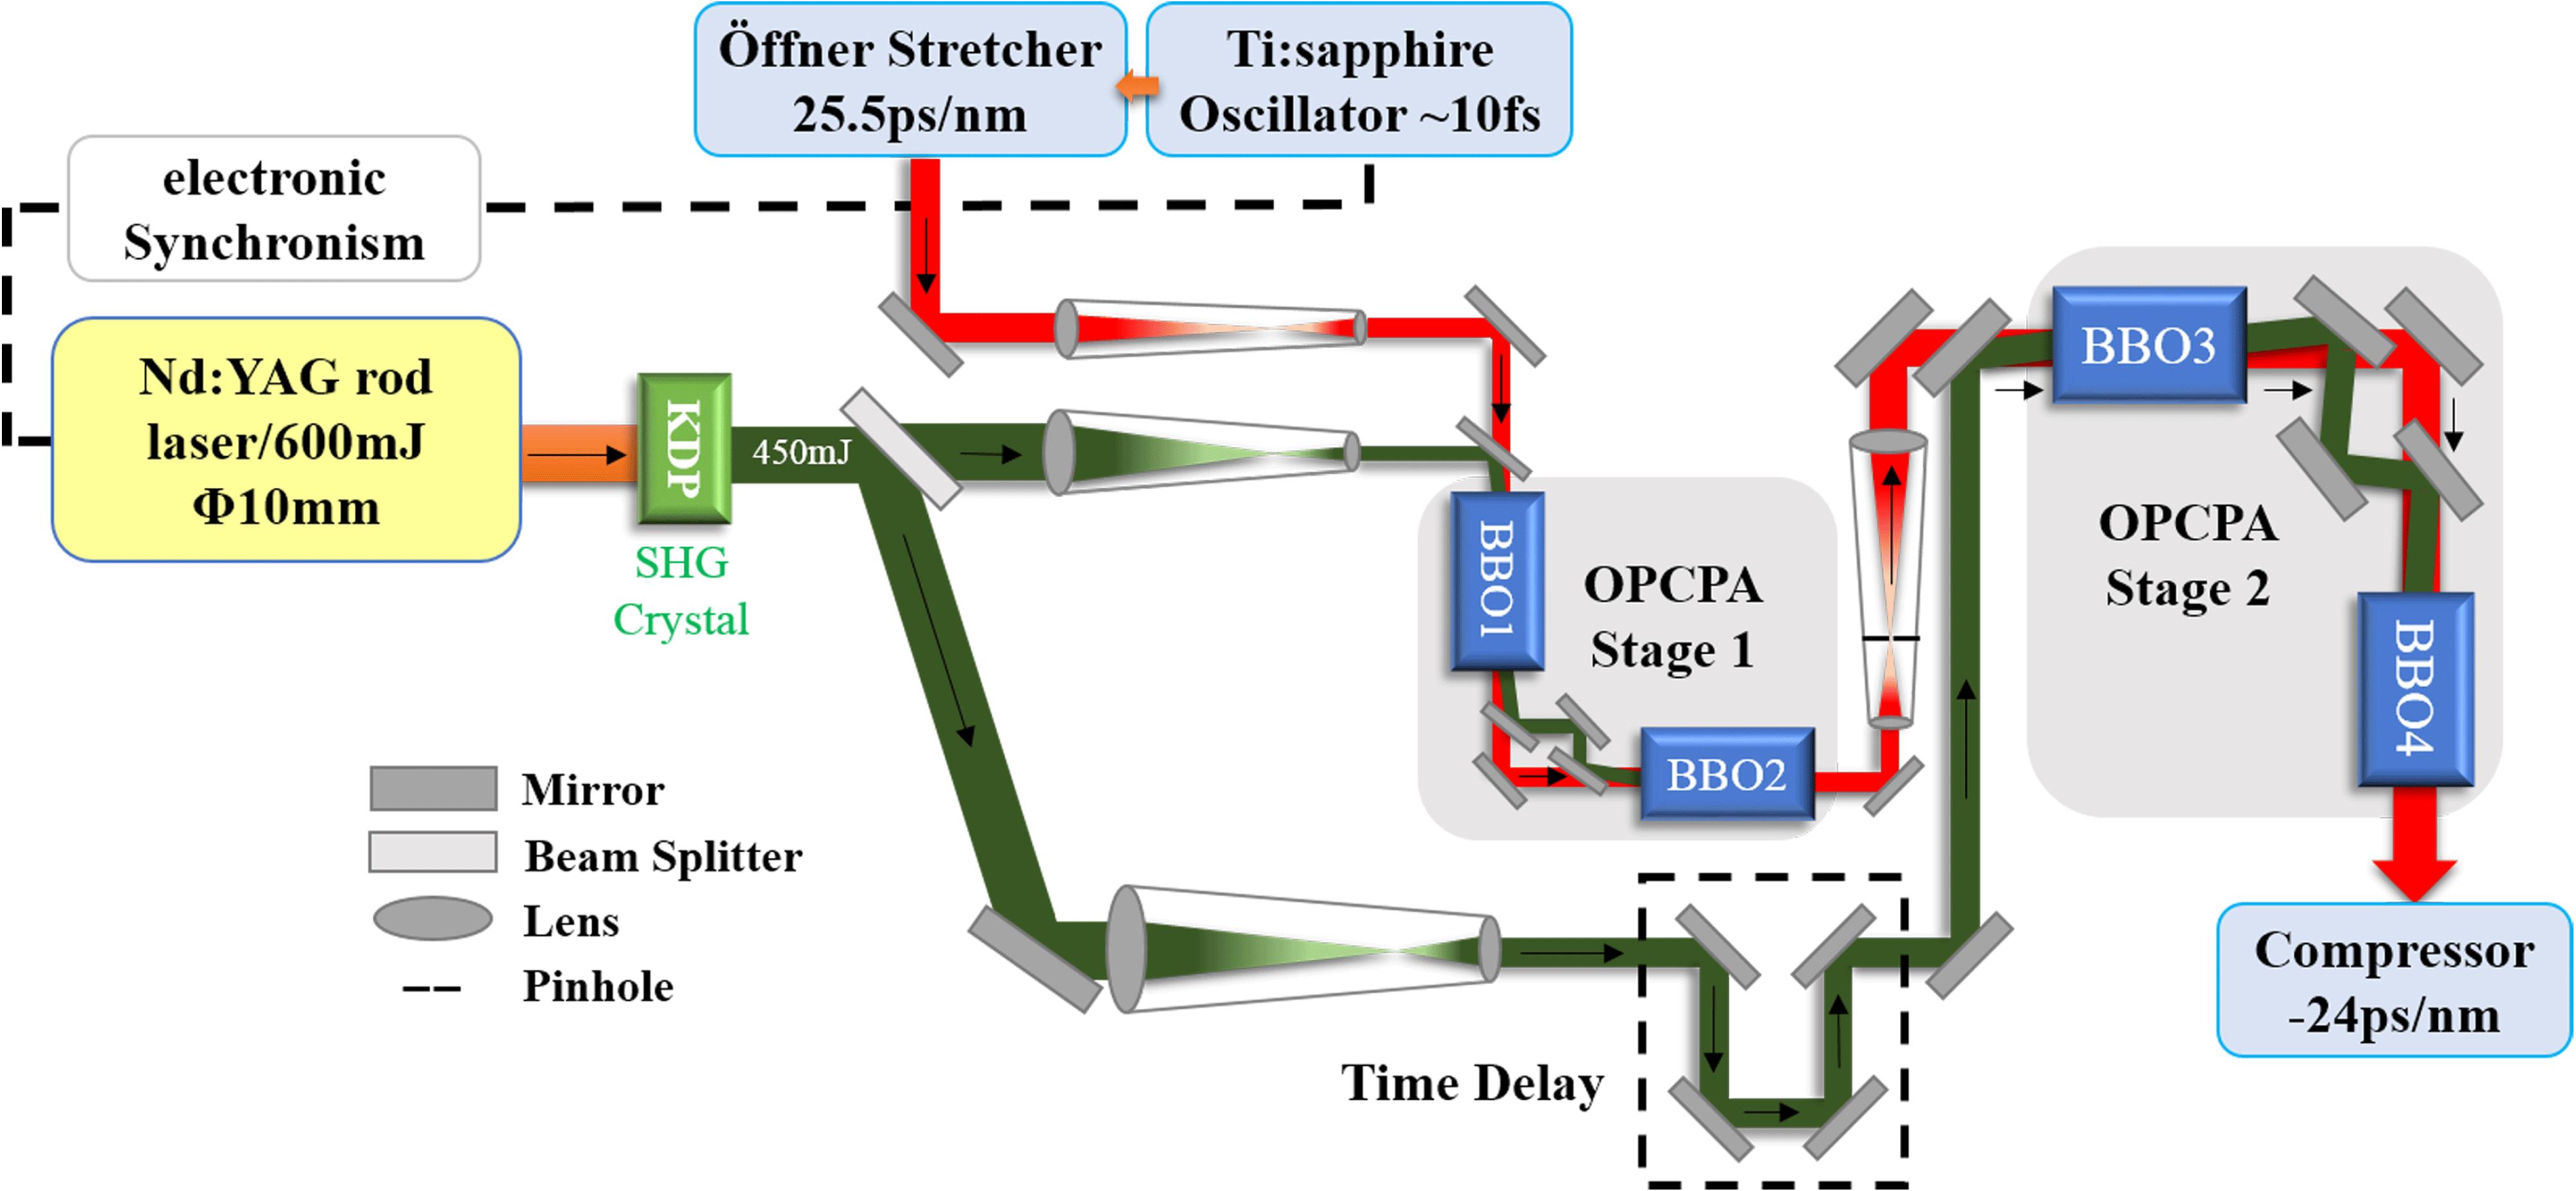
Fig. 1. OPCPA pre-amplifier schematic and laser path diagram.
下载图片 查看原文
Fig. 2. Two BBO crystals OPCPA in ‘L’ type configuration.
下载图片 查看原文
Fig. 3. (a) Small signal gain bandwidth and (b) small signal gain versus various pump intensities. Different colors stand for different crystal lengths.
下载图片 查看原文
Fig. 4. Signal gain of OPCPA stage 1. Different colors stand for different crystal length combinations.
下载图片 查看原文
Fig. 5. OPCPA stage 1 output signal beam shape from: (a) one 46 mm long crystal; (b) two crystals in ‘L’ type configuration with
 length.
下载图片 查看原文
Fig. 6. (a) Conversion efficiency and (b) EBP of two BBO crystal combination in ‘L’ type configuration at OPCPA stage 2.
下载图片 查看原文
Fig. 7. OPA evolutionary process of signal at 808 nm and 765 nm wavelengths in stage 2. Crystals length combination in (a) and (b) is
 , while in (c) and (d) is
 . Red line represents signal, green line represents pump and blue line represents idler.
下载图片 查看原文
Fig. 8. Signal output energy versus length of two BBO crystals. The first crystal length is 15 mm. The pump energy variation is
 to the initial 450 mJ. A and B correspond to BBO4 crystal lengths of 11 mm and 7.5 mm.
下载图片 查看原文
Fig. 9. Signal output beam shape of OPCPA stage 2 for different lengths of BBO4 crystal. (a): 11 mm; (b) 7.5 mm; (c) 9 mm.
下载图片 查看原文
Fig. 10. Measured experimental output signal spectrum from different OPCPA stages. (a) Spectra from signal seed (cyan line) and BBO2 (green line); (b) spectra from BBO3 (blue line) and BBO4 (red line).
下载图片 查看原文
Fig. 11. Measurement of the output energy over 5 min.
下载图片 查看原文
Fig. 12. CCD measured output signal near-field at 161 mJ.
下载图片 查看原文
Fig. 13. Measured compressed pulse duration by an autocorrelator.
下载图片 查看原文
Table1. Simulation output parameters of OPCPA stage 1.
| Energy | Gain | Spectrum FWHM | Pulse duration |
|---|
| 5 mJ |  | 64 nm | 1.6 ns |
|
查看原文
Table2. Simulation output parameters of OPCPA stage 2.
| Energy | Conversion efficiency | Spectrum FWHM | Pulse duration |
|---|
| 185 mJ | 50% | 80 nm | 2 ns |
|
查看原文
Table3. Experimental output parameters.
| Energy | Gain | Conv. eff. | Spectrum FWHM | Duration |
|---|
| Stage 1 | 3 mJ |  |  | 60 nm | 1.5 ns | | Stage 2 | 160 mJ | 53 | 43% | 80 nm | 2 ns |
|
查看原文
Xiao Liang, Xinglong Xie, Jun Kang, Qingwei Yang, Hui Wei, Meizhi Sun, Jianqiang Zhu. Design and experimental demonstration of a high conversion efficiency OPCPA pre-amplifier for petawatt laser facility[J]. High Power Laser Science and Engineering, 2018, 6(4): 04000e58.


 PDF全文
PDF全文

