Chinese Optics Letters, 2019, 17 (6): 061901, Published Online: Jun. 5, 2019
Identification and separation of local and nonlocal optical nonlinear refraction effects: theory and experiment  Download: 726次
Figures & Tables
Fig. 1. Power (or intensity) dependence of the maximum value of the temperature variation in the light-absorbing liquid. The dashed line is a guide for the eyes. The insert is the patterns of the temperature variation under the irradiation of three powers.
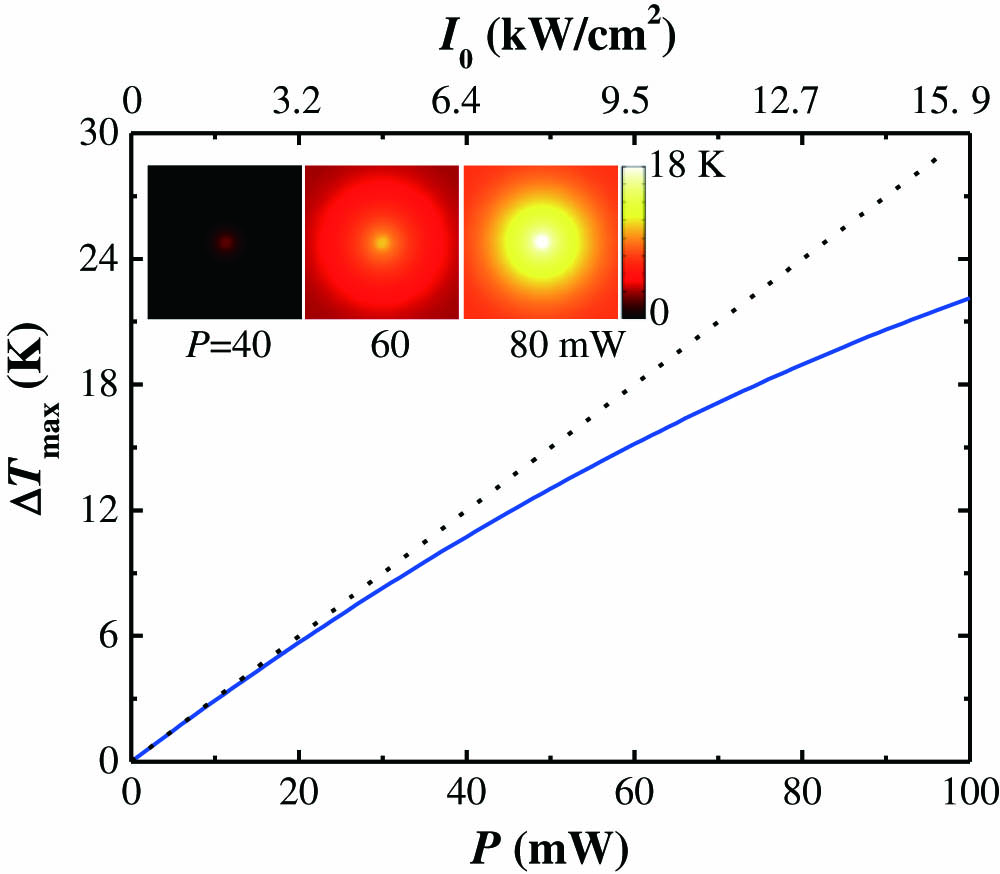
Fig. 2. Examples of CA Z-scan traces for fullerene/toluene solution with the same excitation power of 10 mW at the wavelengths of (a) 671 nm and (b) 532 nm, respectively. The scatters are the experimental data, while the solid (or dashed) lines are the theoretical fits by the Z-scan theory on local without (or with) nonlocal refractive nonlinearities described in the text. The inserts of (a) and (b) are the measured nonlinear phase shifts versus the excitation power

Fig. 3. (a) Experimentally observed and theoretically simulated far-field intensity patterns for fullerene/toluene solution at the wavelength of 532 nm with four different incident powers. (b) The number of self-diffraction rings versus the incident power or the intensity. The circles are the experimental data, while the solid line is the theoretical fit by Eq. (14 ) described in the text. The dashed line is a guide for the eyes.

Yuxiao Han, Bing Gu, Shuai Zhang, Guanghao Rui, Jun He, Yiping Cui. Identification and separation of local and nonlocal optical nonlinear refraction effects: theory and experiment[J]. Chinese Optics Letters, 2019, 17(6): 061901.


 PDF全文
PDF全文

