Photonics Research, 2017, 5 (3): 03000207, Published Online: Oct. 9, 2018
Numerical simulation and temporal characterization of dual-pumped microring-resonator-based optical frequency combs  Download: 904次
Figures & Tables
Fig. 1. (a) Schematic diagram of dual-pumped OFC generation system. The two pump fields are coupled into a four-port MRR through the input port, and the generated OFC is measured at the drop port. (b) Energy diagram of non-degenerate FWM in the MRR.
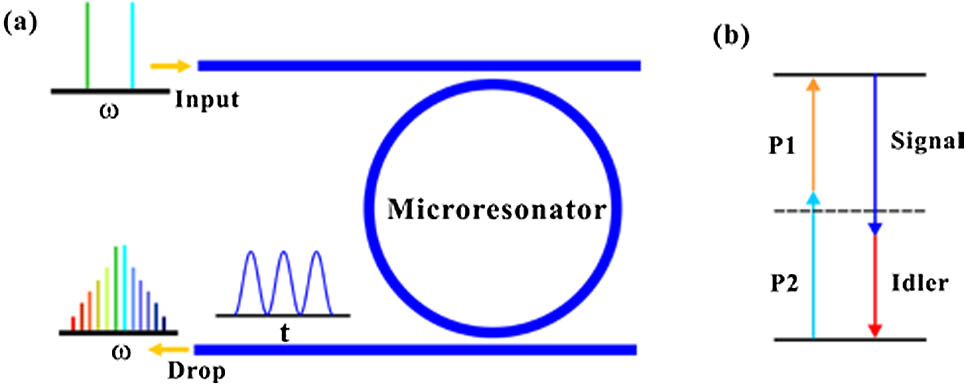

Fig. 3. Numerically calculated 40 FSR comb spectra (left column) and field profiles (right column) at different pump powers. For clear viewing, only a part of the field profile is shown at each pump power. A cosine fit to the field intensity profile is exhibited as the blue circles.

Fig. 4. Schematic diagram of the self-locked and dual-pumped OFC generation system. ISO, isolator; DL, delay line; D-PBF, dual passbands filter; OSA, optical spectrum analyzer; PM, power meter.

Fig. 5. Experimentally measured (a) 10 FSR comb spectra and (b) the corresponding autocorrelation trace.

Fig. 6. (a) 40 FSR comb spectra. The experimentally measured and numerically calculated comb spectra based on Eq. (1a ) are represented by the black solid and red dashed lines, respectively. (b) MRR output temporal intensity waveform measured with a fast photodetector. The inset shows the details of the temporal waveform resulting from the supermode beating.

Table1. Physical Parameters of the MRR
|
Xiaohong Hu, Weiqiang Wang, Leiran Wang, Wenfu Zhang, Yishan Wang, Wei Zhao. Numerical simulation and temporal characterization of dual-pumped microring-resonator-based optical frequency combs[J]. Photonics Research, 2017, 5(3): 03000207.


 PDF全文
PDF全文

