Chinese Optics Letters, 2019, 17 (6): 061702, Published Online: Jun. 12, 2019
Tunable protein microlens array  Download: 861次
Figures & Tables
Fig. 1. (a1) and (a2) SEM images of four-circle PMLADC taken from top and 45°, respectively; scale bar: 20 μm. (b1)–(b4) The LSCM images of four-circle PMLADC were taken with 1 μm position interval; scale bar: 20 μm.
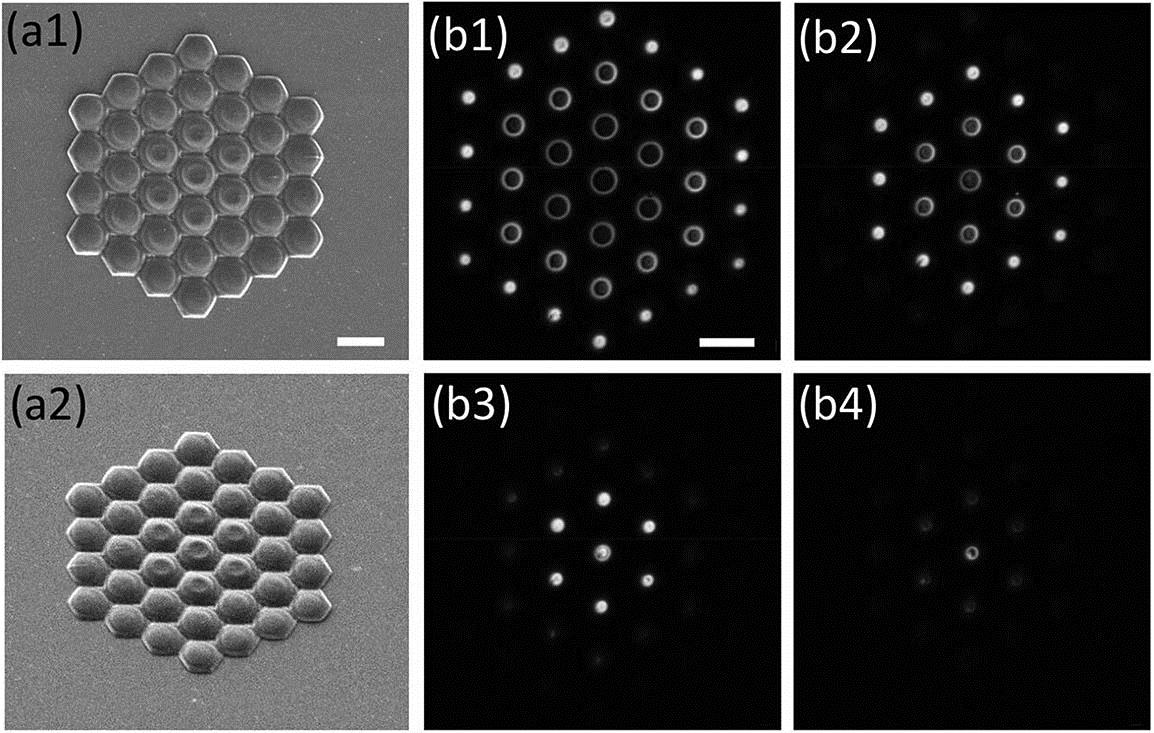
Fig. 2. (a) Schematic of the test of the PMLADC. Imaging pictures were taken at (b) 19.6 μm and (c) 24.2 μm from PMLADC; scale bar: 20 μm.

Fig. 3. (a1) and (a2) SEM images of one-row microlenses taken from the top and 45°. (b1)–(b6) Focus images were taken at different locations from the lenses: 18.2 μm, 19.6 μm, 22.7 μm, 26.2 μm, 34.0 μm, 41.4 μm, respectively. (c1)–(c6) Relative intensity distribution of focus images (b1)–(b6). Scale bar: (a) 10 μm, (b) 20 μm.

Fig. 4. (a) LSCM images of one-row PMLADC; scale bar: 10 μm. (b) The profile lines of the lens group under different pH values. (c) The curvature radii of lenses A, B, C under different pH values.


Zhishan Hou, Jiaji Cao, Aiwu Li, Han Yang. Tunable protein microlens array[J]. Chinese Optics Letters, 2019, 17(6): 061702.


 PDF全文
PDF全文

