Noninvasive blood glucose detection using a miniature wearable Raman spectroscopy system  Download: 1480次
1 State Key Laboratory of Transient Optics and Photonics, Xi’an Institute of Optics and Precision Mechanics, Chinese Academy of Science (CAS), Xi’an 710119, China
2 University of Chinese Academy of Sciences (CAS), Beijing 100049, China
3 State Key Laboratory of Power Systems, Department of Thermal Engineering, Tsinghua-BP Clean Energy Center, Tsinghua University, Beijing 100084, China
4 School of Science, Xi’an Jiaotong University, Xi’an 710049, China
Figures & Tables
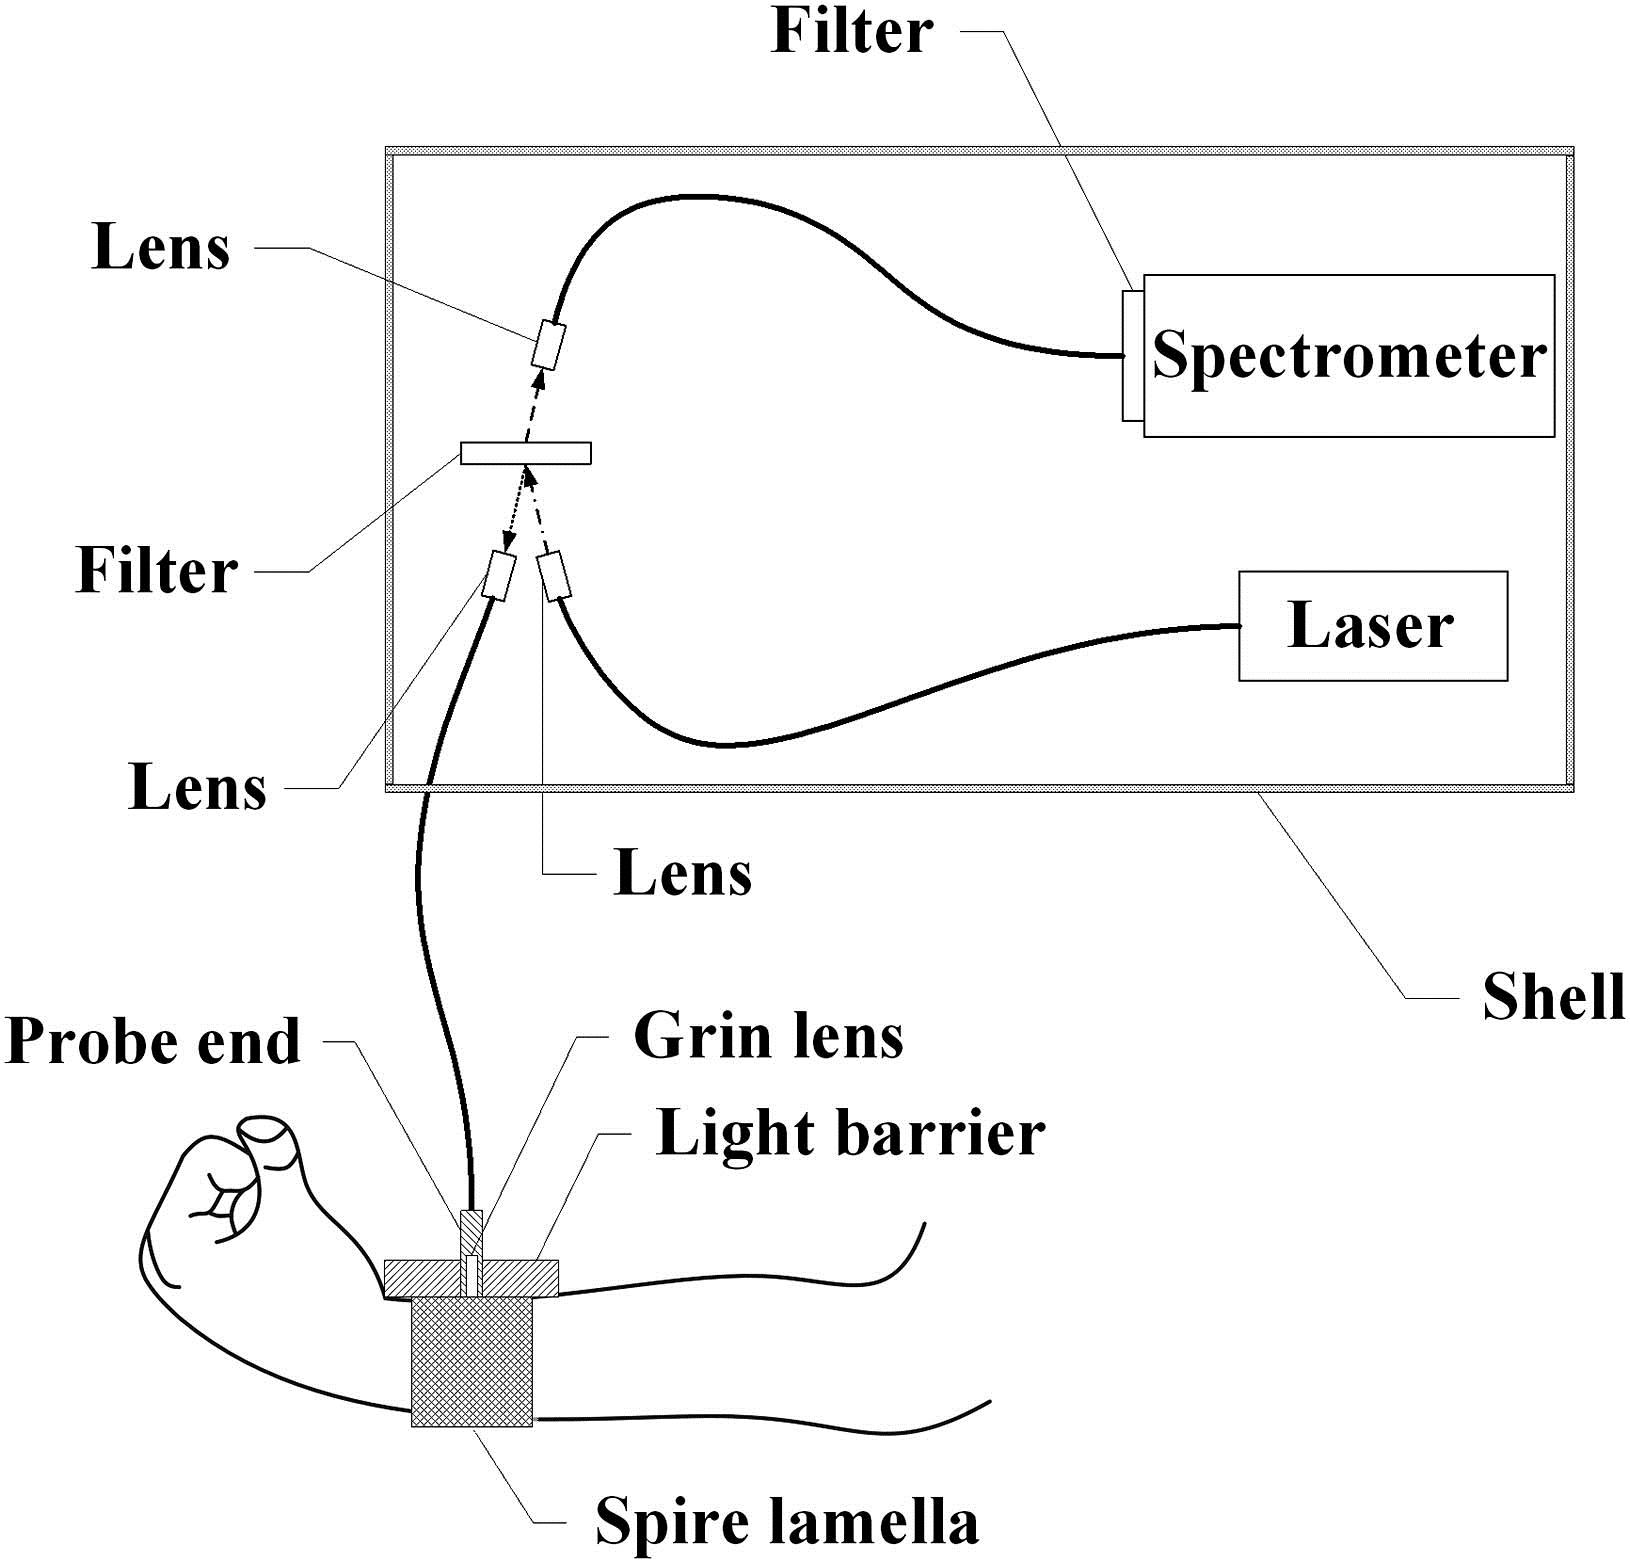
Fig. 1. Experimental setup: the schematic diagram of the miniature wearable Raman spectroscopy system.
下载图片 查看原文
Fig. 2. (Color online) Raman spectra of glucose solutions with concentrations of 3.8–13.3 mmol/L. The area of and the concentration of glucose are directly related.
下载图片 查看原文
Fig. 3. (Color online) Difference between the relationship of the peak area and intensity with the concentration of the glucose solution.
下载图片 查看原文
Fig. 4. (Color online) Calculated result of the glucose solution, with a coefficient of determination of 98.1% and an MAE of 0.394 mmol/L.
下载图片 查看原文
Fig. 5. (Color online) Comparison between the spectrum of the rat skin and the spectrum of the glucose solution. The spectrum of the rat skin is more complicated.
下载图片 查看原文
Fig. 6. (Color online) Calculated results for one of the rat samples.
下载图片 查看原文
Fig. 7. (Color online) (A) Comparison between the spectrum of the human skin and the spectrum of the rat skin. (B) Comparison between the spectrum of the human skin and the spectrum of glucose. The spectrum of the human skin is similar to the spectrum of the rat skin.
下载图片 查看原文
Fig. 8. (A) Calculated result for one of the human volunteers without using a grin lens. (B) Calculated result for one of the human volunteers using a grin lens. The result when using a grin lens is obviously better.
下载图片 查看原文
Fig. 9. (Color online) Comparison between calculated results for all samples and one of the samples.
下载图片 查看原文
Table1. Summary of Results from Cross-Validated Calibrations Generated from Data Set of Measurements on Each of the 11 Laboratory Rats
| Rat | | MAE (mmol/L) | Sample Capacity |
|---|
| 1 | 0.960 | 0.149 | 25 | | 2 | 0.954 | 0.265 | 147 | | 3 | 0.924 | 0.543 | 53 | | 4 | 0.905 | 0.310 | 77 | | 5 | 0.893 | 0.279 | 53 | | 6 | 0.889 | 0.130 | 23 | | 7 | 0.879 | 0.227 | 24 | | 8 | 0.868 | 0.184 | 23 | | 9 | 0.853 | 0.159 | 30 | | 10 | 0.851 | 0.217 | 229 | | 11 | 0.851 | 0.306 | 51 | | Mean | 0.893 | 0.252 | 67 |
|
查看原文
Table2. Summary of Results from Cross-Validated Calibrations Generated from Data Set of Measurements on Each of the 10 Human Volunteers
| Human | | MAE (mmol/L) | Sample Capacity |
|---|
| 1 | 0.958 | 0.105 | 29 | | 2 | 0.935 | 0.379 | 59 | | 3 | 0.866 | 0.285 | 21 | | 4 | 0.85 | 0.275 | 37 | | 5 | 0.835 | 0.398 | 35 | | 6 | 0.83 | 0.407 | 37 | | 7 | 0.827 | 0.620 | 35 | | 8 | 0.815 | 0.317 | 35 | | 9 | 0.765 | 0.455 | 35 | | 10 | 0.759 | 0.410 | 21 | | Mean | 0.844 | 0.365 | 34 |
|
查看原文
Yi Zheng, Xiangping Zhu, Zhe Wang, Zongyu Hou, Fei Gao, Rongzhi Nie, Xiaoxia Cui, Jiangbo She, Bo Peng. Noninvasive blood glucose detection using a miniature wearable Raman spectroscopy system[J]. Chinese Optics Letters, 2017, 15(8): 083001.


 PDF全文
PDF全文

