Photonics Research, 2018, 6 (6): 06000530, Published Online: Jul. 2, 2018
Wide-field in situ multiplexed Raman imaging with superresolution
Figures & Tables
Fig. 2. Typical Raman spectra of the three different encoded SERS nanoparticles. Asterisks (*) indicate the selected peaks, and colored rectangular areas indicate the spectral regions that were used for multiplexed imaging in the experiments.
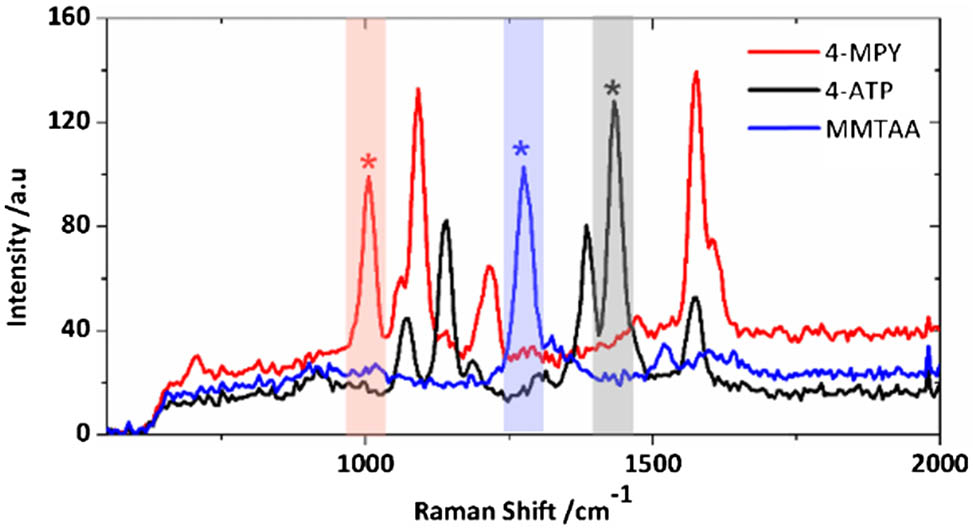
Fig. 3. (a) Normalized intensities of fluorescent scattering and Raman scattering signals over time. The signals were detected at a frame rate of 0.2 Hz over an exposure time of 0.3 s. The red curve represents the Raman signal, and the black curve represents the fluorescent signal. (b) and (c) show time-lapse images of the fluorescent microspheres and the SERS nanoparticles, respectively.
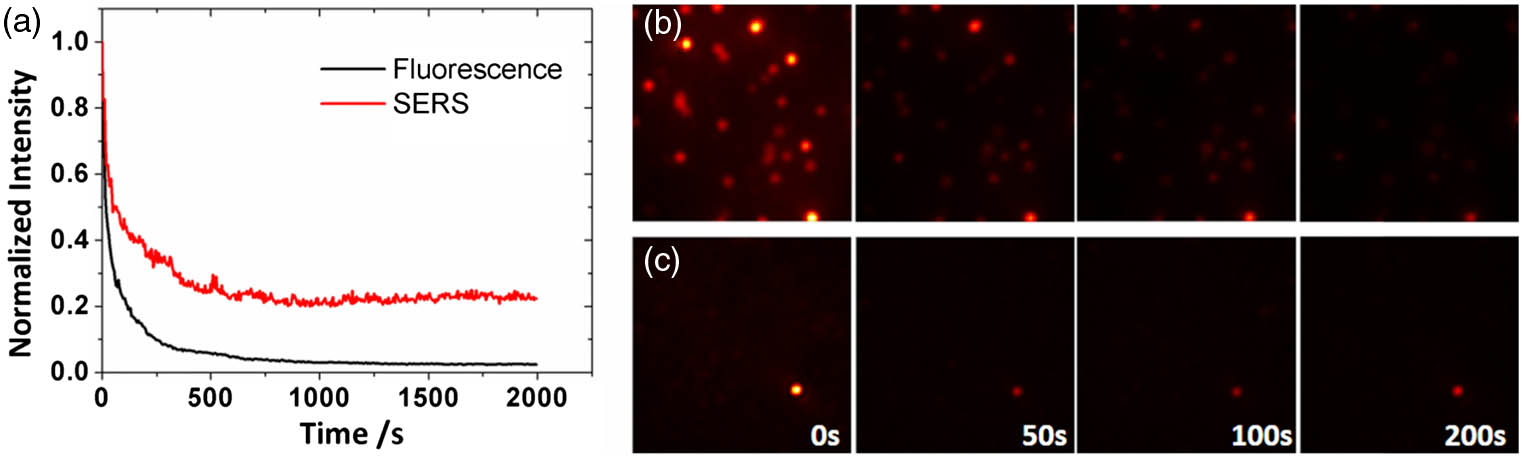
Fig. 4. Wide-field imaging of the SERS nanoparticles. (a) Conventional imaging results and (b) the reconstructed wide-field image; (c) Gaussian fitting profiles of the normalized intensity of the images framed in (a) and (b). Scale bar: 1 μm.
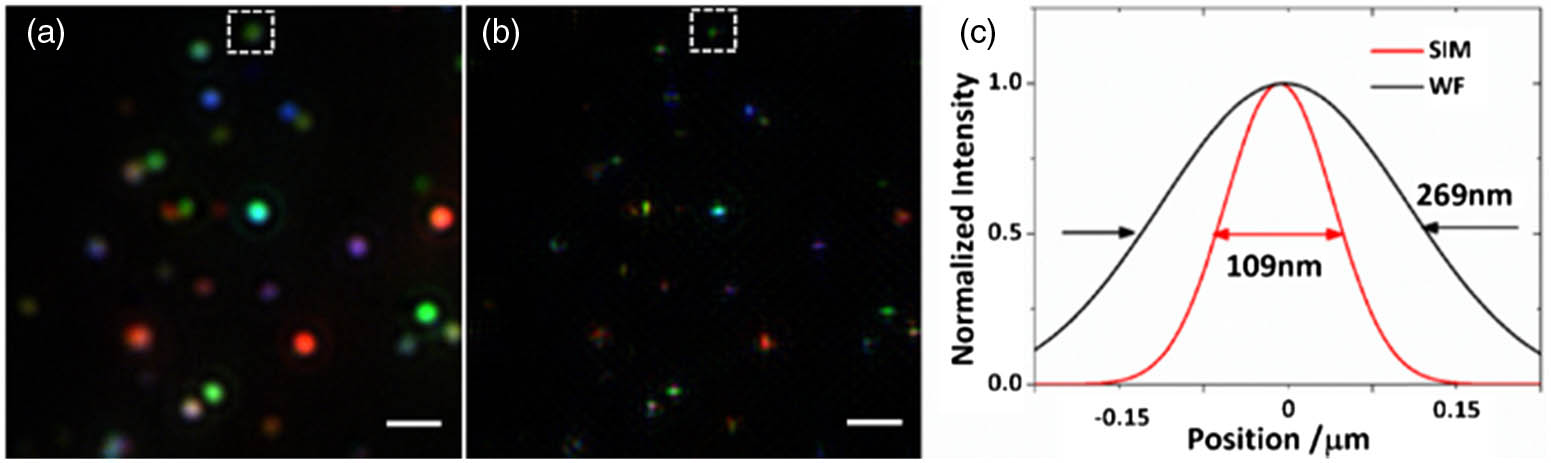
Fig. 5. Multiplexed imaging of 3T3 cells labeled using surface-modified SERS nanoparticles. (a) Bright field image of 3T3 cell, and (b) conventional and (c) reconstructed wide-field pseudo-color images overlaid with the framed bright field image from (a). Scale bars: 5 μm in (a), and 1 μm in (b) and (c).

Houkai Chen, Xiaojing Wu, Yuquan Zhang, Yong Yang, Changjun Min, Siwei Zhu, Xiaocong Yuan, Qiaoliang Bao, Jing Bu. Wide-field in situ multiplexed Raman imaging with superresolution[J]. Photonics Research, 2018, 6(6): 06000530.


 PDF全文
PDF全文

