中国激光, 2019, 46 (8): 0801002, 网络出版: 2019-08-13
相位型光寻址空间光调制器稳定性分析  下载: 1114次
Stability Analysis for Optically-Addressed Phase-Only Spatial Light Modulator
图 & 表
图 1. OASLM的工作原理及液晶光阀的结构,通过470 nm写入光对1053 nm读出光进行调制
Fig. 1. Principle of OASLM and structure of OALCLV. 1053-nm read light is modulated by 470-nm write light
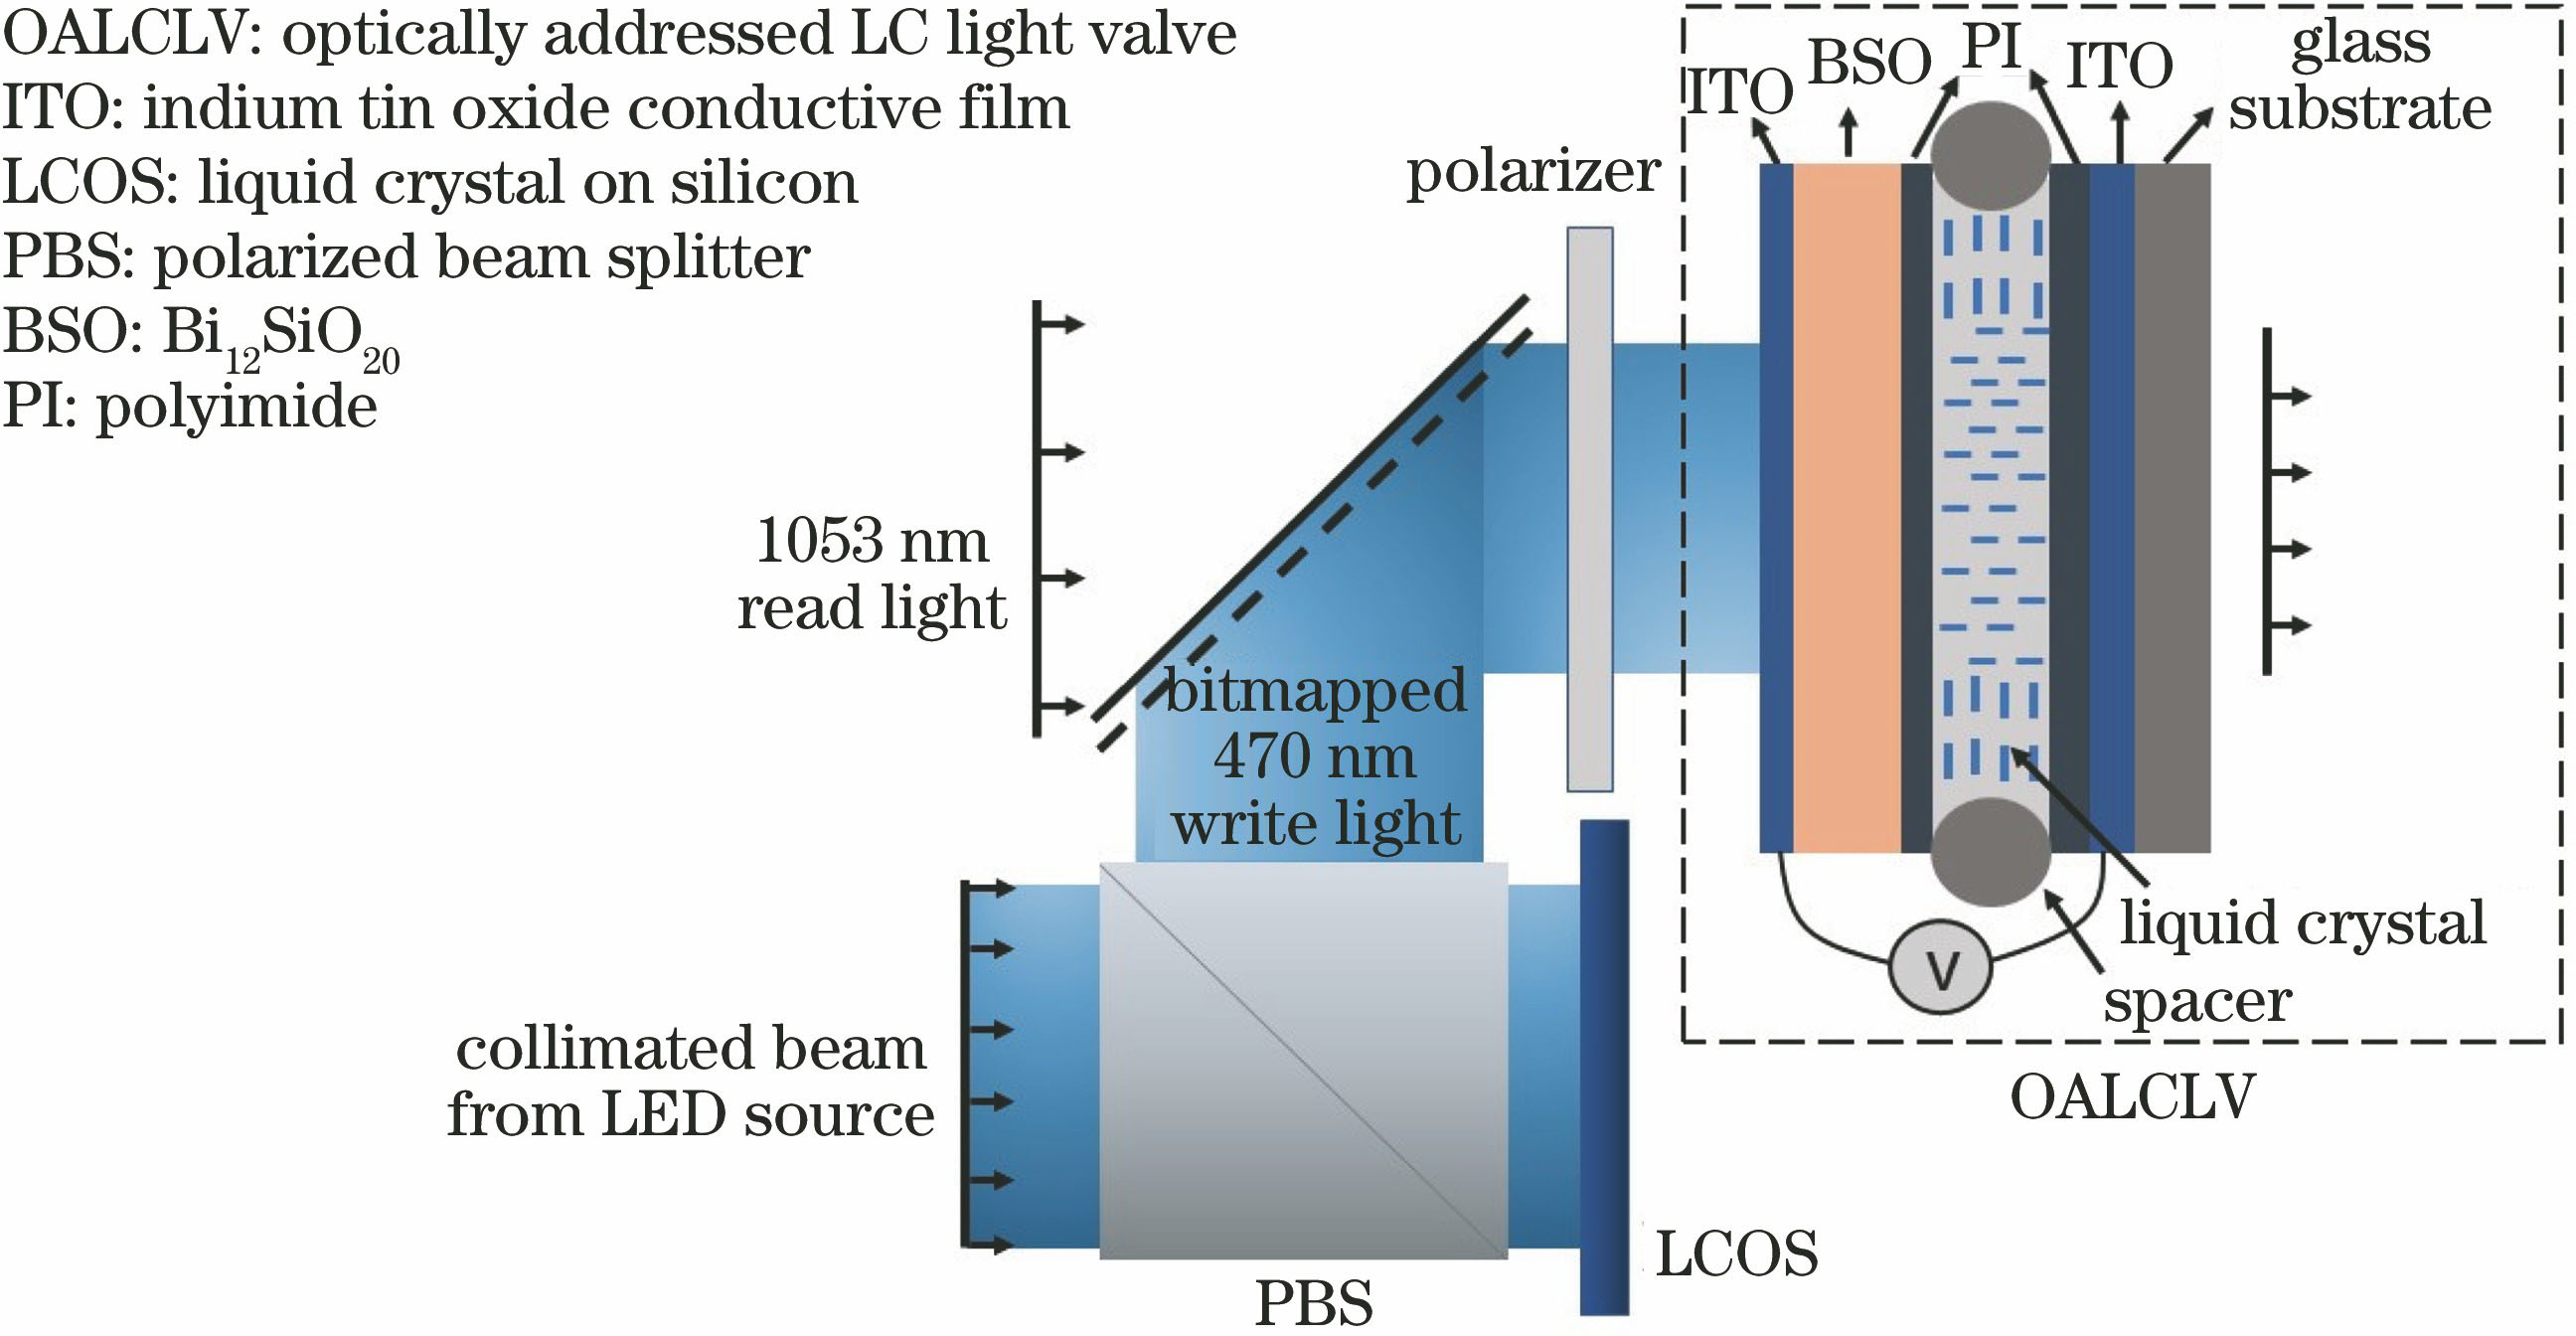
图 2. 光寻址液晶光阀的等效工作电路,包括液晶和BSO晶体两部分
Fig. 2. Equivalent circuit of OALCLV, includingliquid crystal and BSO crystal

图 3. 不同写入光光强下,液晶层电压RMS值随电压频率的变化关系。实线为0.8灰度值对应的液晶层电压模拟计算值,虚线为0灰度值对应的液晶层电压模拟计算结果,点值为相应的实验测量结果
Fig. 3. RMS voltage on LC layer as functions of voltage frequency at different write light intensity values. Solid curves are simulated voltage values on liquid crystal layer corresponding to 0.8 gray level, and dashed curves are simulated voltage values on liquid crystal layer corresponding to 0 gray level, and dots are corresponding experimental results


图 5. 100 Hz驱动电压频率下电压波形及相位波动。(a)液晶光阀驱动电压波形及液晶层分压波形仿真结果;(b)驱动电压波形对应的相位调制波动仿真结果,具有200 Hz频率及6%的相位波动率
Fig. 5. Voltage waveform and phase fluctuation with 100 Hz driving voltage frequency. (a) Simulated shapes of voltage on OALCLV and LC layer; (b) phase modulation fluctuation with frequency of 200 Hz and fluctuation rate of 6%


图 7. 示波器实测的100 Hz 驱动电压频率下OASLM 对入射光的调制结果,波动频率为200 Hz
Fig. 7. 200-Hz modulation fluctuation corresponds to OASLM at 100-Hz driving voltage frequency measured by oscilloscope

图 8. 相位调制波动率随驱动电压频率的变化
Fig. 8. Phase modulation fluctuation rate as a function of voltage frequency

图 9. OASLM响应时间的测量结果。(a)输出光波形;(b)写入光波形
Fig. 9. Measurement result of OASLM response time. (a) Waveform of output light; (b) waveform of write light

图 10. OASLM的相位改变量曲线与相位波动率。(a) 100~400 Hz电压频率下,相位改变量曲线的实验测量结果,实线为相位改变量正常值,虚线为波动幅度;(b)最大相位改变量处,相位波动率随电压频率的变化,插图为300~600 Hz相位波动率的分布细节
Fig. 10. Phase change curves and phase fluctuation rate of OASLM. (a) Phase change curves when voltage frequency increases from 100 Hz to 400 Hz. Solid curves are normal values of phase change, and dashed curves are fluctuation range; (b) phase fluctuation rate as a function of voltage frequency at maximum phase change. The inset is phase fluctuation rate details from voltage frequency of 300 Hz to 600 Hz

图 11. 不同驱动频率下示波器测量的调制结果。 (a) f=100 Hz;(b) f=200 Hz;(c) f=300 Hz;(d) f=400 Hz;(e) f=500 Hz;(f) f=600 Hz
Fig. 11. Modulation results measured by oscilloscope corresponding to different voltage frequencies. (a) f=100 Hz;(b) f=200 Hz; (c) f=300 Hz; (d) f=400 Hz; (e) f=500 Hz; (f) f=600 Hz

图 12. 4种写入光强度范围下,写入光强度与灰度值的对应关系,插图为0~0.03灰度值对应的光强值细节
Fig. 12. Correspondence between write light intensity and gray level under four kinds of write light intensity range. The inset is detailed intensity values corresponding to gray level values of 0-0.03

图 13. 400 Hz 驱动电压频率下,OASLM的相位调制响应曲线与相位波动率。(a) 4种写入光强度范围对应的相位调制响应曲线,实线为相位改变量的正常值,虚线为波动幅度;(b)最大相位改变量处相位波动率随写入光强度的变化
Fig. 13. Phase modulation curves and phase fluctuation rate when OASLM is at 400-Hz driving voltage frequency. (a) Phase change curves when OASLM is at four kinds of write light intensity range. Solid curves are normal values of phase change, and dashed curves are fluctuation range; (b) phase fluctuation rate as a function of write light intensity at maximum phase change

表 1Multisim软件仿真得到的液晶光阀的等效电路参数
Table1. Parameters for Multisim software simulating OASLM
|
裴丽丽, 黄大杰, 范薇. 相位型光寻址空间光调制器稳定性分析[J]. 中国激光, 2019, 46(8): 0801002. Lili Pei, Dajie Huang, Wei Fan. Stability Analysis for Optically-Addressed Phase-Only Spatial Light Modulator[J]. Chinese Journal of Lasers, 2019, 46(8): 0801002.


 PDF全文
PDF全文

