Chinese Optics Letters, 2017, 15 (9): 090003, Published Online: Jul. 19, 2018
Imaging the structure and organization of mouse cerebellum and brain stem with second harmonic generation microscopy  Download: 1112次
Figures & Tables
Fig. 1. From an SHG image to the structure of brain slice. (a) The position schematic of the coronal brain slice. (b) Morphology of a cerebellum and brain stem slice detected from SHG imaging. (c) Schematic of the discernable regions in SHG image (b). (d) The spectra of the slice with the Nikon A1 Microscope using an 840 nm laser. Scale bar in (b) is 1 mm.
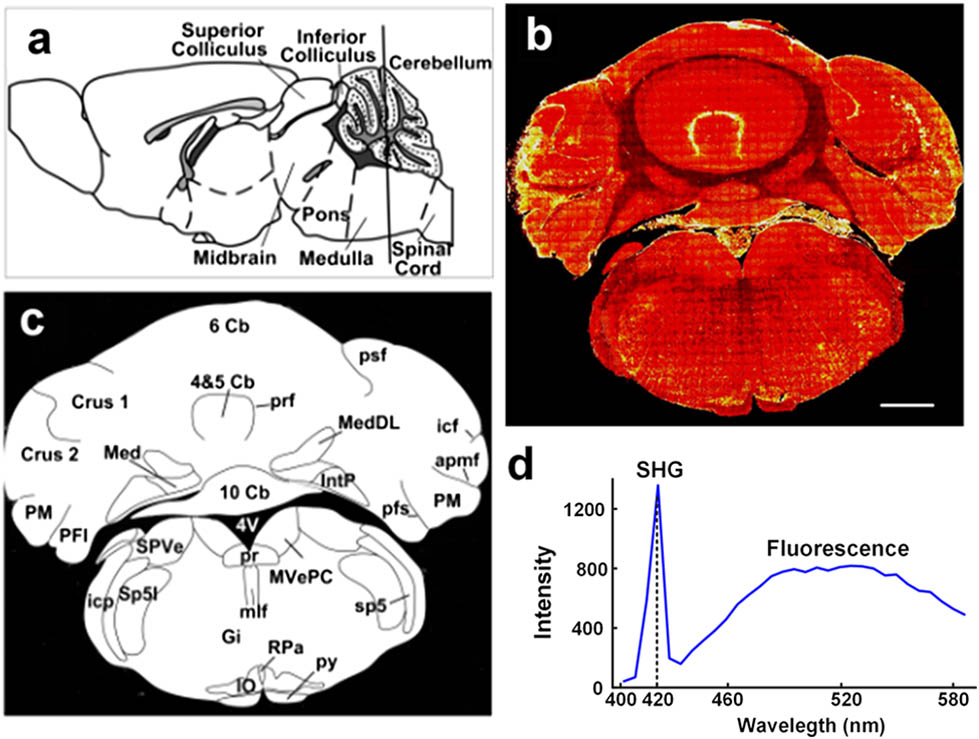
Fig. 2. (Color online) Combined SHG and TPEF images of the mouse cerebellum and brain stem slices. (a) SHG image shown in hot colormap, (b) TPEF image in green, (c) the merged SHG/TPEF image of the cerebellar cortex. The black, blue, and white arrows indicate the neuron somas in ML, PCL, and GL, respectively. (d)–(f) are the SHG image (hot colormap), TPEF (green), and the merged images SHG/TPEF of icp and SP5. Scale bars in (c) and (f) are 100 μm.

Fig. 3. (Color online) Detailed structures of different brain stem and cerebellar regions obtained by label-free SHG imaging. (a)–(f) the images of the MvePC, SpVe, Gi, IO, mlf, and py regions. Blue and white arrows indicate cell somas and the reticular formations, respectively. (g) Cerebellar fissure indicated by the white arrow. (h) Blood vessel and apical dendrites are marked by white and green arrows, respectively. (i)–(k) Deep cerebellar nucleus images of MedDL, Med, and IntP regions. Blue arrows indicate cell somas. (l) Magnified image of PCL. Blue and white arrows indicate PCs and the AIS structure of the PC, respectively. Images shown in hot colormap. Scale bar is 50 μm.

Table1. Densities of the Cells in Different Layers and Regions of the Cerebellar Cortex.
|
Xiuli Liu, Daozhu Hua, Ling Fu, Shaoqun Zeng. Imaging the structure and organization of mouse cerebellum and brain stem with second harmonic generation microscopy[J]. Chinese Optics Letters, 2017, 15(9): 090003.


 PDF全文
PDF全文

