变焦显微成像三维测量算法性能分析  下载: 1036次
Performance Analysis of Three-Dimensional Measurement Algorithm with Focus Variation Microscopic Imaging
1 安徽建筑大学机械与电气工程学院, 安徽 合肥 230601
2 合肥工业大学仪器科学与光电工程学院, 安徽 合肥 230009
图 & 表
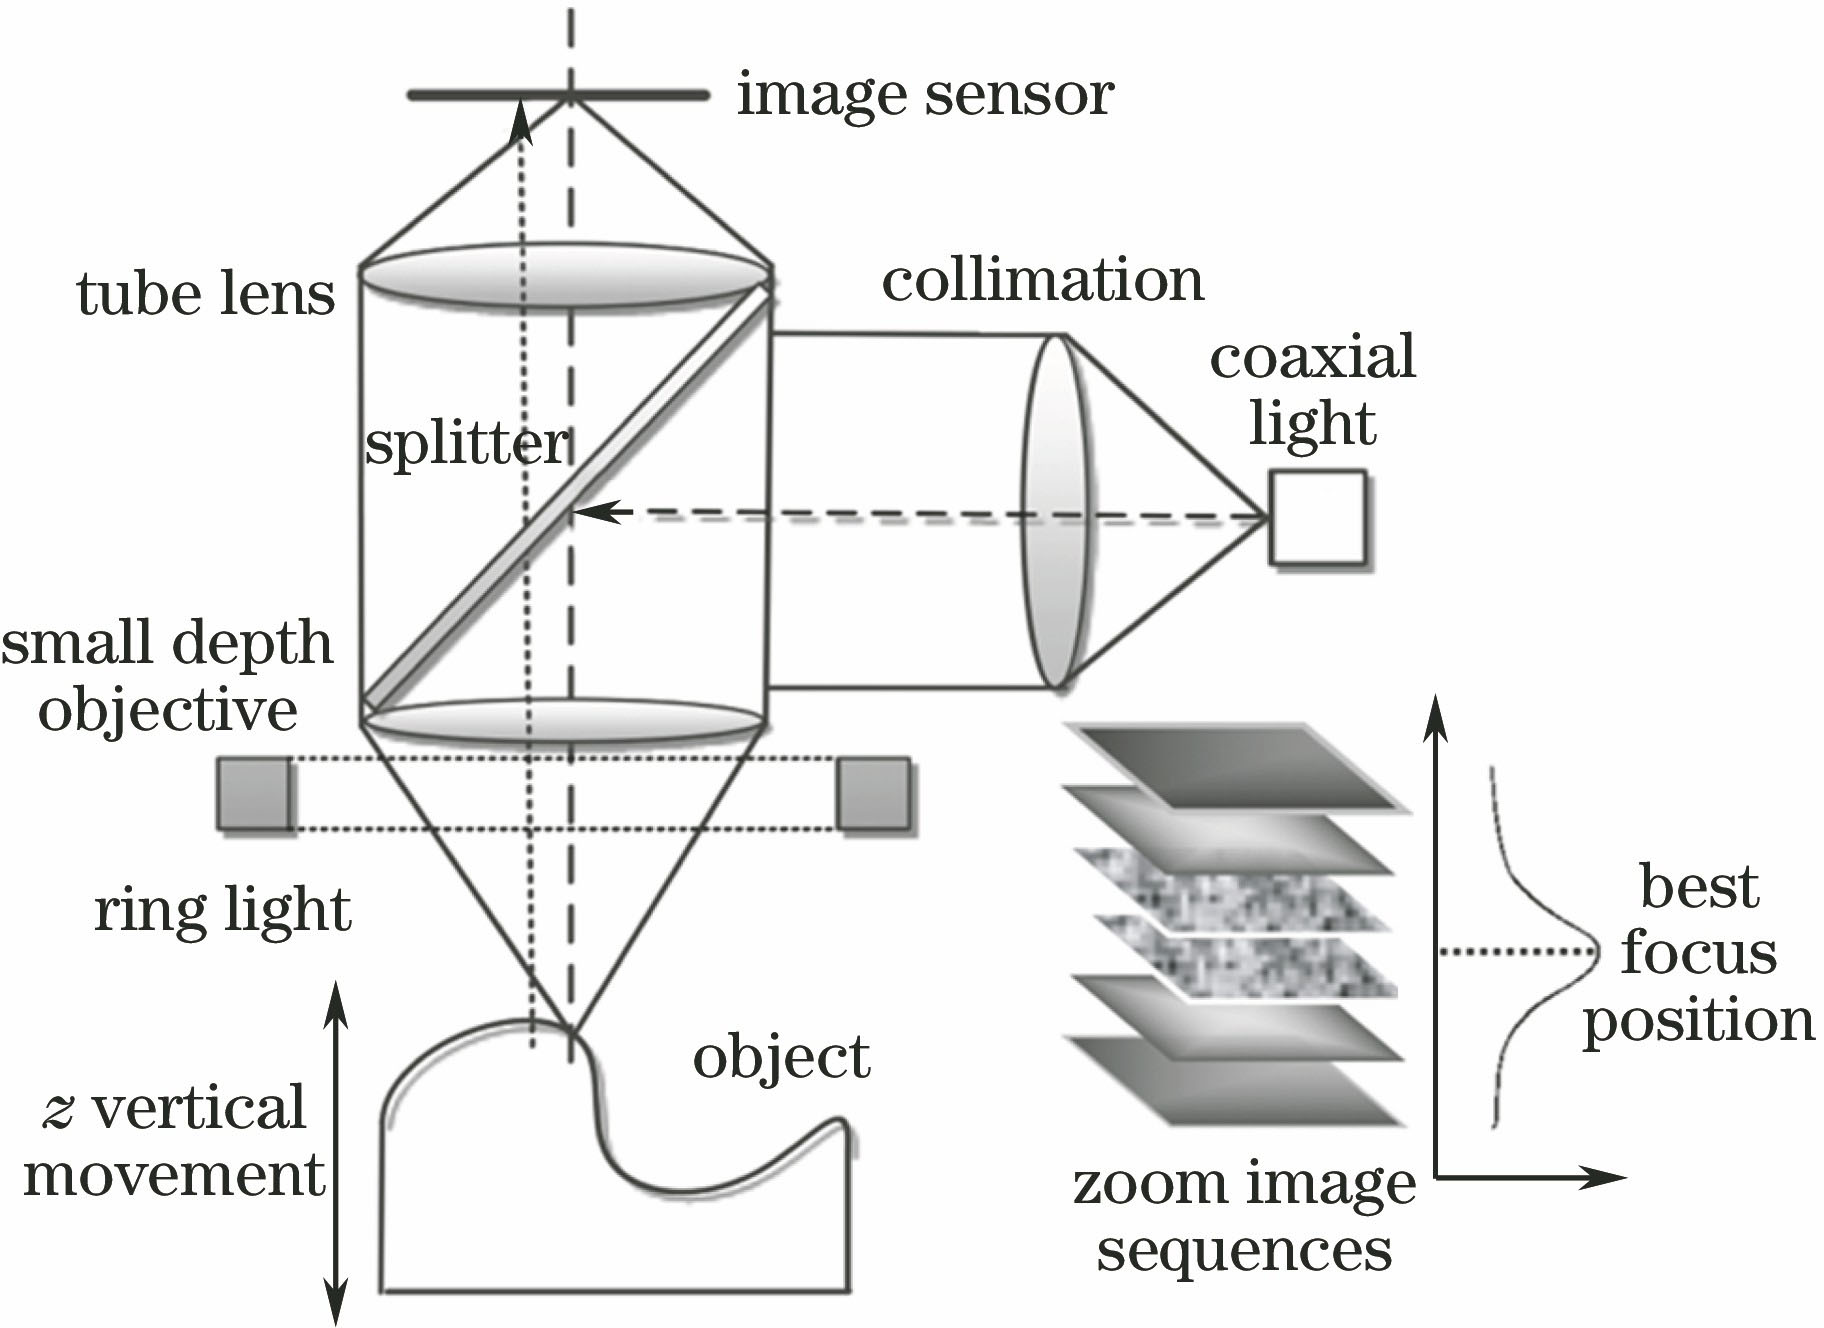
图 1. 变焦原理图
Fig. 1. Schematic of focus variation
下载图片 查看原文
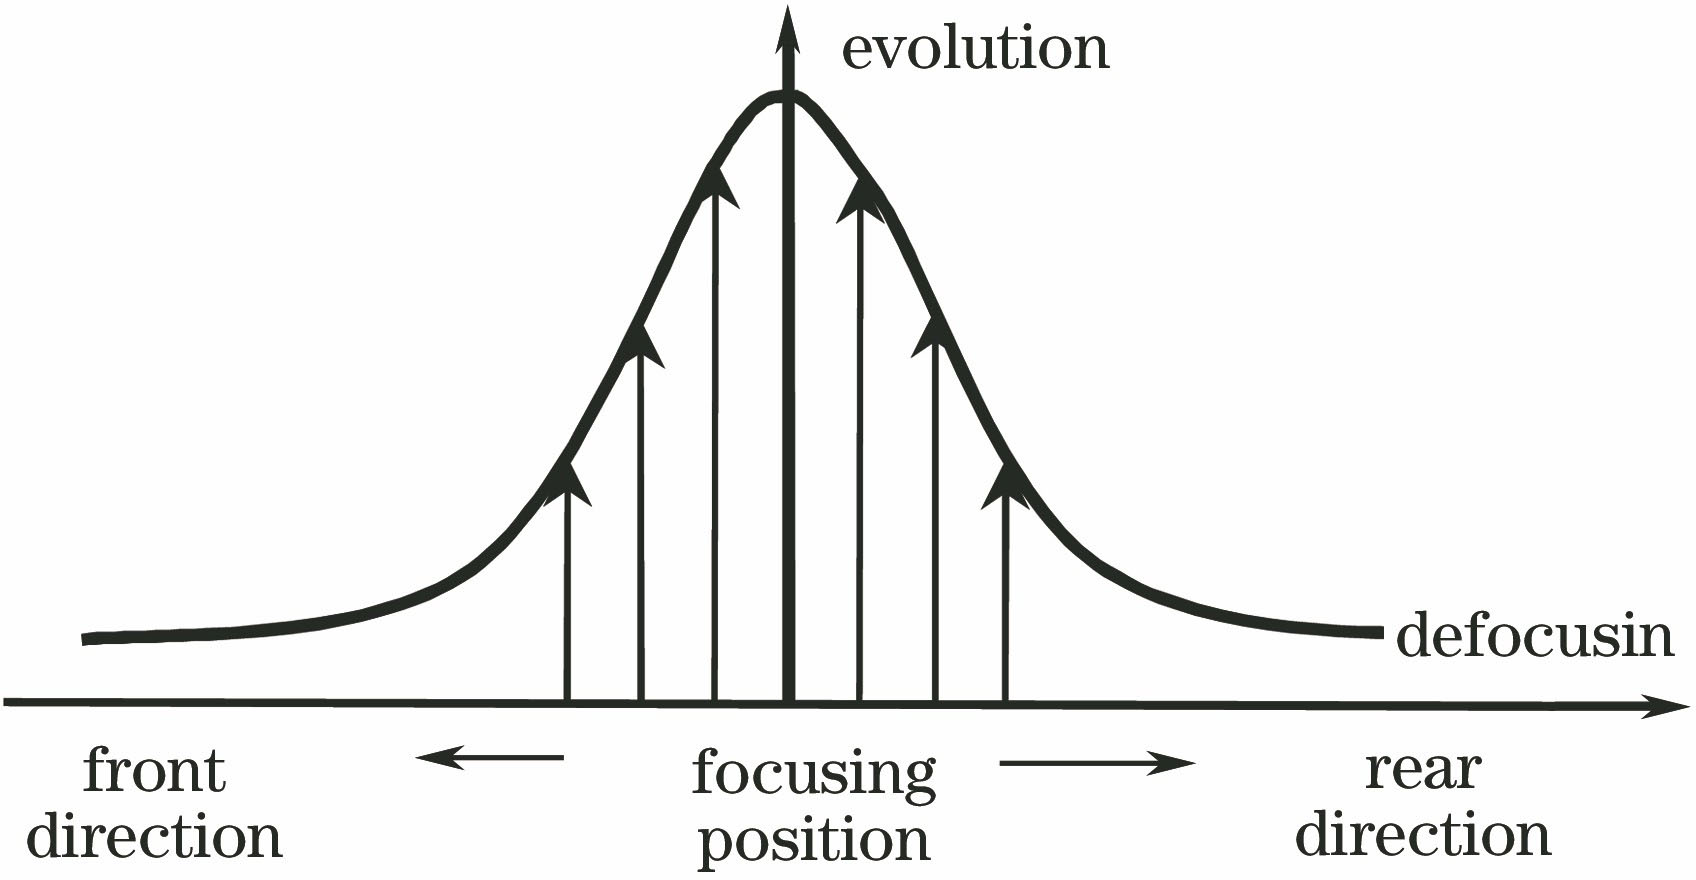
图 2. 理想聚焦曲线
Fig. 2. Ideal focusing curve
下载图片 查看原文
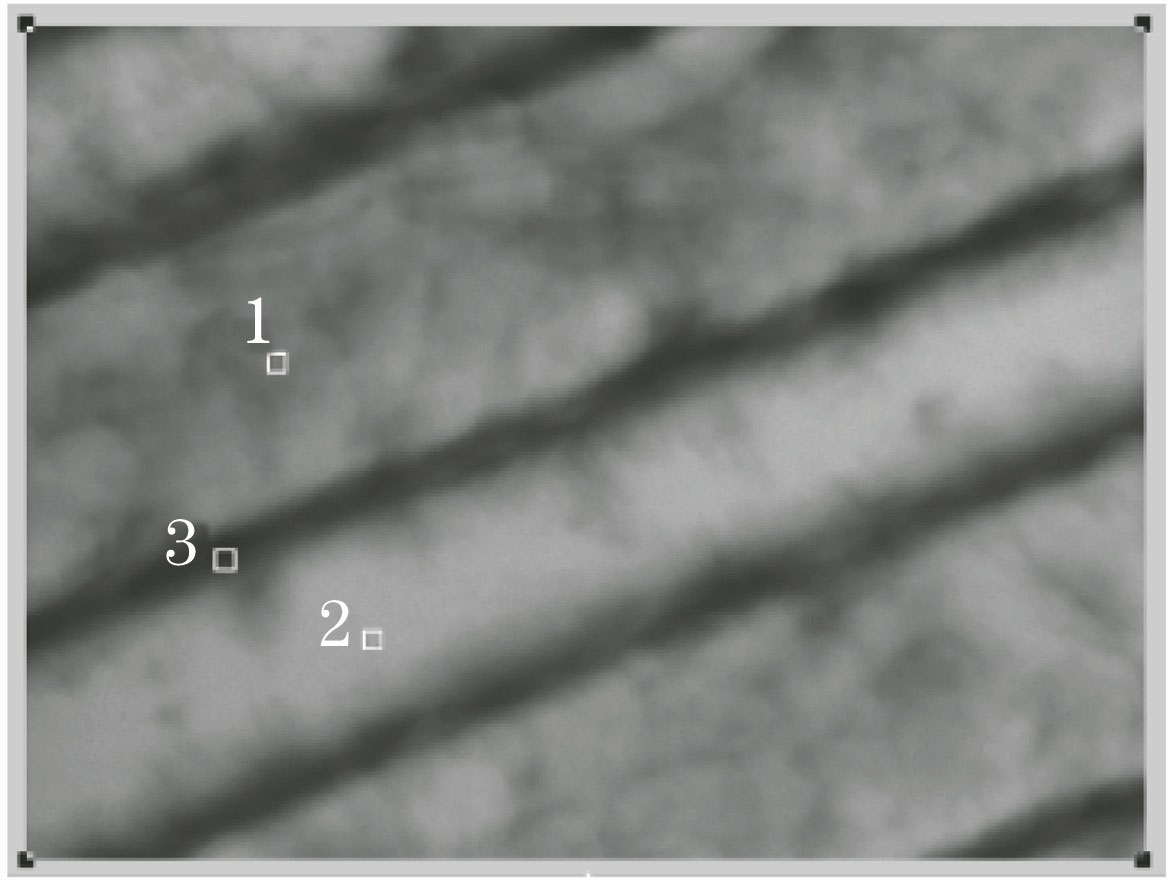
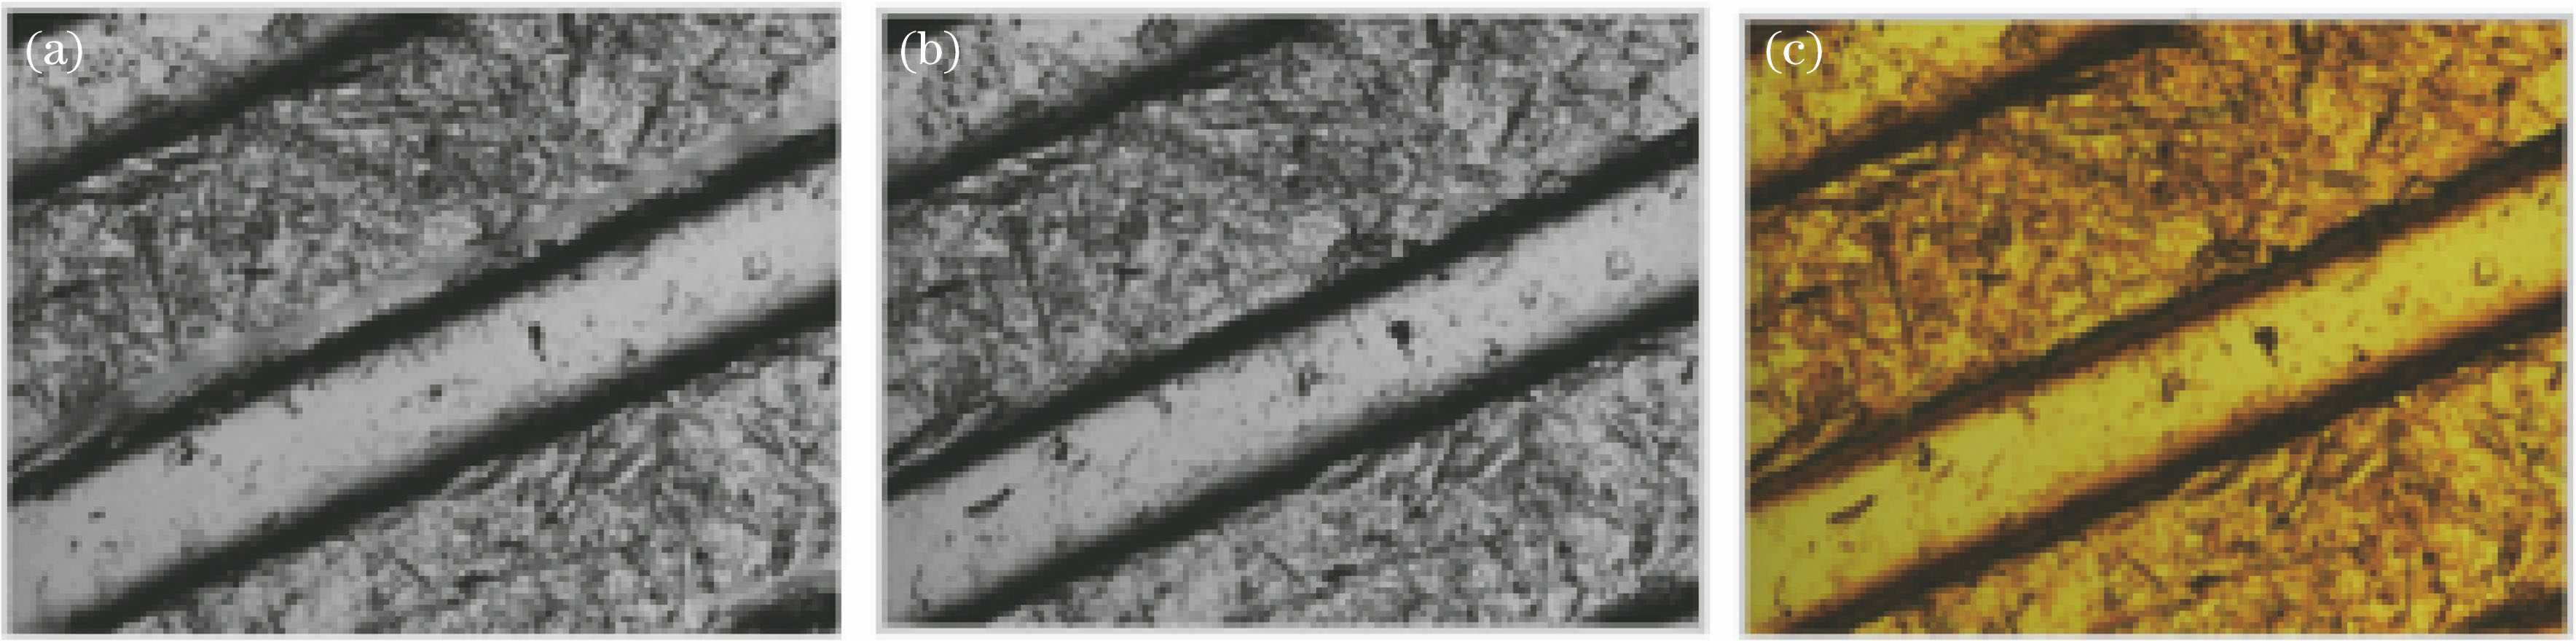
图 3. 变焦显微实验图像与三个测试点
Fig. 3. An experimental image obtained using focus variation microscopy and three testing points
下载图片 查看原文
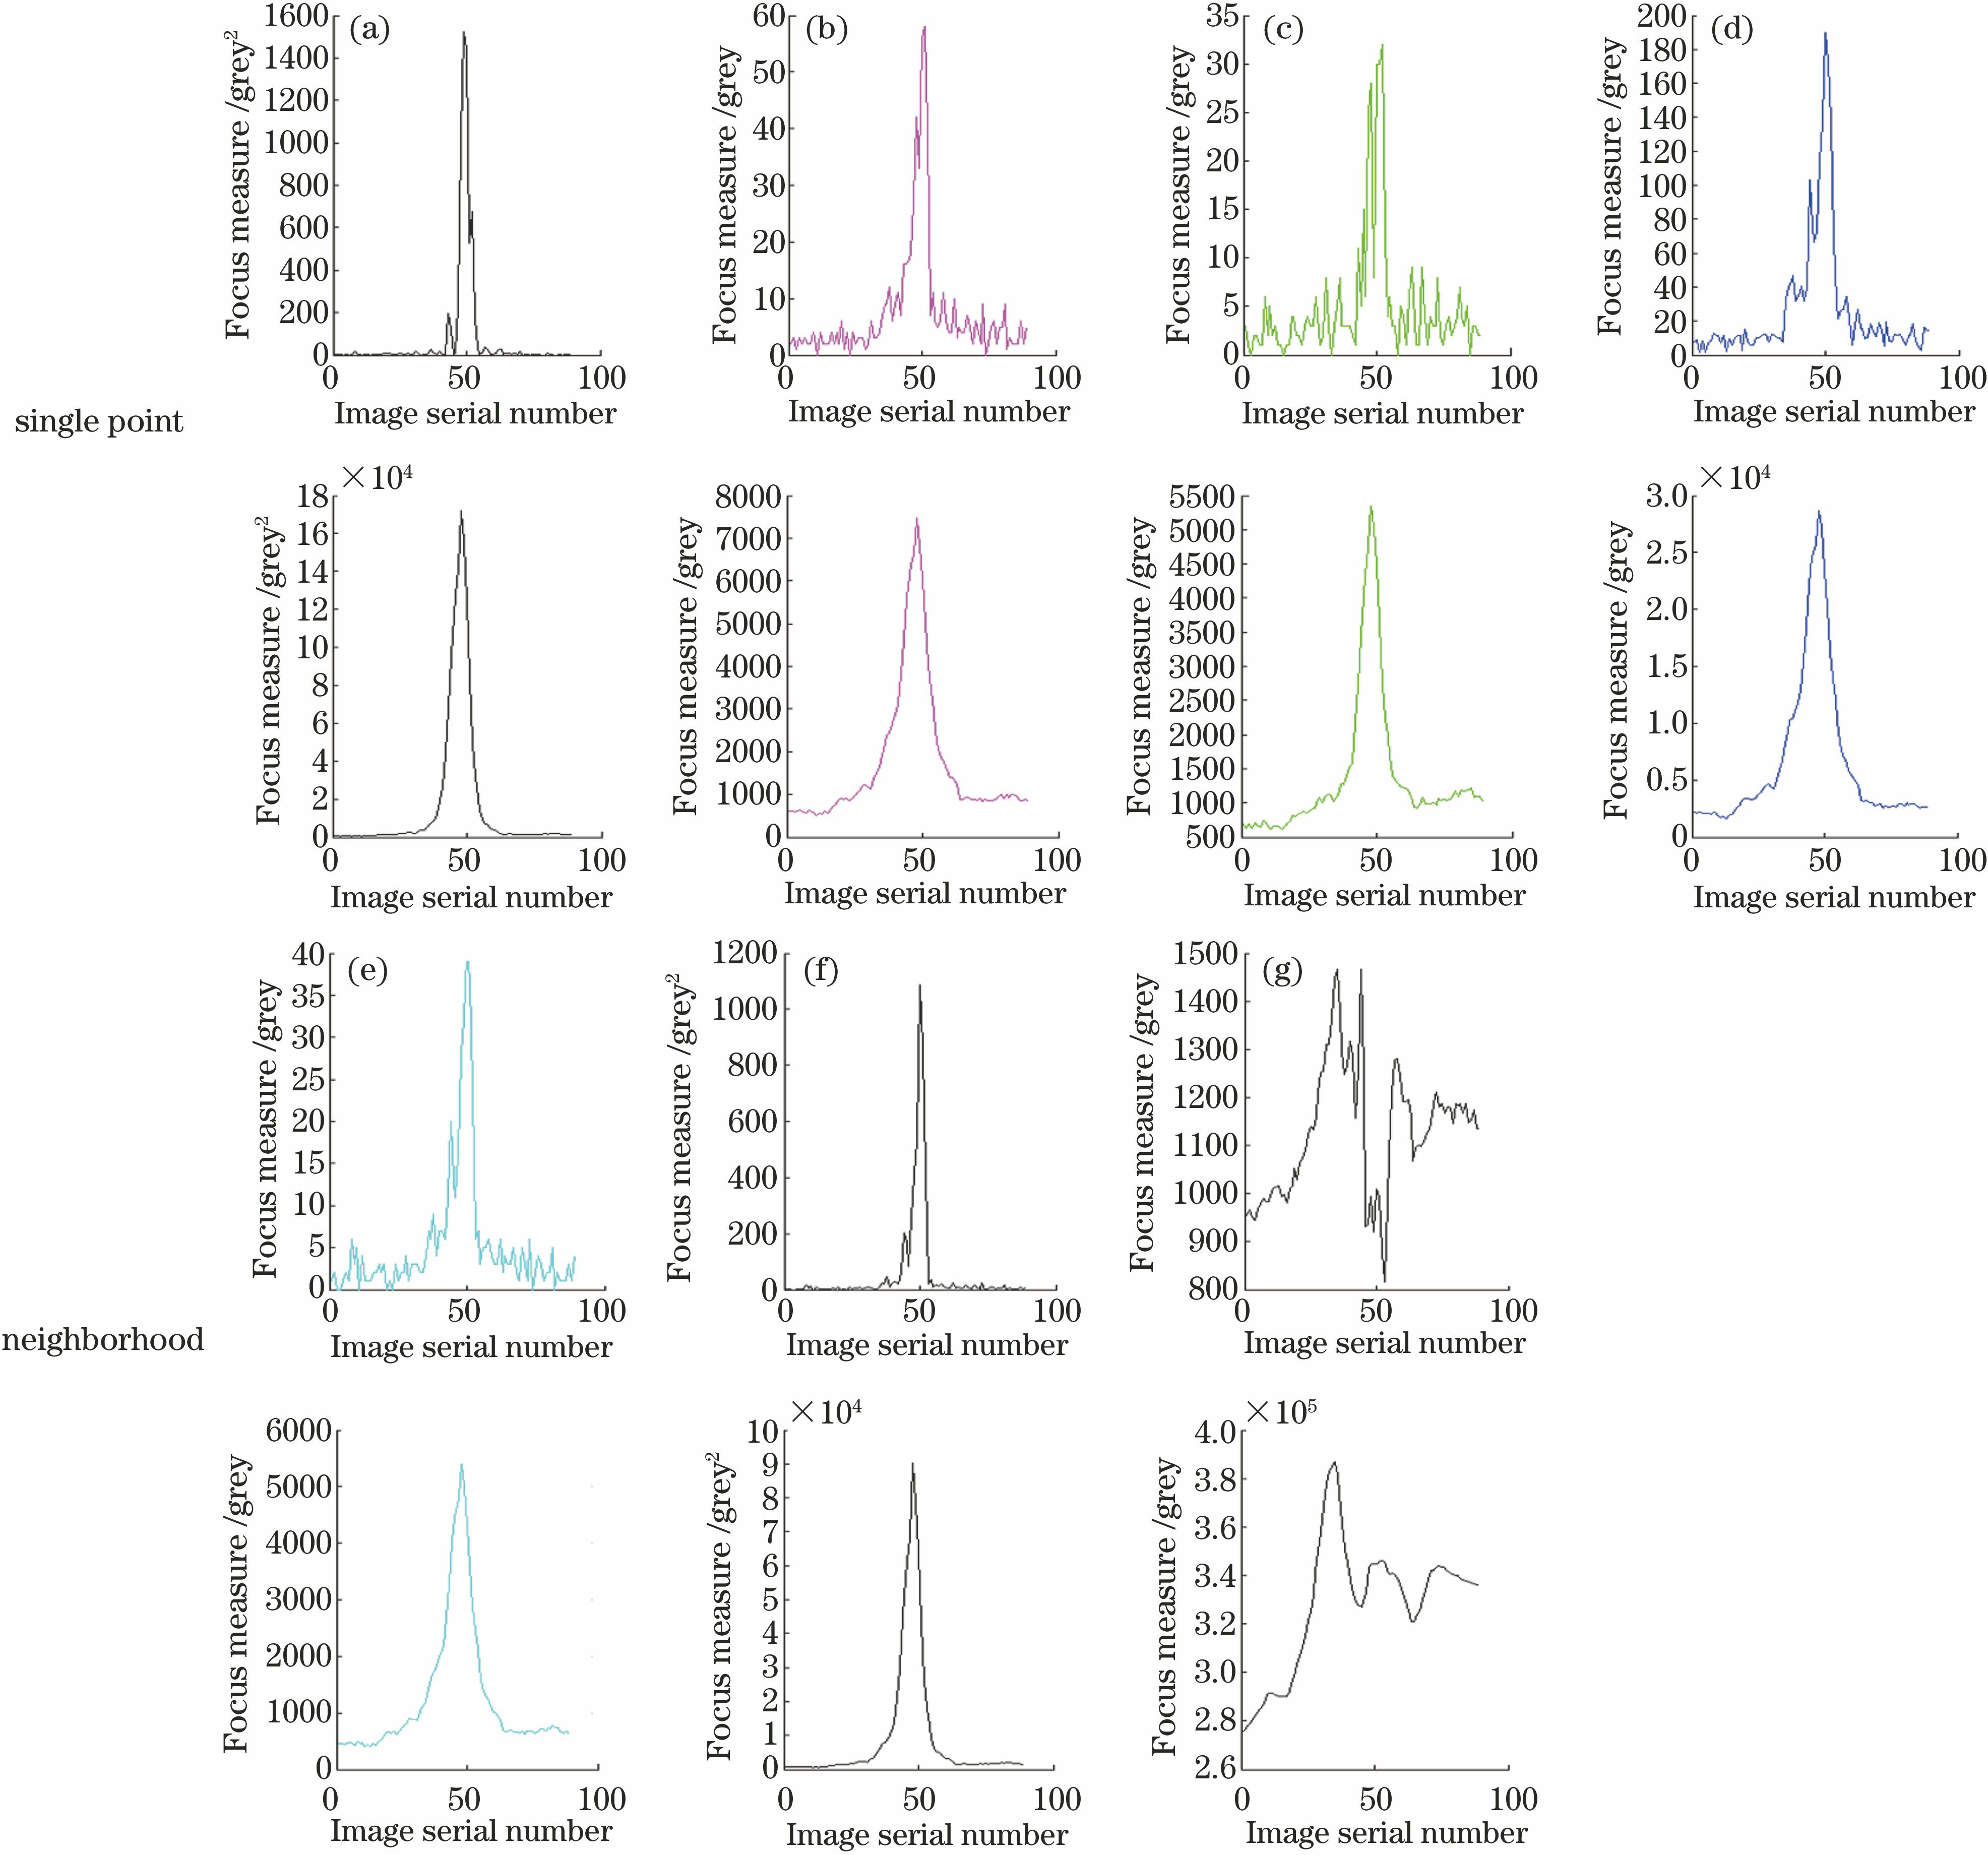
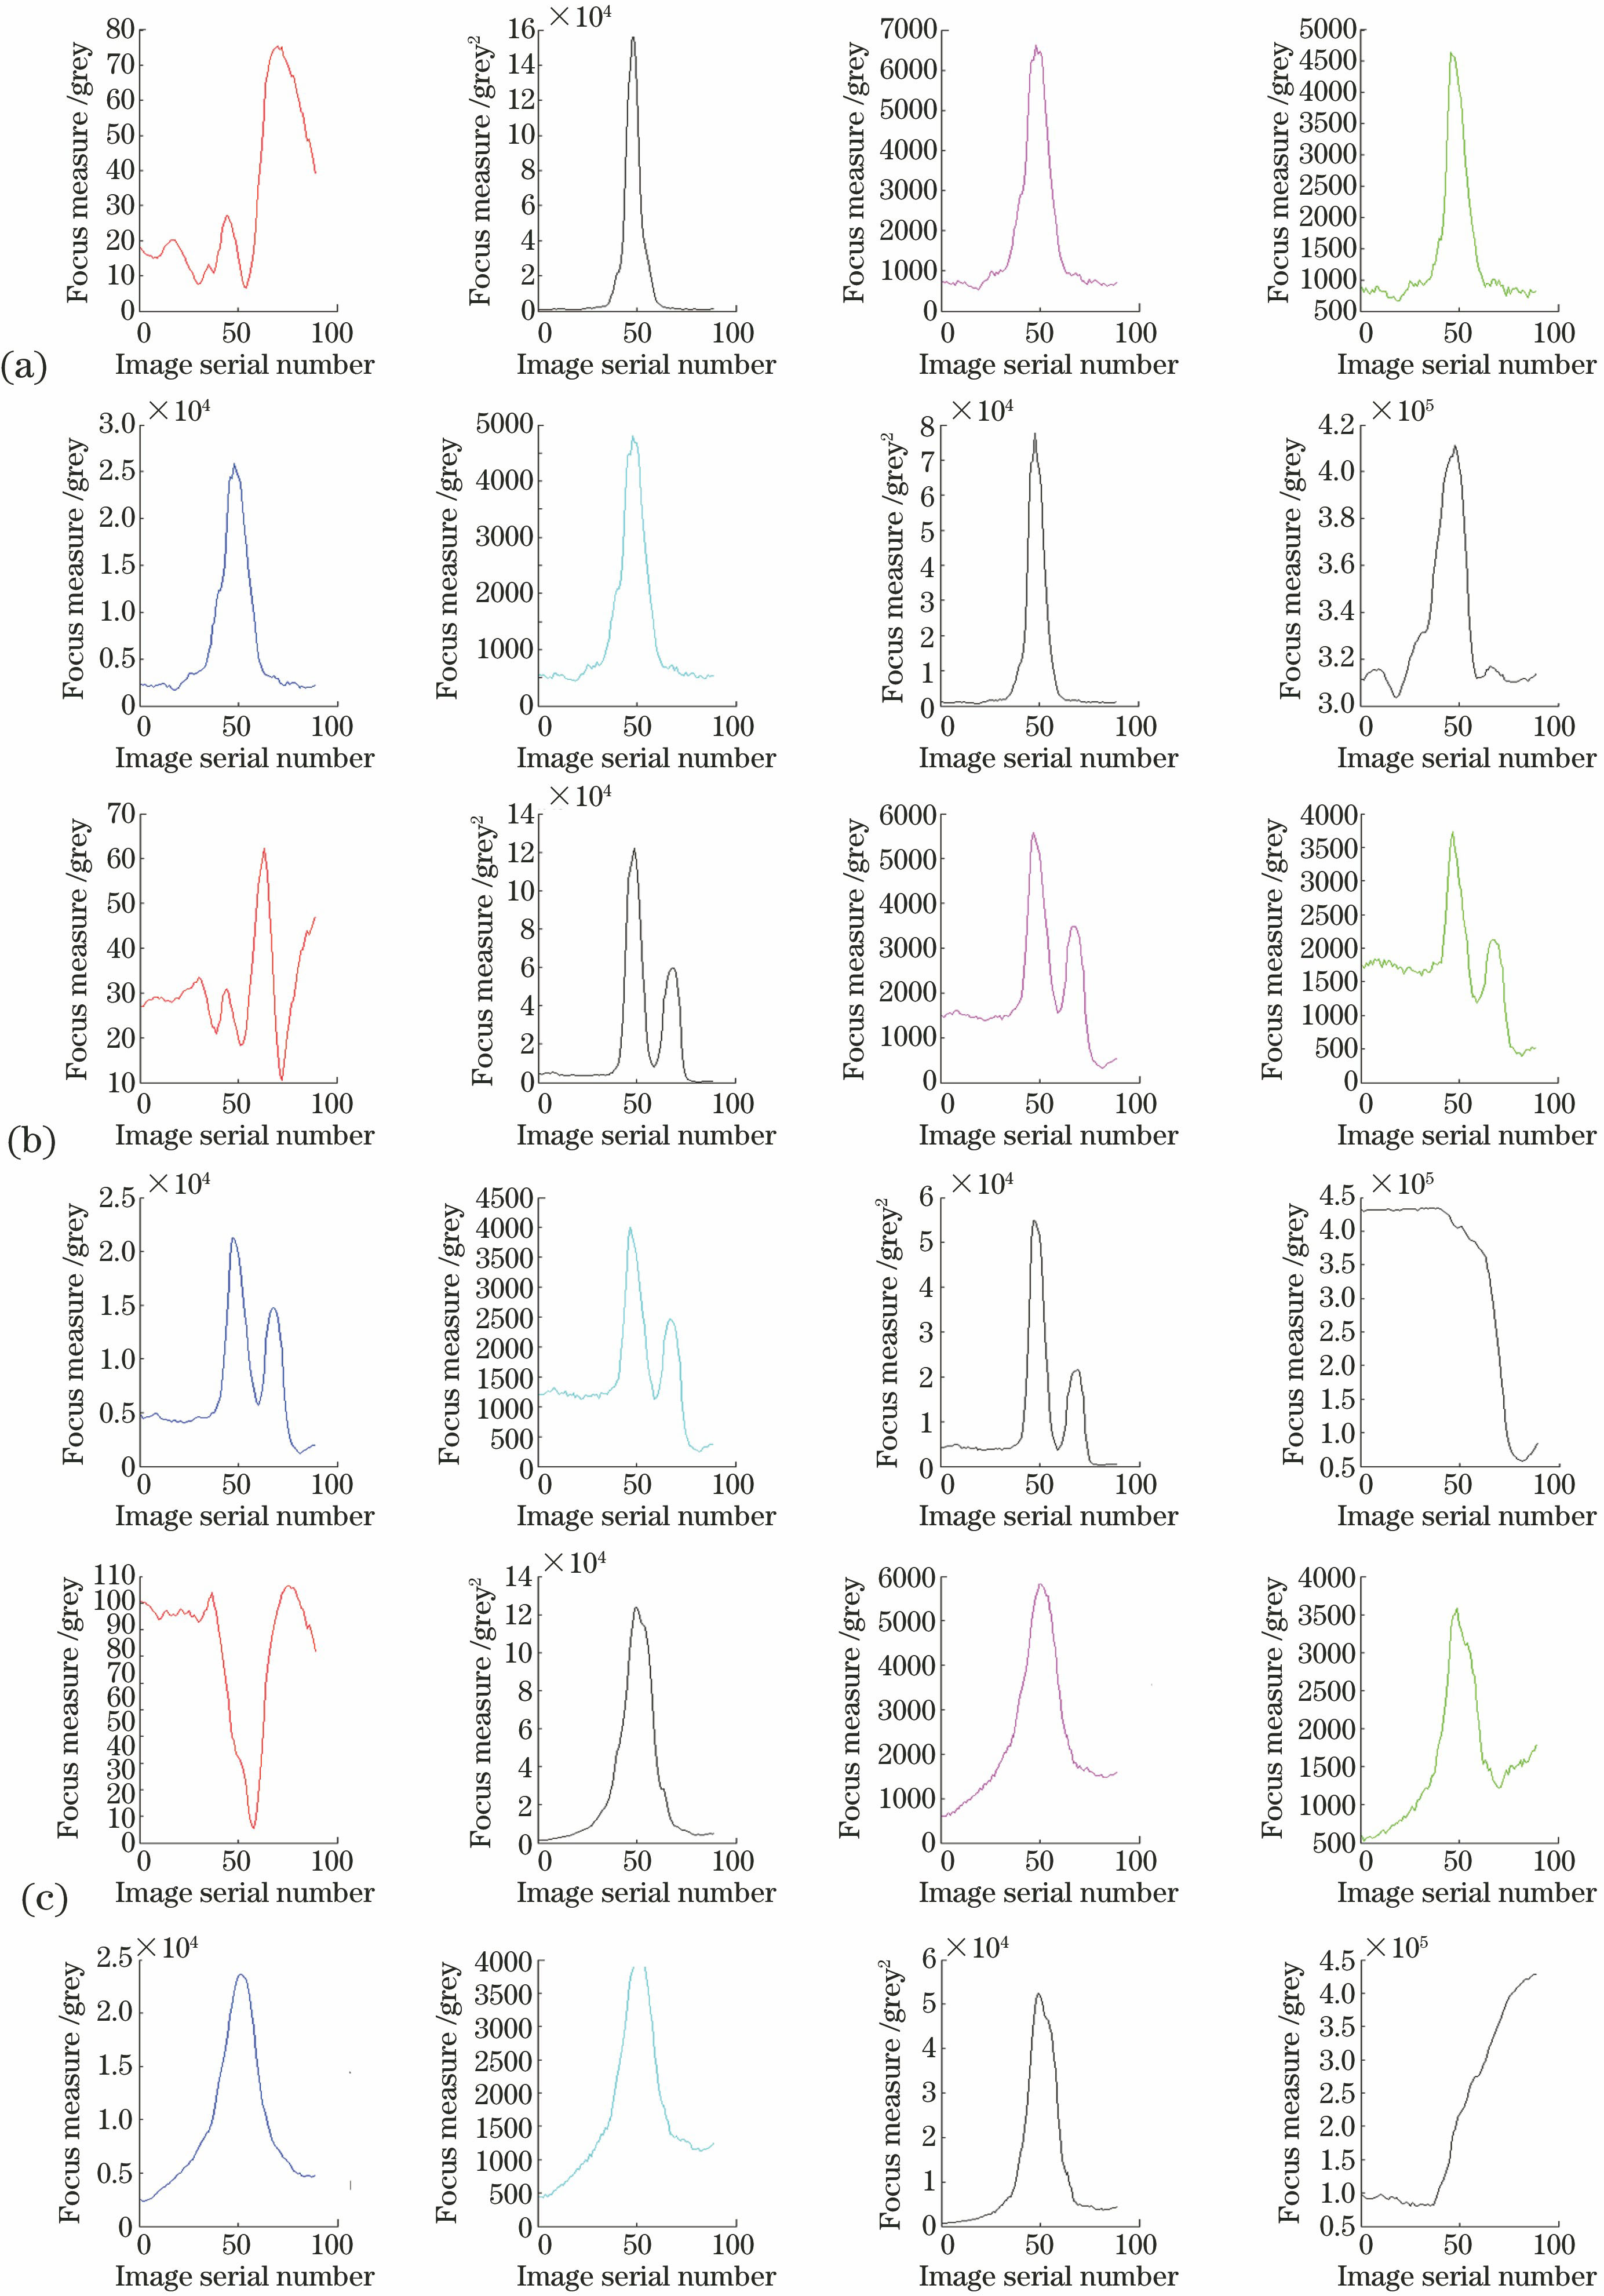
图 4. 利用单点和邻域信息,不同算子时得到的聚焦曲线图。(a) Brenner算子;(b) Roberts算子;(c) Laplace算子;(d) Tenengrad算子;(e) SMD算子;(f)梯度平方;(g)八方向Sobel算子
Fig. 4. Focus curves obtained from single point information and neighborhood information with different operators. (a) Brenner operator; (b) Roberts operator; (c) Laplace operator; (d) Tenengrad operator; (e) SMD operator; (f) gradient square; (g) Sobel operator in eight directions
下载图片 查看原文
图 5. 利用不同大小的邻域得到的聚焦散点图。(a) 5;(b) 9;(c)13;(d) 17
Fig. 5. Focus scatter plots with different sizes of neighborhood. (a) 5; (b) 9; (c)13; (d) 17
下载图片 查看原文
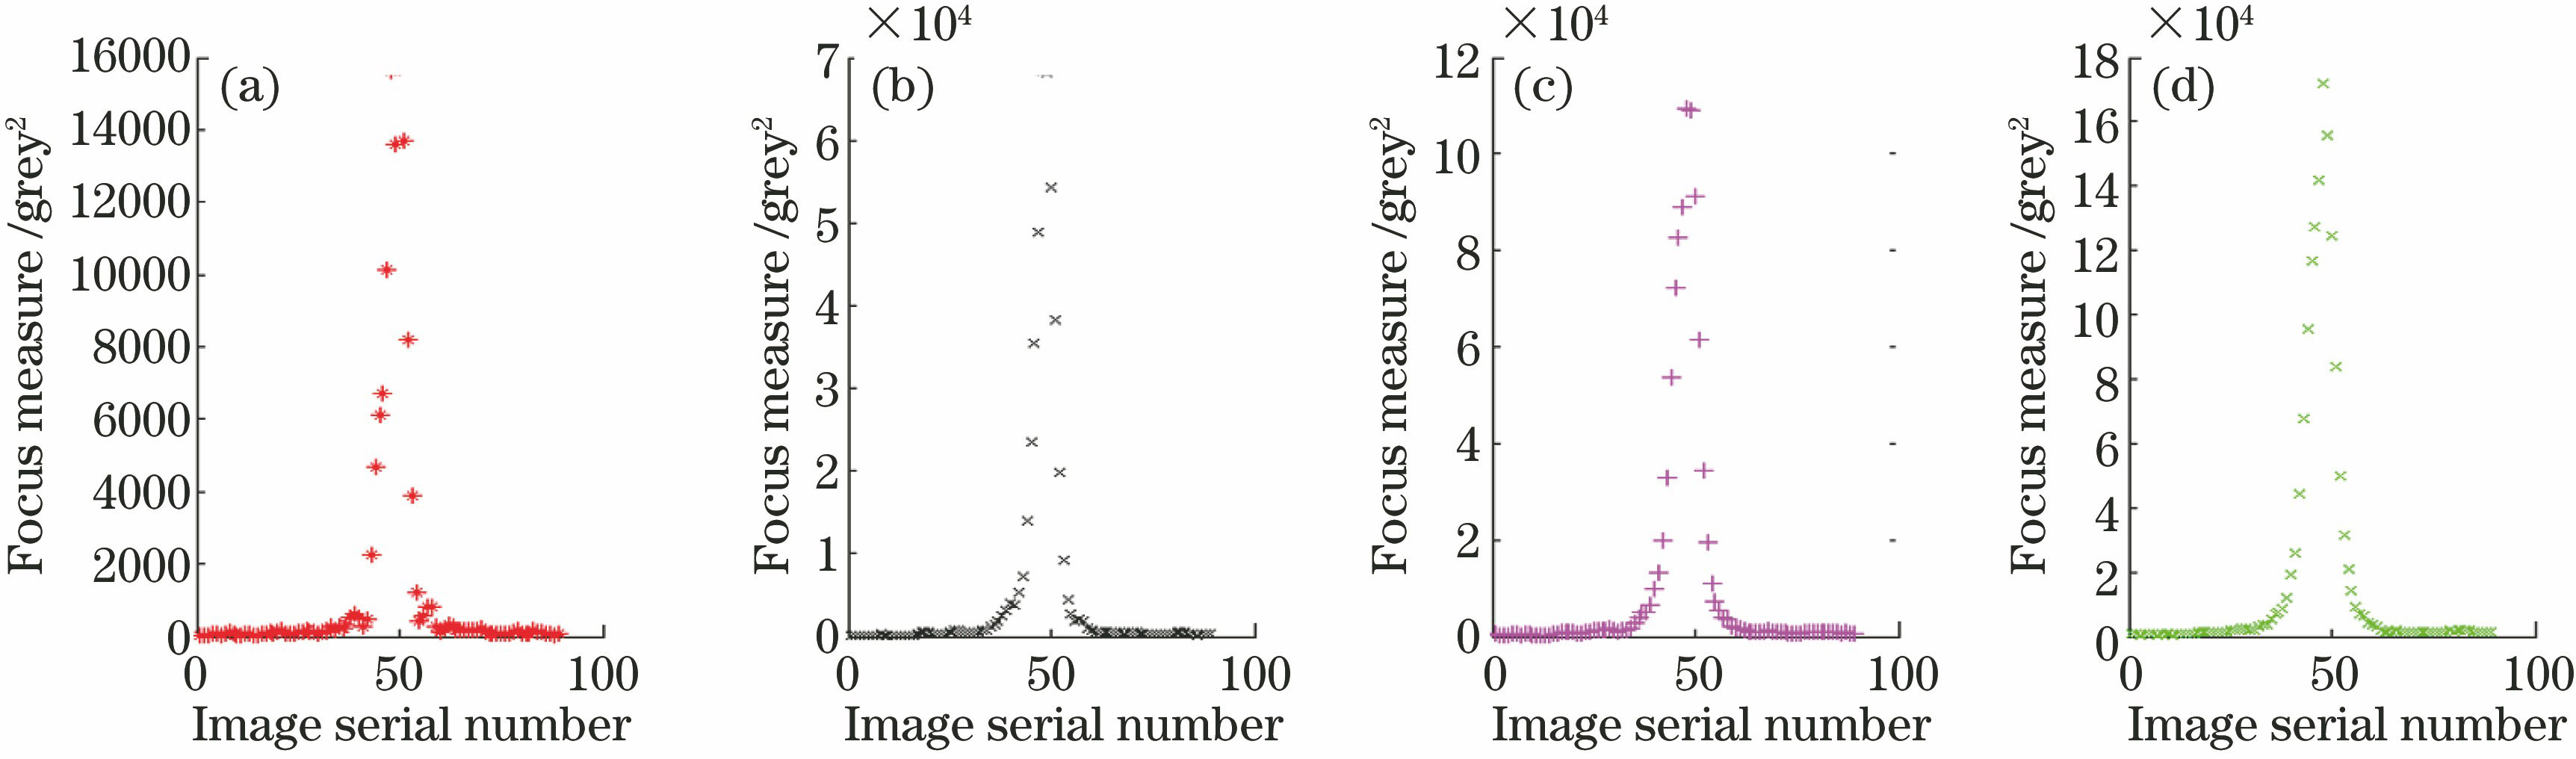
图 6. 不同亮度点的聚焦评价结果。(a) (380,280);(b) (700,390);(c) (608,218)
Fig. 6. Focusing evaluation results of points with different brightness. (a) (380,280); (b) (700,390); (c) (608,218)
下载图片 查看原文
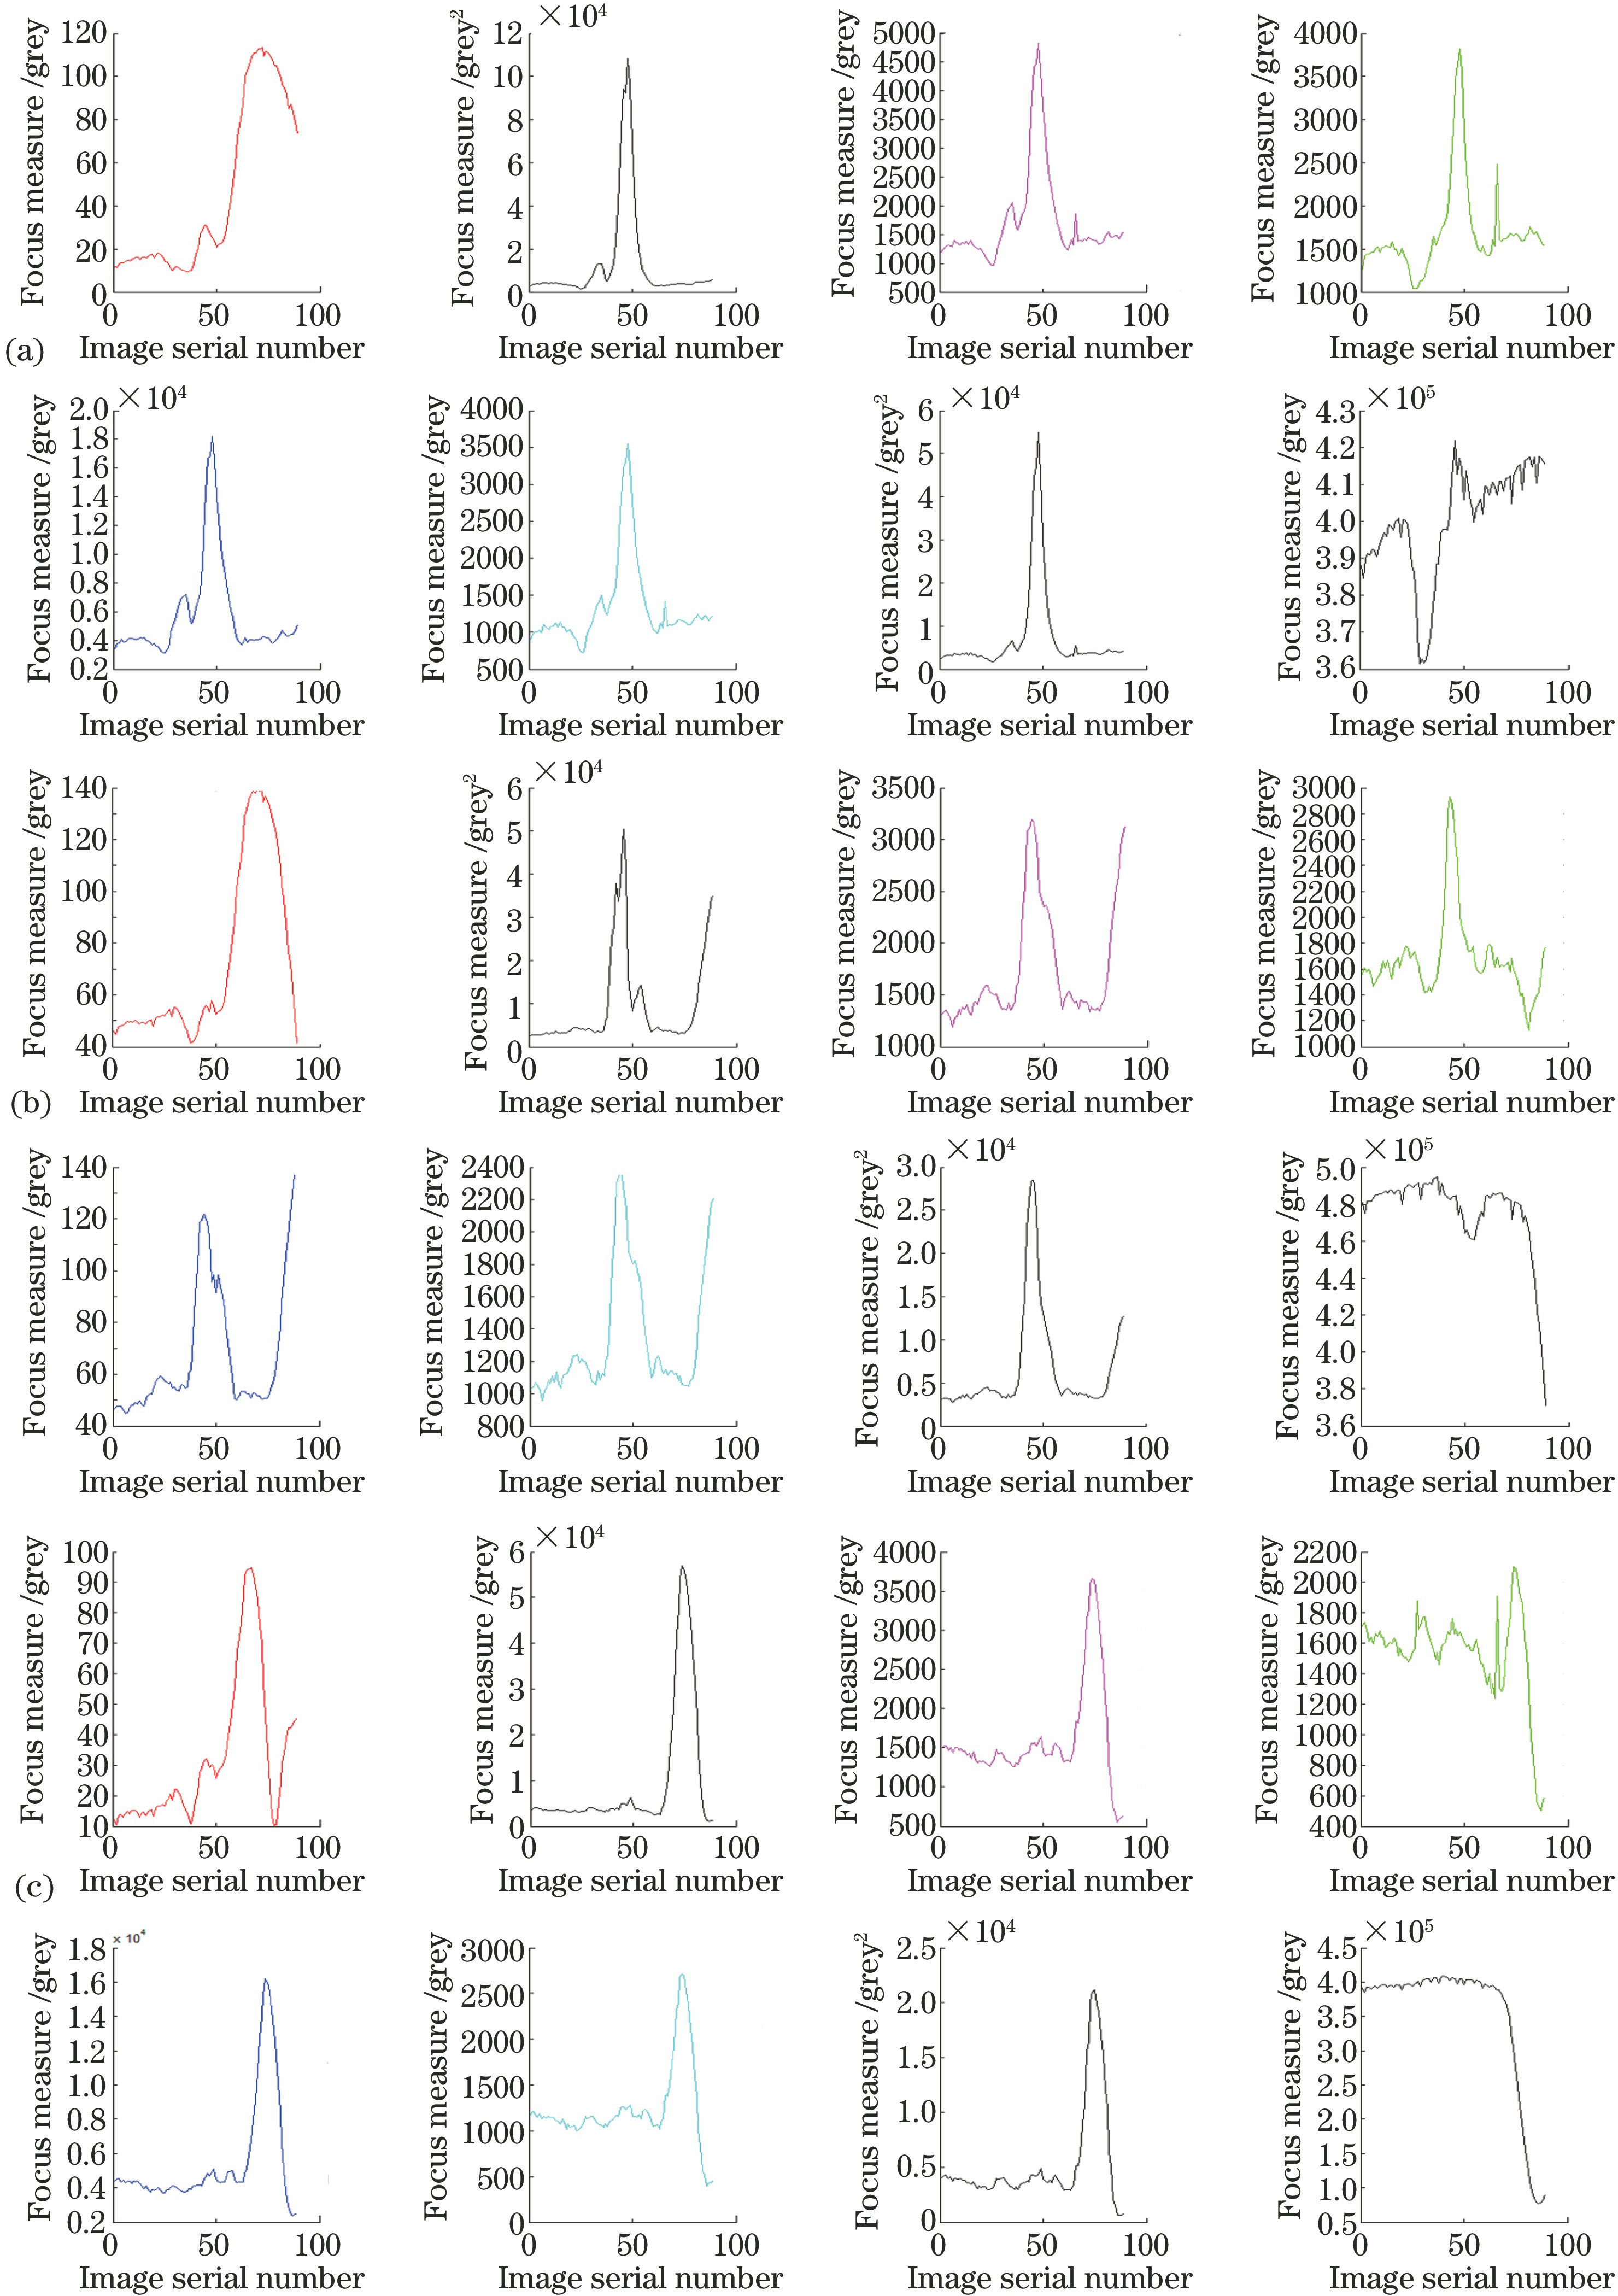
图 7. 三个较亮点的聚焦评价结果。(a) (765,115);(b) (363,1095);(c) (829,68)
Fig. 7. Focusing evaluation results of three brighter points. (a) (765,115); (b) (363,1095); (c) (829,68)
下载图片 查看原文
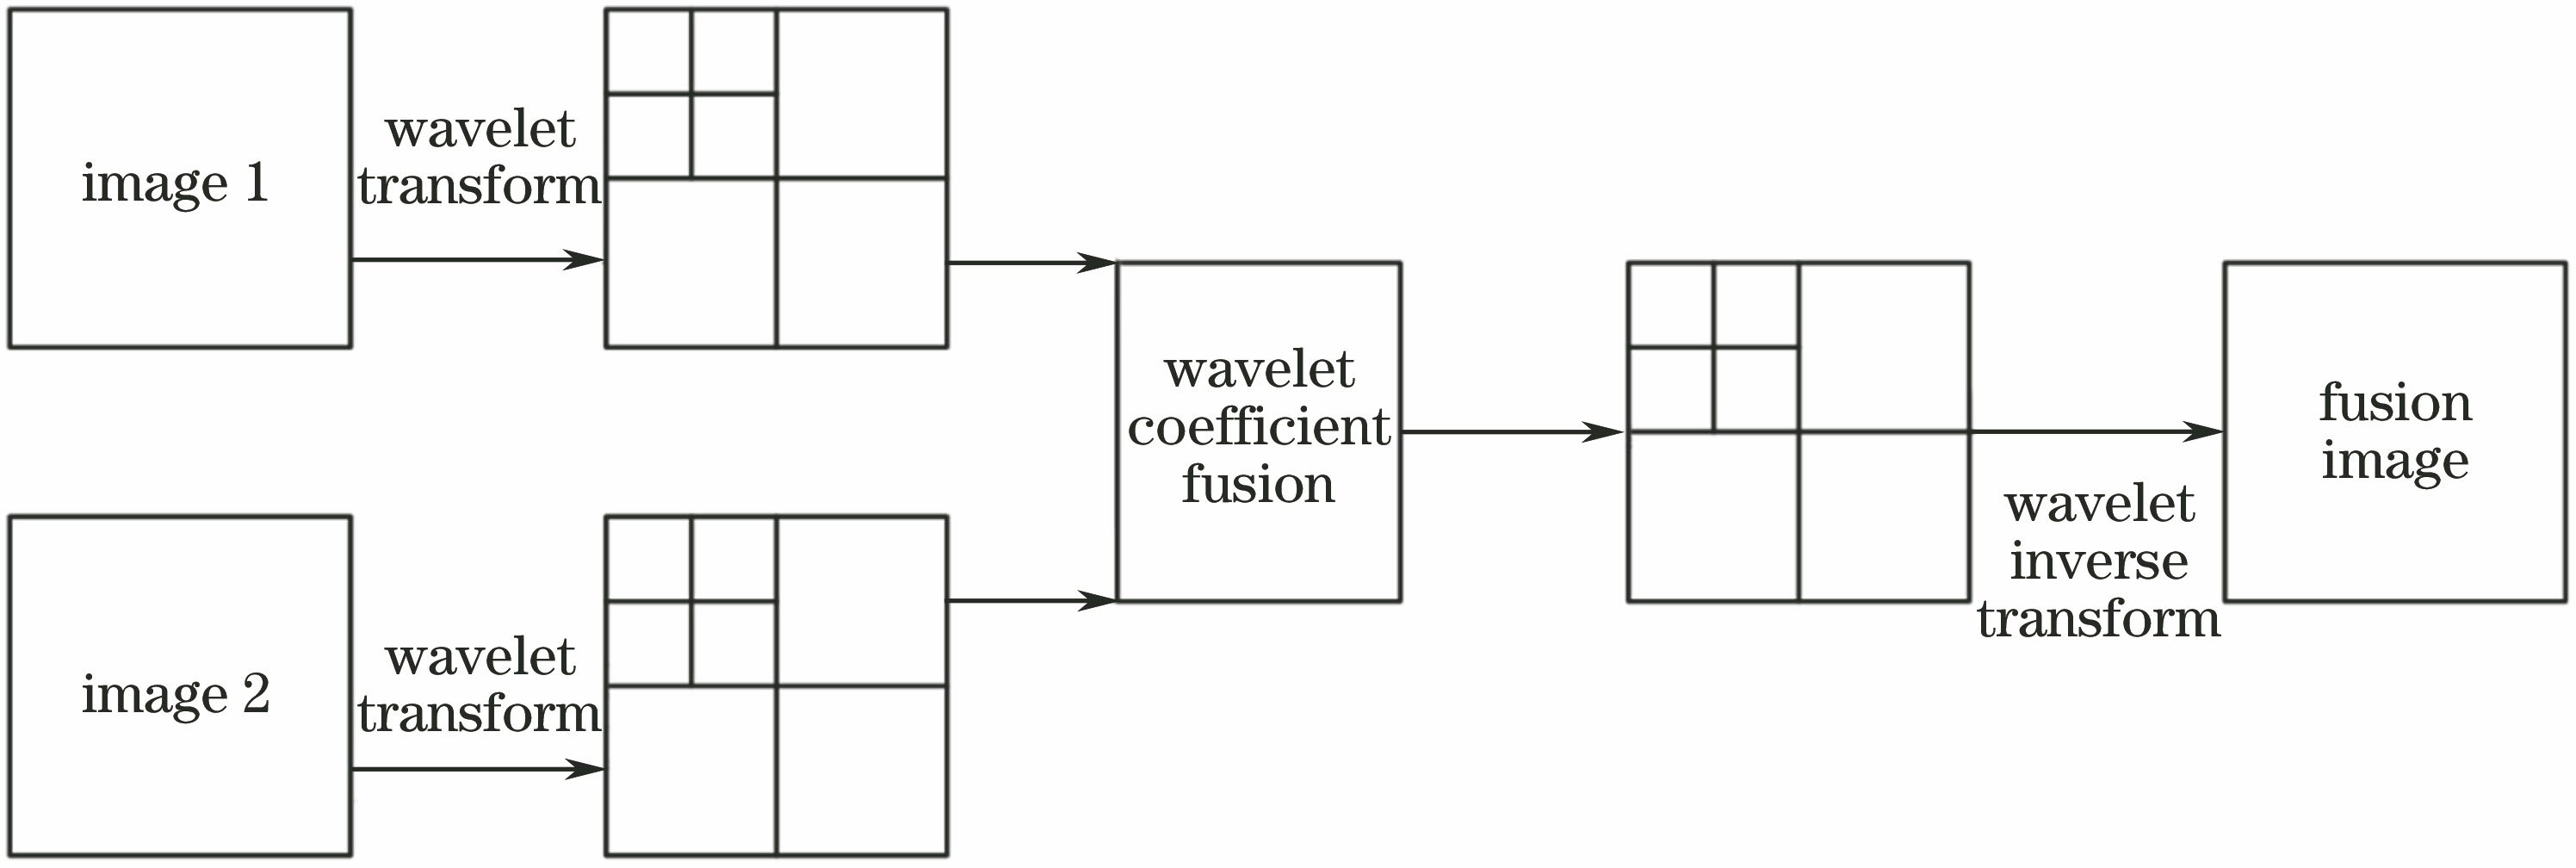
图 8. 小波融合方法示意图
Fig. 8. Schematic of wavelet fusion method
下载图片 查看原文
图 9. 图像融合结果比较。(a)空域区域特征图像融合;(b)频域小波图像融合;(c)频域小波彩色图像融合
Fig. 9. Comparison of image fusion results. (a) Image fusion based on spatial regional characteristics; (b) image fusion with frequency domain wavelet; (c) color image fusion with frequency domain wavelet
下载图片 查看原文
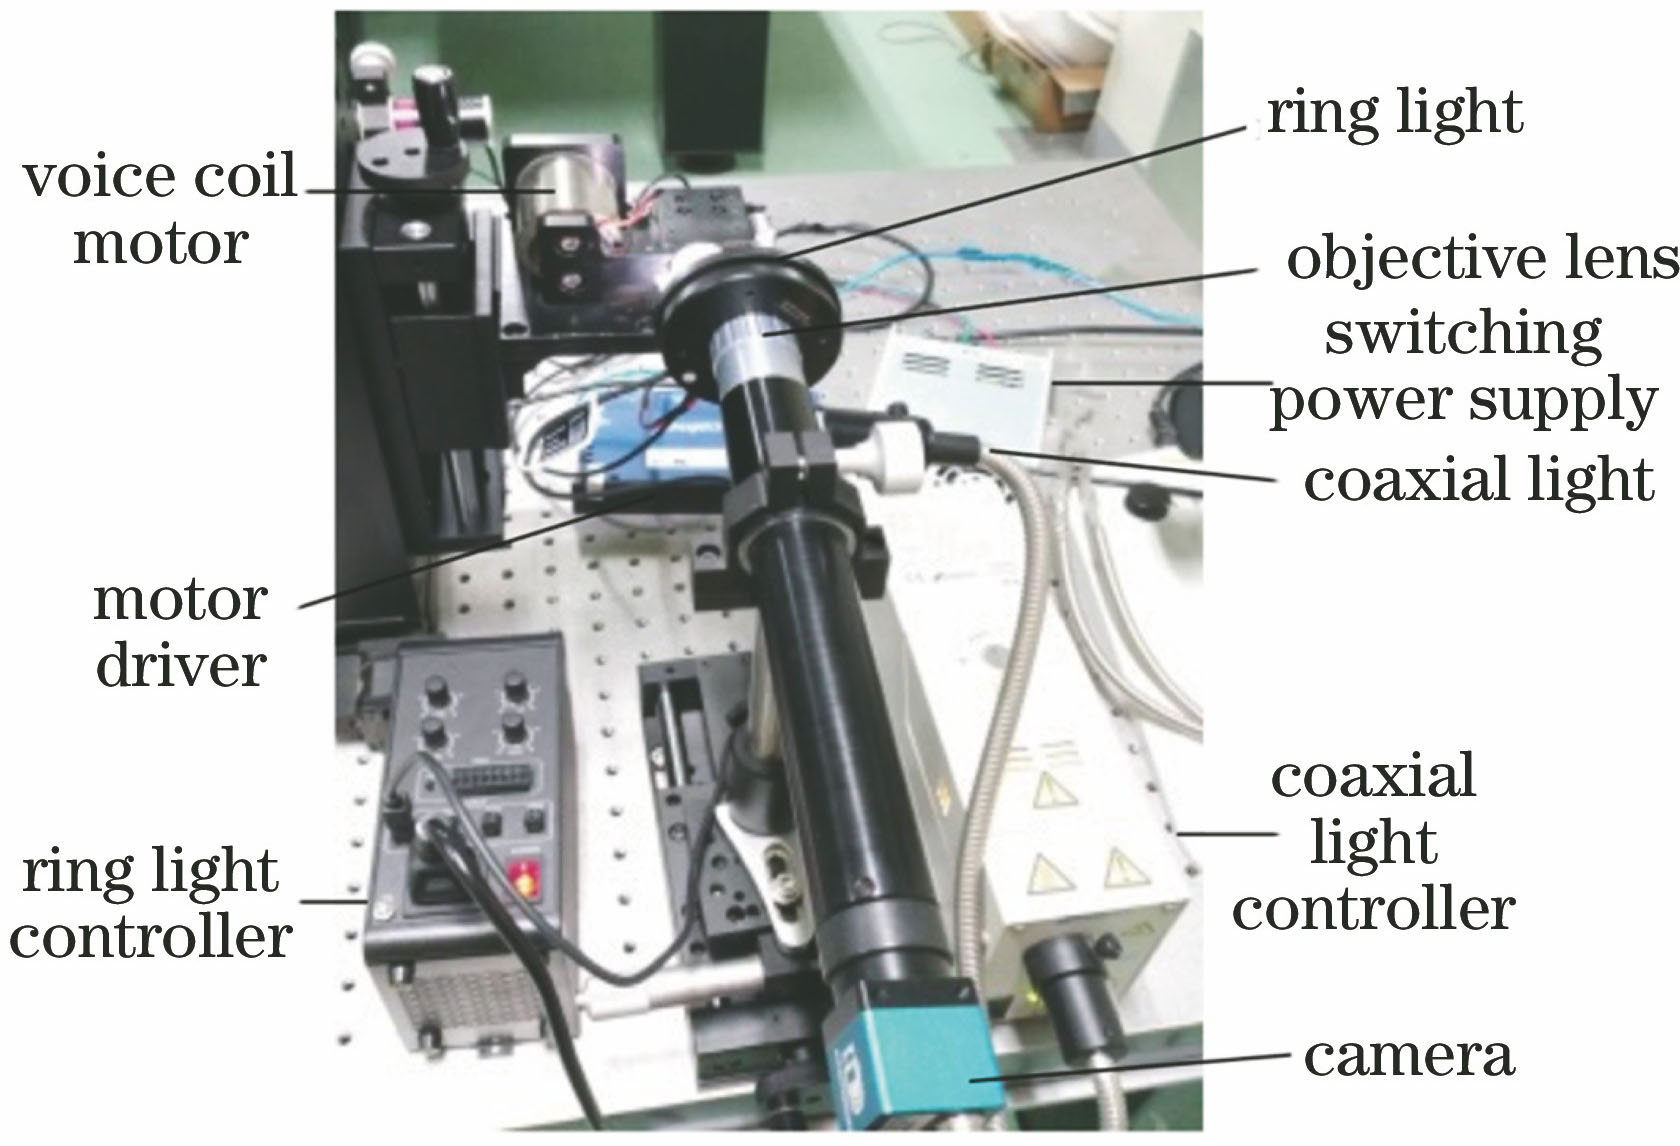
图 10. 实验系统
Fig. 10. Experimental system
下载图片 查看原文
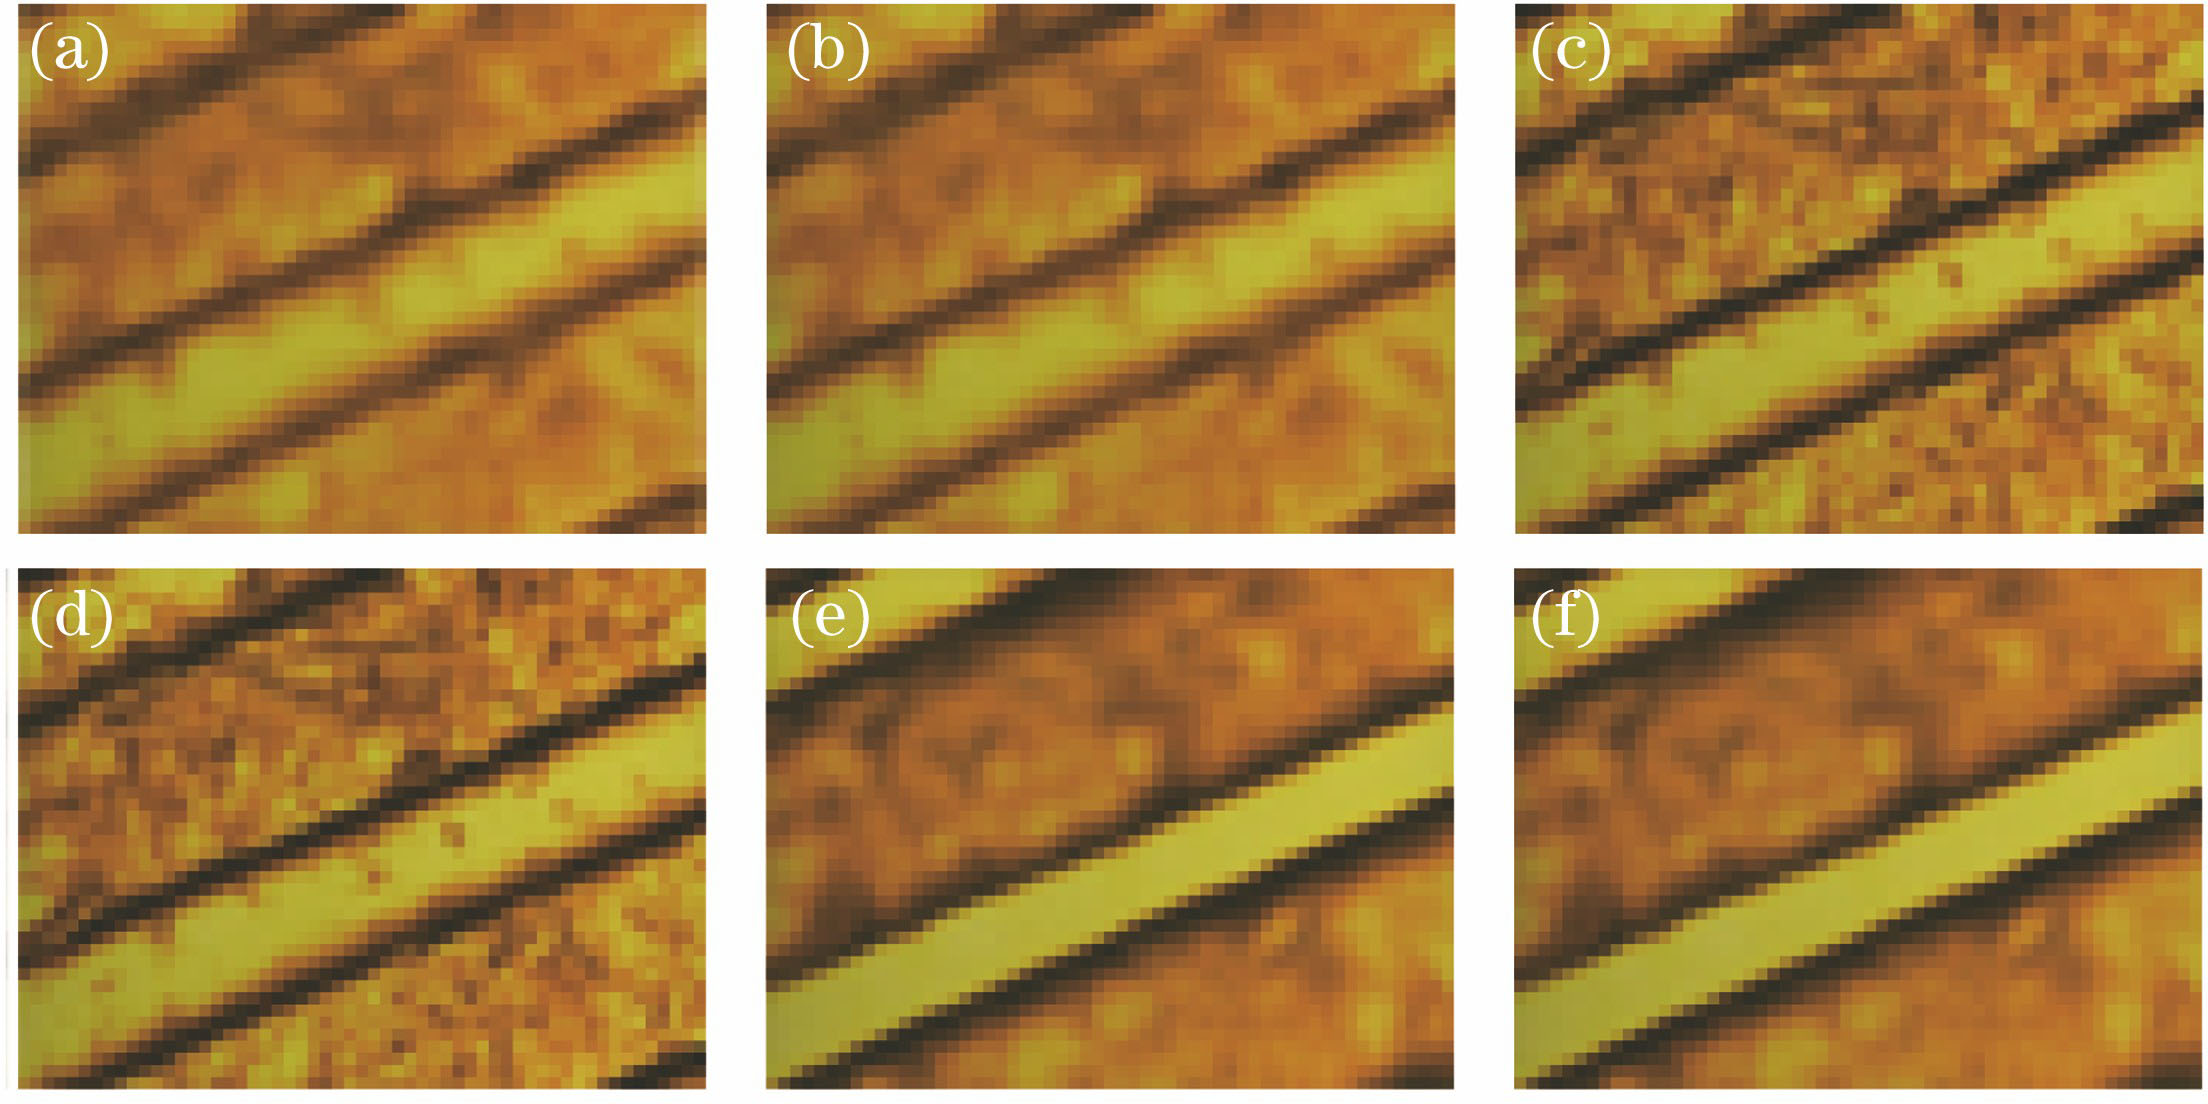
图 11. 硬币表面成像序列图。(a)第1张图;(b)第2张图;(c)第30张图;(d)第31张图;(e)第80张图;(f)第81张图
Fig. 11. Image sequence diagrams of coin surface. (a) 1st image; (b) 2nd image; (c) 30th image; (d) 31st image; (e) 80th image; (f) 81st image
下载图片 查看原文
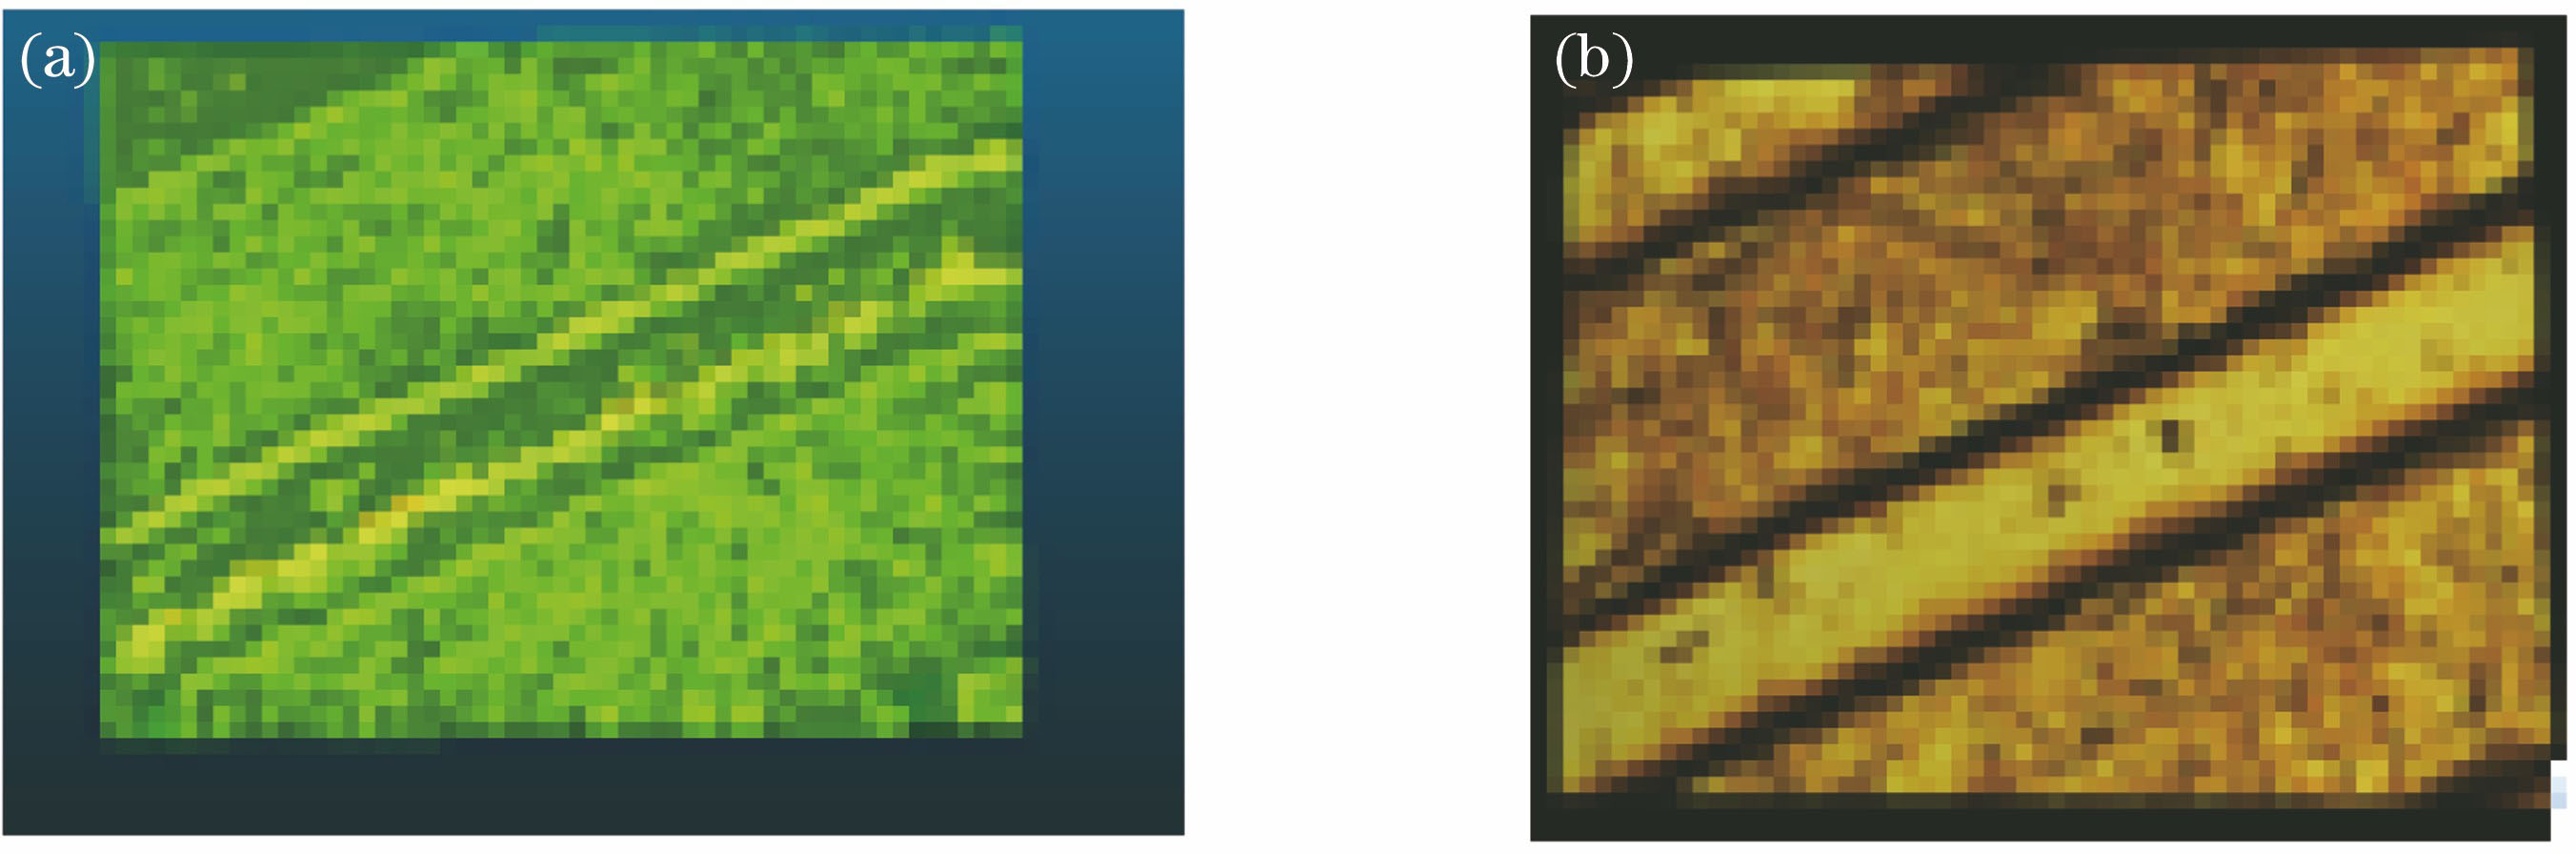
图 12. 硬币表面浮雕三维测量结果。(a)三维点云图;(b)彩色三维重构图
Fig. 12. 3D measurement results of coin surface relief. (a) 3D point cloud; (b) 3D color reconstruction image
下载图片 查看原文
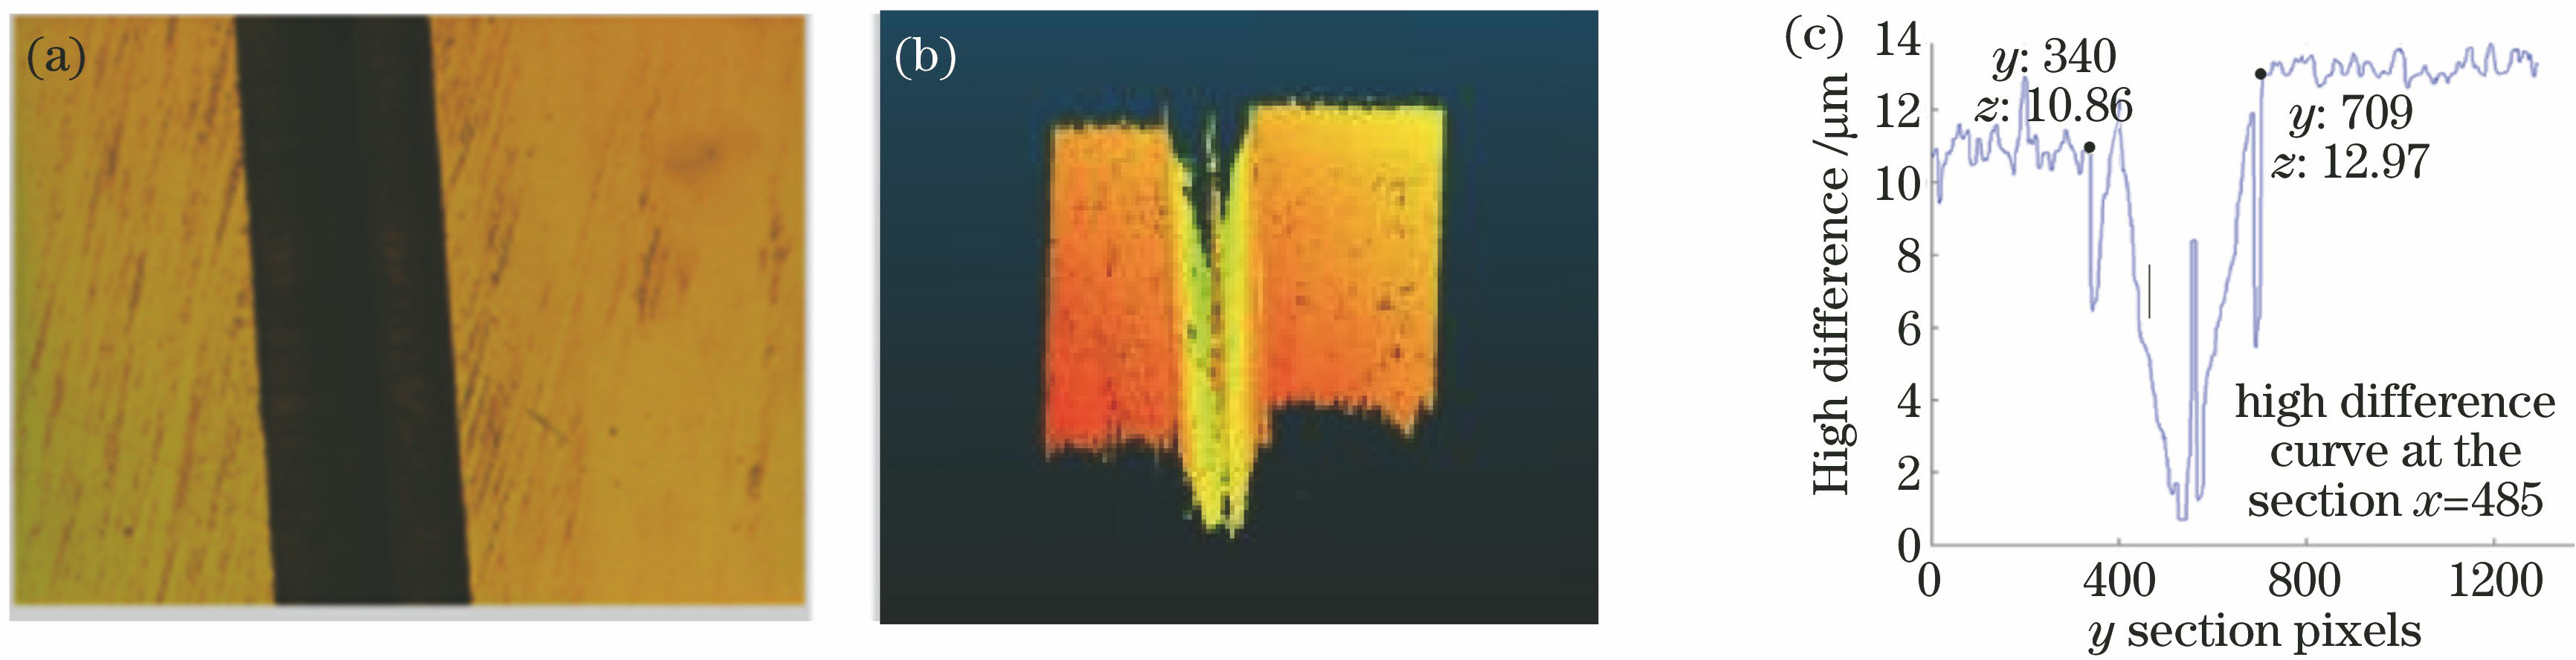
图 13. 标准台阶测量结果。(a)图像序列中的一幅图像;(b)三维点云数据;(c)某一截面的点云分布
Fig. 13. A gauge step measurement result. (a) One of images in image sequence; (b) 3D point cloud data; (c) point cloud distribution of a section
下载图片 查看原文
表 1采用单点和邻域信息进行聚焦评价每幅图像消耗的时间
Table1. Time consumed per image during focus evaluation by using single point and neighborhood information
| Operator | Time /s |
|---|
| Single point | Neighborhood |
|---|
| Brenner | 0.13 | 2.58 | | Roberts | 1.58 | 3.24 | | Laplace | 1.81 | 3.40 | | Tenengrad | 0.31 | 2.70 | | SMD | 0.16 | 2.58 | | Gradient square | 0.16 | 2.59 | | Sobel operator in eight directions | 10.8 | 14.12 |
|
查看原文
表 2采用不同大小的邻域进行聚焦评价每幅图像消耗的时间
Table2. Time consumed per image during focus evaluation with different sizes of neighborhood
| Neighborhood size /pixel | Time /s |
|---|
| 5 | 2.31 | | 9 | 2.37 | | 13 | 2.44 | | 17 | 2.57 |
|
查看原文
表 3多种极值搜索方法得到结果的比较
Table3. Comparison of results obtained by different extremum searching methods
| Pointcoordinates | Traversalsearch | Two polynomialfitting | Gaussianfitting | Maximum valuequadratic fitting | Maximum valueGaussian fitting | Maximum valueRANSAC |
|---|
| (380,280) | 48 | 46.29 | 47.86 | 48.23 | 48.40 | 48.10 | | (700,390) | 49 | 49.50 | 48.47 | 48.93 | 48.89 | 48.93 | | (608,218) | 50 | 47.52 | 50.83 | 49.59 | 49.52 | 49.33 | | (363,1095) | 46 | 83.67 | 44.48 | 45.77 | 45.59 | 45.79 | | (829,68) | 74 | 9.78 | 23.85 | 74.23 | 74.42 | 74.26 |
|
查看原文
史艳琼, 尹秋霞, 卢荣胜. 变焦显微成像三维测量算法性能分析[J]. 激光与光电子学进展, 2019, 56(7): 071202. Yanqiong Shi, Qiuxia Ying, Rongsheng Lu. Performance Analysis of Three-Dimensional Measurement Algorithm with Focus Variation Microscopic Imaging[J]. Laser & Optoelectronics Progress, 2019, 56(7): 071202.


 PDF全文
PDF全文

