Chinese Optics Letters, 2019, 17 (6): 061101, Published Online: Jun. 5, 2019   

Telescope alignment based on the sharpness function of under-sampled images Download: 879次

Min Li 1,2,3Xin Liu 2Ang Zhang 1,2,*Hao Xian 1,2,**
Author Affiliations
1 Key Laboratory of Adaptive Optics, Chinese Academy of Sciences, Chengdu 610209, China
2 Institute of Optics and Electronics, Chinese Academy of Sciences, Chengdu 610209, China
3 University of Chinese Academy of Sciences, Beijing 100049, China
Abstract
The precise alignment of a high-performance telescope is a key factor to ensure the imaging quality. However, for telescopes with a wide field of view, the images are sometimes under-sampled. To study the effects of under-sampled images on the precision of telescope alignment, numerical simulations are implemented with the stochastic parallel gradient descent algorithm. The results show that the alignment program can converge stably and quickly. However, with the reduction of the full width at half-maximum of images, the relative residual errors increase from 9.5% to 19.5%, and the wavefront errors raise from 0.0972λ to 0.1074λ, indicating that the accuracy of the alignment decreases.

The alignment of telescopes is essential for their optimal performance[1]. For those with a small field of view (FOV) and undemanding image quality, one can correct only the on-axis field to achieve the best working state of telescopes, ignoring the effects of aberrations in the off-axis fields. But for telescopes with a wide FOV and a high requirement for image quality, when the on-axis field is aligned, the aberrations in the off-axis fields may be increased, such as coma and astigmatism[2]. As a result, the aberrations in both the on-axis and off-axis fields should be corrected.

There are many approaches for telescope alignment. All these methods can be classified into three categories. One is the direct wavefront sensor method (WFS)[3,4], which is most commonly used in the alignment of telescopes, such as the sensitive table method[5] and Shack–Hartmann wavefront sensor method[6]. This kind of method requires additional optical elements to measure the wavefront errors, increasing the complexity of optical systems. The second method is the image-based wavefront sensor method, for example, the phase retrieval (PR) method[7] and phase diversity (PD) method[8]. Compared with the WFS method, this kind of method only requires one or more detectors, without adding other optical components. However, it does entail more computation to estimate the wavefront errors. The third one is the image-based sharpness function method[9], which maximizes the sharpness function of images using an optimization algorithm to correct the misalignments. Compared with the other two kinds of approaches, this method only requires one detector placed in the focal plane to measure the sharpness of the images in real time, and the misalignments are corrected with the optimization algorithm. For the advantages of concise measurement systems and simple calculations, this method has been successfully used by Yang et al.[10] and Zhou et al.[11] to correct wavefront errors. In this Letter, we also use the sharpness function method to align the telescopes with a wide FOV. There are many sharpness functions that are commonly used for specific applications, such as the entire light intensity, partial intensity, and Strehl ratio. In this Letter, the root mean square radius (RMS) of images is employed as the merit function.

However, in imaging systems, especially for telescopes with a wide FOV, under-sampled images are common; nowhere is this problem more acute than on the Hubble Space Telescope (HST)[12]. Imperfect optics, finite detector arrays, and finite individual detector sizes all contribute to the non-ideal sampling of the scene information to meet the Nyquist criterion. The resulting images will be degraded by aliasing effects[13]. The under-sampled images addressed in this Letter are caused by finite individual detector sizes. The information missing from under-sampled images makes it difficult to detect faint sources and accurately represent the aberrations of spots. In the past few years, some research has been proposed[14,15]. All these methods are based on image reconstruction[16] to restore the information lost in under-sampled images. However, few efforts have been made to study the effects of under-sampled images on the accuracy of telescope alignment. This Letter focuses on this issue. The telescope is aligned using a stochastic parallel gradient descent (SPGD)[17] algorithm combined with the sharpness function of different sampling images. According to the Nyquist sampling condition, the largest sampling interval of detectors should be equal to or smaller than the optical cutoff period of the imaging system. Otherwise, the image will be under-sampled and aliasing will appear. Assuming the width of a CCD pixel is a (in μm), the minimum sampling frequency is calculated by the diagonal of the pixel, so the sampling frequency of the CCD is vs=1000a2lp/mmvN=vs2=500a2lp/mm,where vN represents the Nyquist frequency. According to the Rayleigh criterion, the resolution of a telescope with a circular aperture is defined as δ2=1.22λDftelescope=1.22λF#,where δ is diameter of the Airy disk, λ is the central wavelength of the optical system, D is the aperture of the telescope, ftelescope is the focal length, and F# is F number. The maximum spatial frequency of the telescope is vmax=2δ=11.22λF#.

According to the Nyquist sampling condition, the spatial frequency of the telescope imaging system should be equal to or smaller than half the detector spatial frequency: vmaxvs/2δ42a.

Equation (4) means the diameter of the telescope spots should be larger than 4 pixels, otherwise the spots will be under-sampled.

In this Letter, both well-sampled and under-sampled images are simulated to correct the misalignments. The under-sampled images with various under-sampling factors are simulated by the down-sampling method. The larger the under-sampling factors are, the smaller the diameter of the images will be. The diameters of the images are calculated by the full width at half-maximum (FWHM). If the FWHM of the image is smaller than 4 pixels, it is an under-sampled image. The telescope used in this Letter is a Cassegrain system with a full FOV of 0.7° and a central wavelength of 0.65 μm. The other parameters are shown in Table 1.

Table 1. Parameters of the Cassegrain Telescope System

SurfaceSemidiameter (mm)Radius (mm)Thickness (mm)Conic
PM880540022921
SM142.993818071.688

查看所有表

Table 1 shows that the primary mirror (PM) of the Cassegrain telescope was a parabolic reflector with a conic of 1, semidiameter of 880 mm, and radius of 5400mm. The distance between the primary and secondary mirror was 2292mm. The secondary mirror (SM) was a hyperbolic reflector with a conic of 1.688, semidiameter of 142.9 mm, and radius of 938mm. There are some other optical elements used to correct the field curvature. The telescope system is shown in Fig. 1.

Fig. 1. Cassegrain telescope system.

下载图片 查看所有图片

For a Cassegrain telescope, the spherical aberration is corrected. However, the coma term grows quickly when the FOV is far away from the optical axis. As a result, aberrations in both the on-axis and off-axis fields should be corrected. In this Letter, the telescope is aligned based on three fields of images, including the on-axis field, which is also called 0field and two off-axis fields. The normalized field point coordinates were 0field (0°, 0°), 0.8field (0°, 0.28°), and 1field (0.35°, 0°).

For large aperture telescope systems, we set the primary mirror as a reference that is being fixed in place. The misalignments of the secondary mirror related to the primary mirror consist of six degrees of freedom, including decentration along the x, y, z axes and tilt/tip about three axes. The rotation about the z axis, which is also the optical axis, has no effect on the quality of images, so it is usually ignored. As a result, the secondary mirror has five degrees of freedom related to the primary mirror, including decentration along the z axis (Dz), decentration along the x and y axes (Dx,Dy), and tilt about the x and y axes (Tx,Ty). To verify the effect of the alignment method, large misalignment errors were given. The misalignments corresponding to five degrees of freedom are shown in Table 2.

Table 2. Misalignment Errors of the Secondary Mirror

Dx (μm)Dy (μm)Dz (μm)Tx (°)Ty (°)
600880800.10.03

查看所有表

The decentrations along the x axis (Dx) and y axis (Dy) are 600 μm and 880 μm, respectively. The decentration along the z axis (Dz) is 80 μm. The tilts about the x (Tx) and y (Ty) axes are 0.1° and 0.03°, respectively.

In this Letter, the telescope system is aligned using the SPGD algorithm, which is a model-free iteration control method. The iterative formula of the SPGD algorithm is[18]uk+1=ukγδJkδuk,where k is the number of iterations. u is the control variable, composed of five degrees of freedom of the secondary mirror. γ is the gain coefficient. δJ is the variation of merit function.

The sharpness function used in this Letter is the RMS of the images, defined as[19]J=(xx0)2+(yy0)2I(x,y)dxdyI(x,y)dxdy,where (x0,y0) is the centroid of the light intensity distribution, and (x, y) is the distribution coordinates of the CCD. I(x,y) is the light intensity on the pixel whose coordinate is (x, y) in the focal plane.

The alignment of the telescope can be divided into two parts. The first step is the on-axis field correction, in which the RMS of the far-field image is employed as the sharpness function to compensate the spherical aberrations. The second step is the all fields correction, including both the on-axis and off-axis fields to compensate the spherical aberrations, coma, and astigmatism simultaneously. In this part, the RMSs of both the on-axis and off-axis field images are calculated, and the average value of the RMSs is used as the sharpness function. The telescope alignment process based on the sharpness of images with the SPGD method is shown in Fig. 2.

Fig. 2. Process of telescope alignment.

下载图片 查看所有图片

The designed images corresponding to different fields that are obtained when the telescope is in designed working conditions and the misaligned images obtained in misaligned working conditions are shown as Fig. 3.
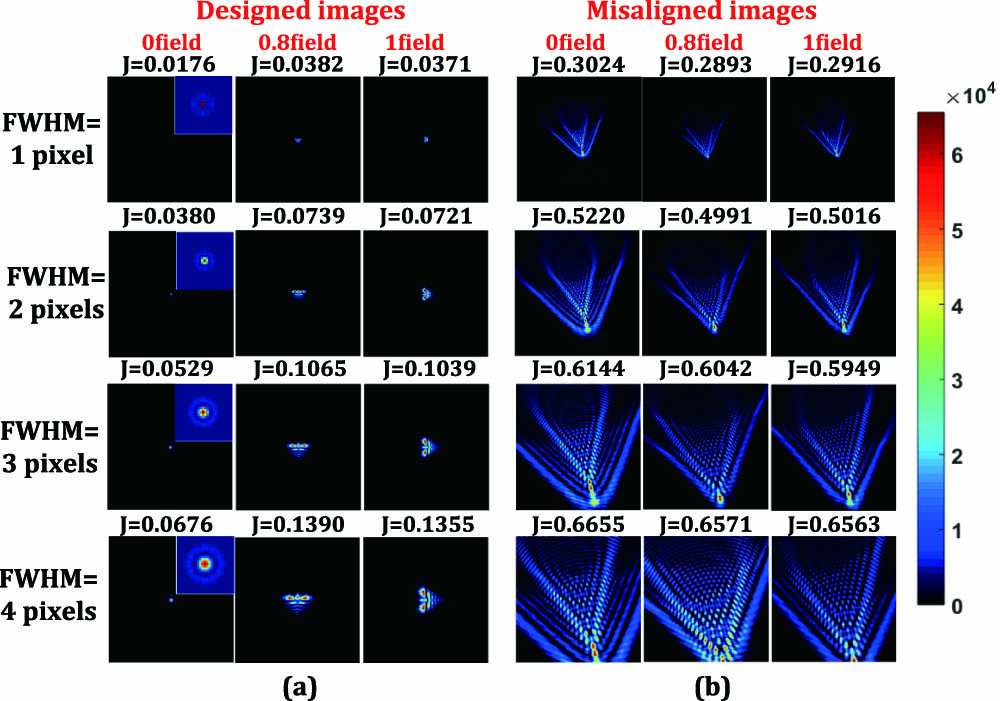
Fig. 3. Designed and misaligned images with different FWHMs. (a) Designed images. (b) Misaligned images.

下载图片 查看所有图片

Figure 3(a) shows designed images, the on-axis field of which is almost a perfect Airy spot, while the off-axis designed images carry a few aberrations, including coma and astigmatism. Figure 3(b) shows the misaligned images bringing large aberrations in both the on-axis and off-axis fields. J is the RMS of the image spots. We have known that when the FWHM is smaller than 4 pixels, the images are under-sampled. With the increase of FWHMs, the information carried by the images becomes richer and the size of the spots becomes larger, as do the RMSs of images. That is because all the images have the same size of 200pixels×200pixels. The more information the images bring, the larger the RMS will be. To analyze the aliasing effects of under-sampling, the spectra of the 0field designed images are calculated and shown in Fig. 4.

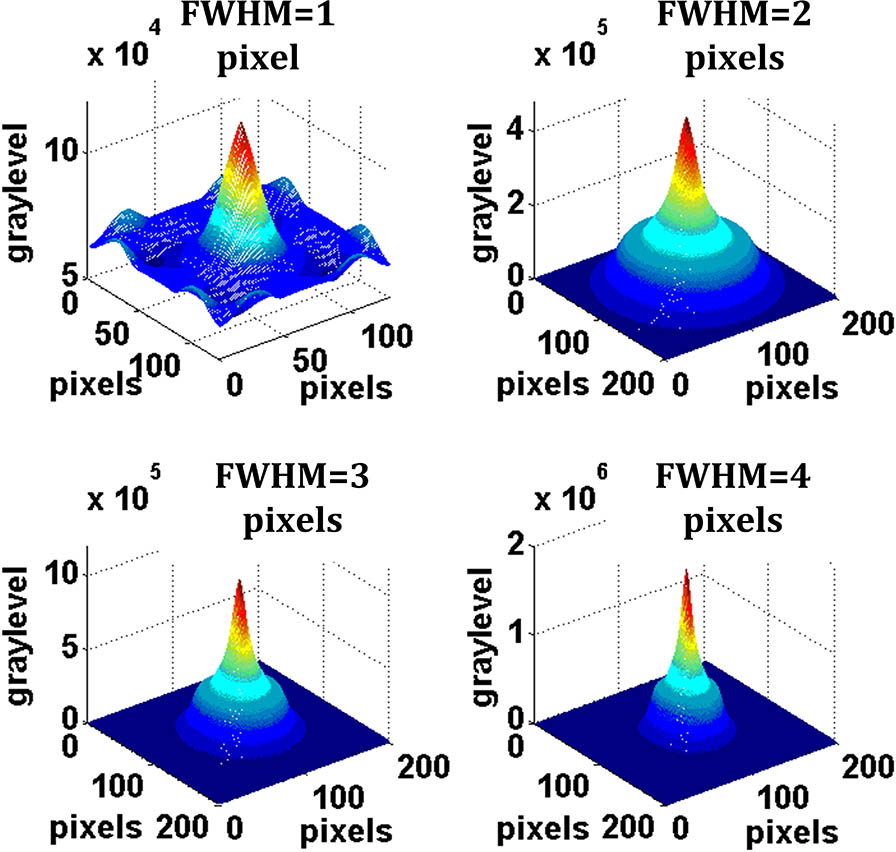
Fig. 4. Spectrum of the 0field designed image with FWHMs of 1, 2, 3, and 4 pixels.

下载图片 查看所有图片

Figure 4 shows the spectrum of the 0field designed images. We can see that with the decreases of FWHM, aliasing appears and becomes more serious. When the FWHM of the image is 1 pixel, the aliasing becomes more obvious with high frequency adding to the low frequency. In addition, the information is seriously lost and the images cannot display the aberrations accurately, which may decrease the accuracy of the alignment.

The telescope is aligned based on both the well-sampled and different under-sampled images. In the alignment processes, the step sizes are same with δu=[0.2mm,0.2mm,0.1mm,0.02°,0.02°], while the gain coefficients γ of the program are different for under-sampled and well-sampled images. For under-sampled images with FWHM as 1 and 2 pixels, the gain coefficient is 5, while for images with FWHM as 3 pixels, the gain coefficient is 3, and for images with FWHM as 4 pixels, the gain coefficient is 1. The iteration number is set as 200. The results of the alignment are shown in Fig. 5.
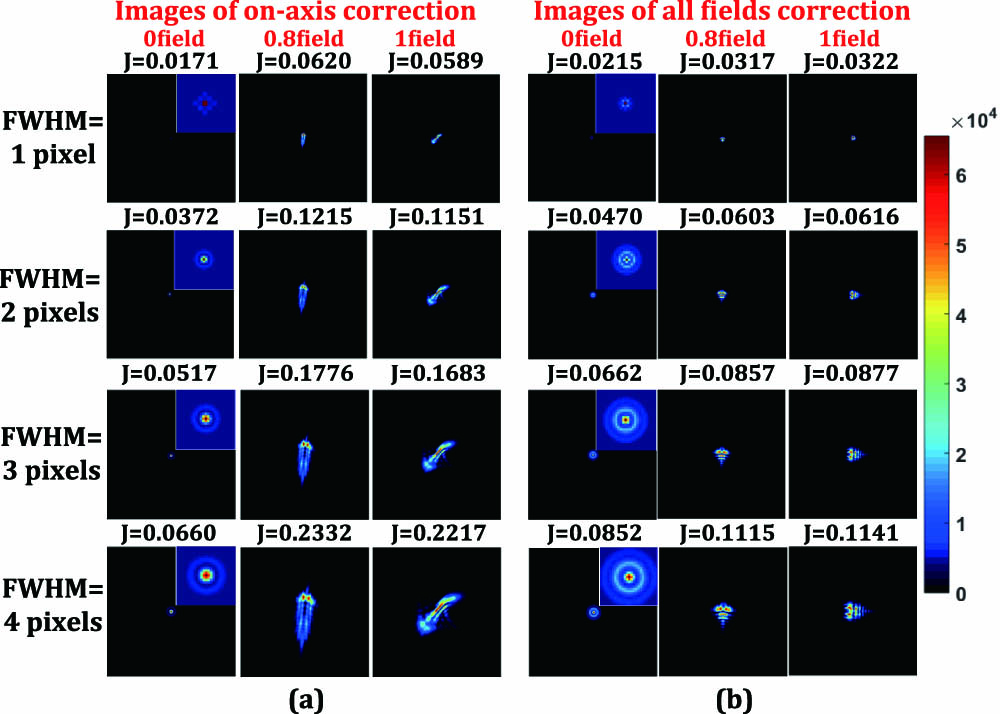
Fig. 5. Results of the telescope alignment. (a) Results of the on-axis correction. (b) Results of the all-fields correction.

下载图片 查看所有图片

According to Fig. 5, the images after correction have similar shapes even though the FWHMs of the spots are different. The images in the off-axis fields after on-axis correction still bring coma and astigmatism aberrations because when the on-axis aberrations are aligned the aberrations in the off-axis fields still exist. After the all fields correction, aberrations in both the on-axis and off-axis fields are well corrected, and the shapes of the images are similar with the designed ones. The 0 field images after correction are almost Airy disks, indicating that the misalignments are well corrected.

The changes of the RMS of the image spots during the correction process are shown in Fig. 6.
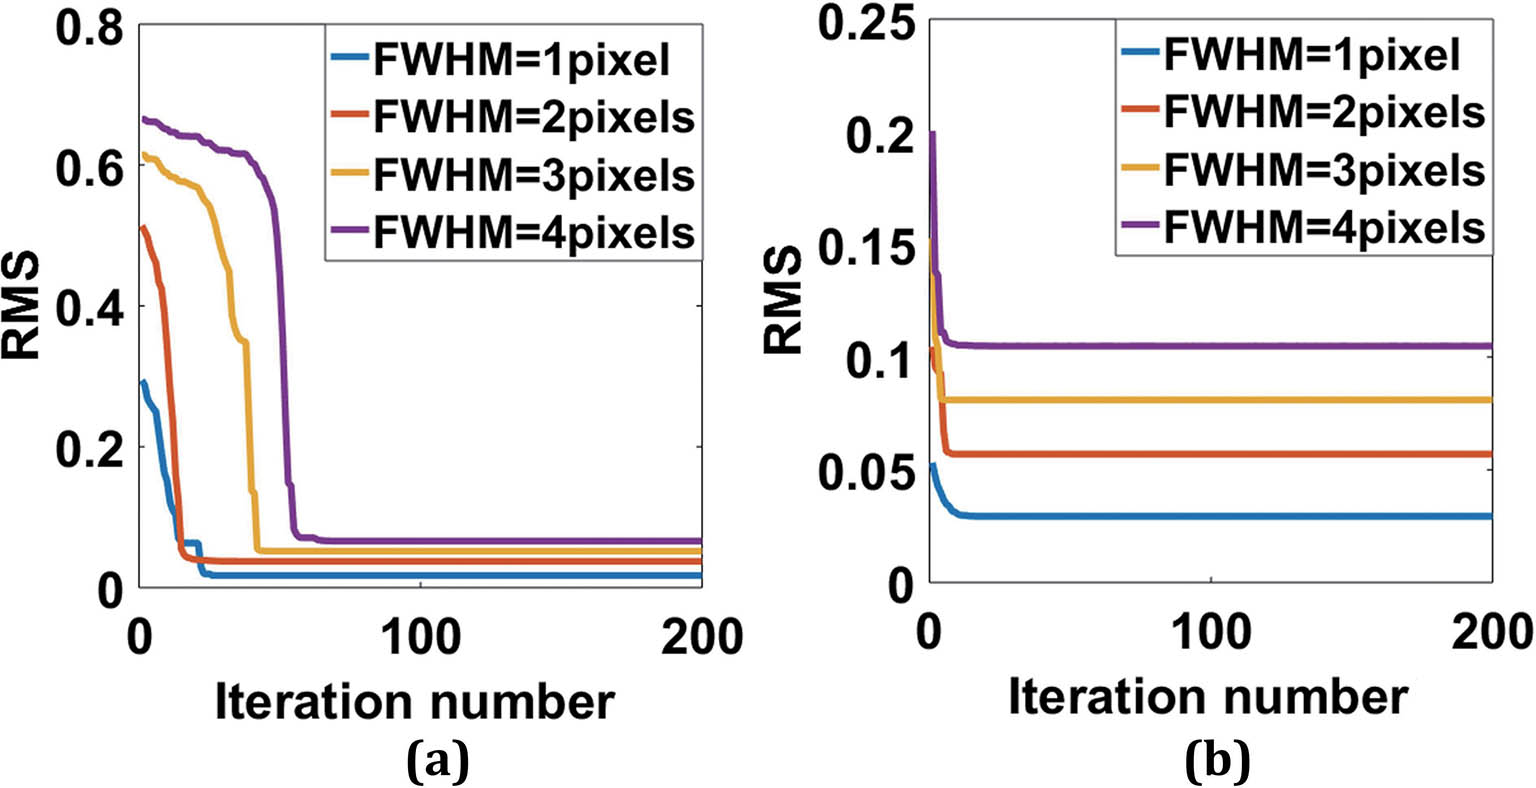
Fig. 6. Convergence curves of RMS during the correction. (a) RMS changes during the on-axis field correction. (b) RMS changes during the all-fields correction.

下载图片 查看所有图片

Figures 5 and 6 show that whether the images are well-sampled or under-sampled, and the alignment processes converge stably and quickly. With the reduction of the FWHM, the RMS decreases. That is because all the images have the same size of 200pixels×200pixels, so with the reduction of the FWHM the information carried by images is decreased. So the RMS of the under-sampled images becomes smaller.

To verify the accuracy of the alignments based on both the well-sampled and under-sampled images, the residual errors and the wavefront residual errors (WREs) after correction are calculated. The results are shown in Table 3.

Table 3. Residual Errors and Wavefront Residual Errors of Optical System Measured After Correction

FWHM(pixel)1234
Residual errorsDx (mm)0.0300.0510.0300.023
Dy (mm)−0.276−0.226−0.133−0.098
Dz (mm)0.0080.0080.0080.008
Tx (°)0.0380.0310.0180.013
Ty (°)0.0040.0070.0040.003
RRE (%)19.519.712.39.5
WRE (λ)0.10740.10710.10140.0972

查看所有表

Table 3 shows the residual errors of the misalignments, which are calculated by the difference between the designed positions and the actual positions of the secondary mirror after correction, reflecting the accuracy of the alignments. The relative residual errors (RREs) are defined as the mean ratios of the residual errors and the theoretical misalignments corresponding to different degrees of freedom. The results show that the RREs are increased with the decrease of the FWHMs, indicating that the accuracy of alignments becomes worse with the growth of under-sampled factors.

To verify the accuracy of alignment, WREs in the 0field are calculated using a Zernike polynomial before and after correction. The designed working condition of telescope has few aberrations with WREs of 0.0919λ. When the telescope is in the misaligned working condition, the system carries large aberrations with WREs of 3.1028λ. For different under-sampled factors, the 0field WREs after the alignment process are shown in Table 3. The results indicate that with the increase of FWHMs, the WREs decrease and are close to the designed working condition. For images with an FWHM of 4 pixels, the WRE is 0.0972λ, which is closest to the designed condition of 0.0919λ. Therefore, with the decreases of the FWHM, the WRE increases, reducing the accuracy of alignment. That is because the information of the images is more seriously lost when the under-sampled factor increases, so they cannot accurately express the aberrations of the optical system.

In conclusion, the misalignments of telescopes can be corrected by maximizing the sharpness function of the far-field images. Whether the images are well-sampled or under-sampled, the correction process can converge stably and rapidly, and the images after correction have similar shapes and sizes even when the FWHMs of the images are different. The accuracy of alignment is analyzed by the RREs and WREs. The RREs show that with the reduction of the FWHM, the accuracy of alignment becomes worse, increasing from 9.5% to 19.5%, and the WREs increase from 0.0972λ to 0.1074λ, indicating that the under-sampled images decrease the accuracy of alignment and cannot express the aberrations exactly because much information is lost. So, for future work, when the telescopes are aligned based on the sharpness function of far-field images with a different sampling frequency, two possible methods can help improve the precision of alignment. One is to find a new merit function that has no relation to the sampling of images; the other is to reconstruct the under-sampled images to recover the lost information.

Min Li, Xin Liu, Ang Zhang, Hao Xian. Telescope alignment based on the sharpness function of under-sampled images[J]. Chinese Optics Letters, 2019, 17(6): 061101.

本文已被 1 篇论文引用
被引统计数据来源于中国光学期刊网
引用该论文: TXT   |   EndNote

相关论文

加载中...

关于本站 Cookie 的使用提示

中国光学期刊网使用基于 cookie 的技术来更好地为您提供各项服务,点击此处了解我们的隐私策略。 如您需继续使用本网站,请您授权我们使用本地 cookie 来保存部分信息。
全站搜索
您最值得信赖的光电行业旗舰网络服务平台!