Development of a 100 J, 10 Hz laser for compression experiments at the High Energy Density instrument at the European XFEL
1 Central Laser Facility
,
STFC Rutherford Appleton Laboratory
,
Didcot
,
OX11 0QX
,
UK
2 Institute for Radiation Physics
,
Helmholtz-Zentrum Dresden-Rossendorf e.V.
,
D-01328 Dresden
,
Germany
Figures & Tables
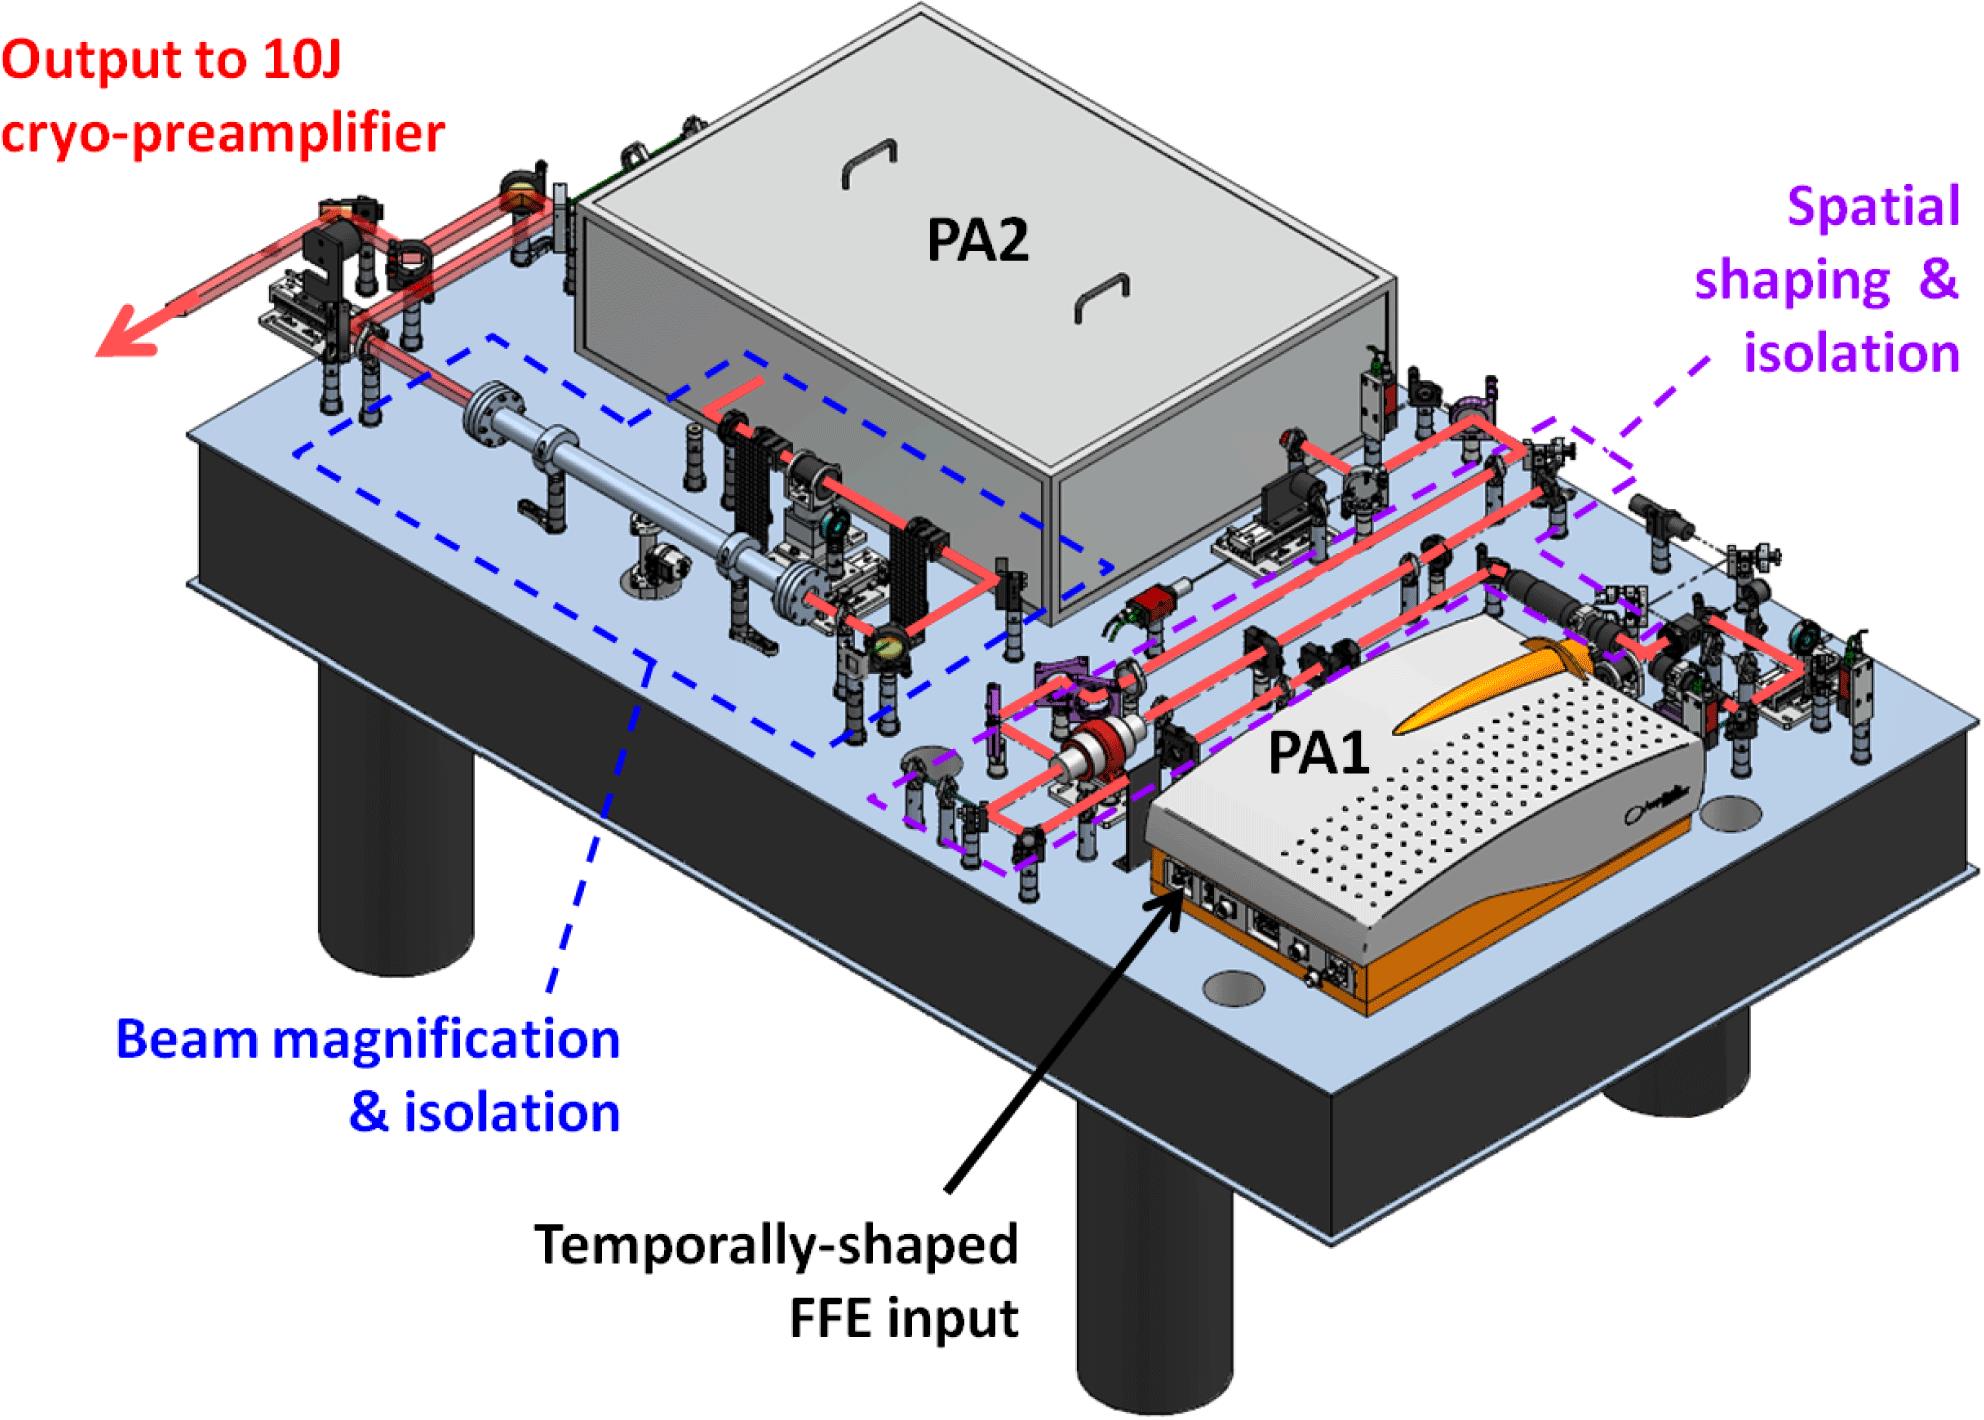
Fig. 3. Schematic layout of the front end for DiPOLE100X.
下载图片 查看原文
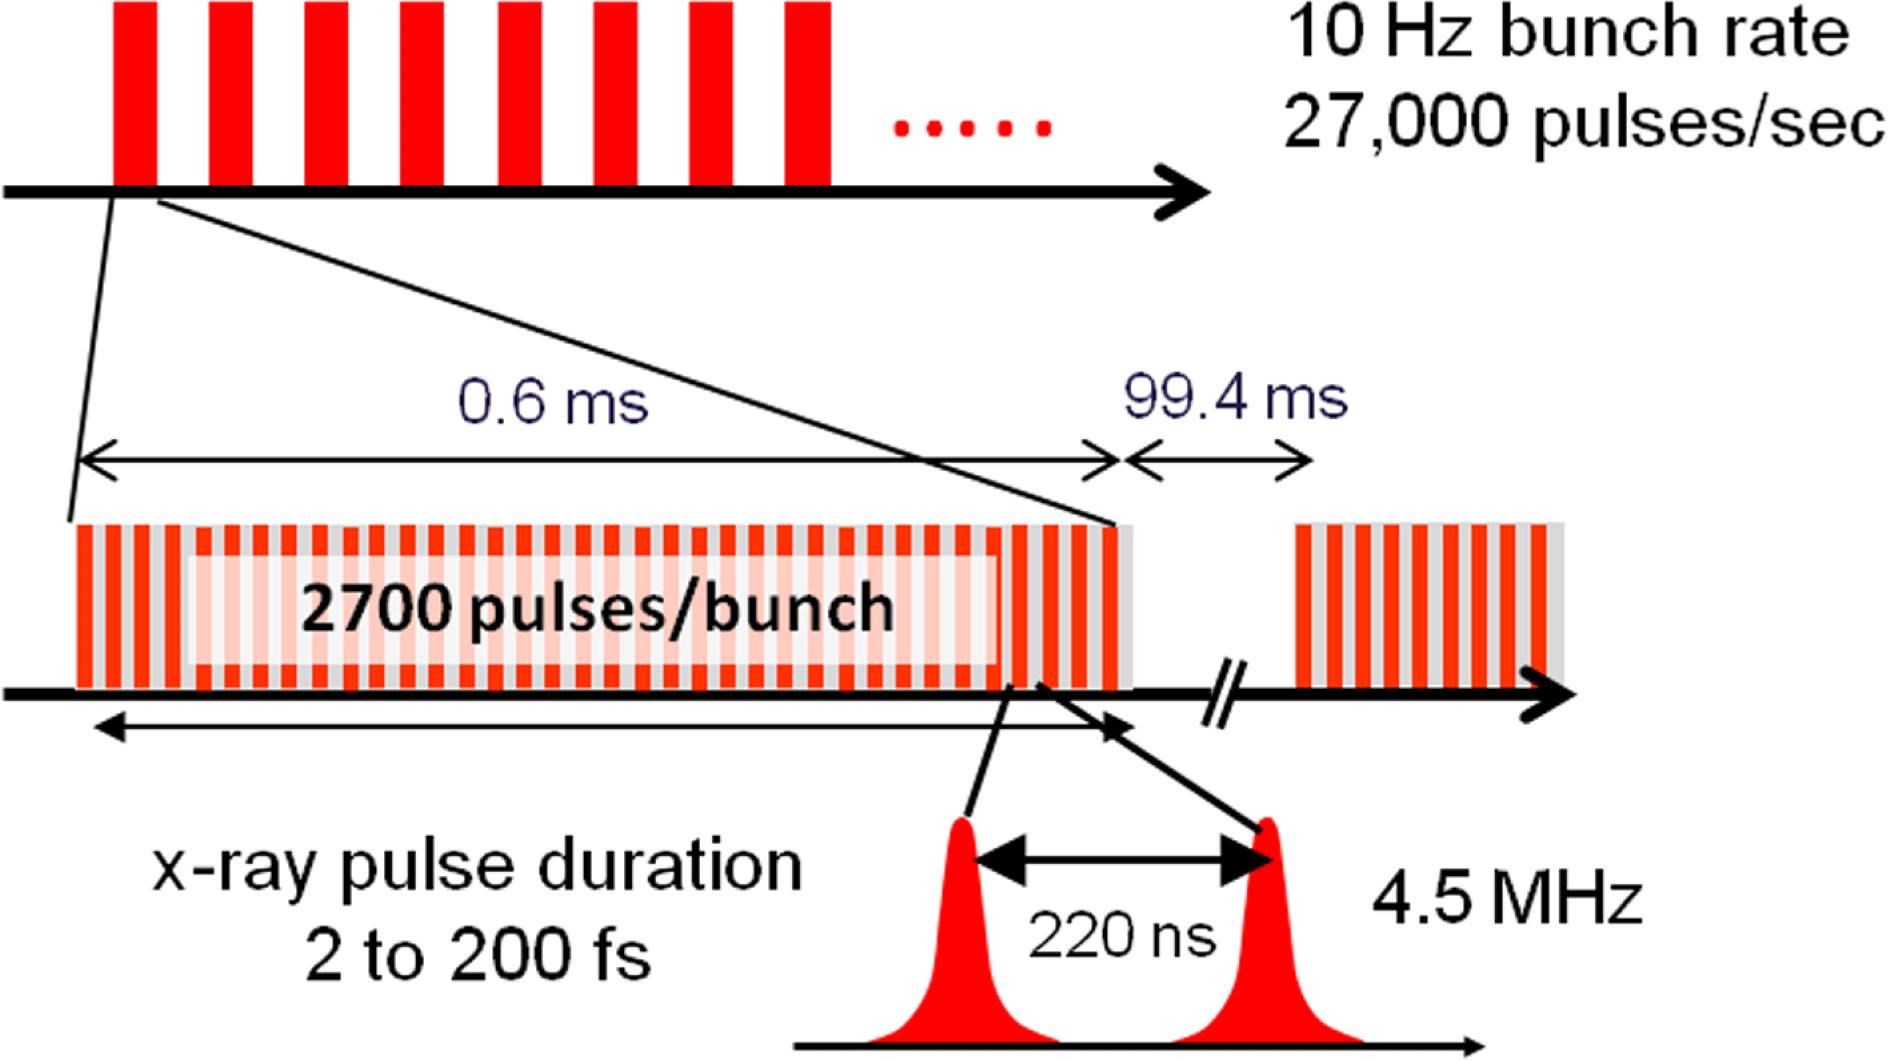
Fig. 4. X-ray pulse timing diagram for SASE II beamline.
下载图片 查看原文
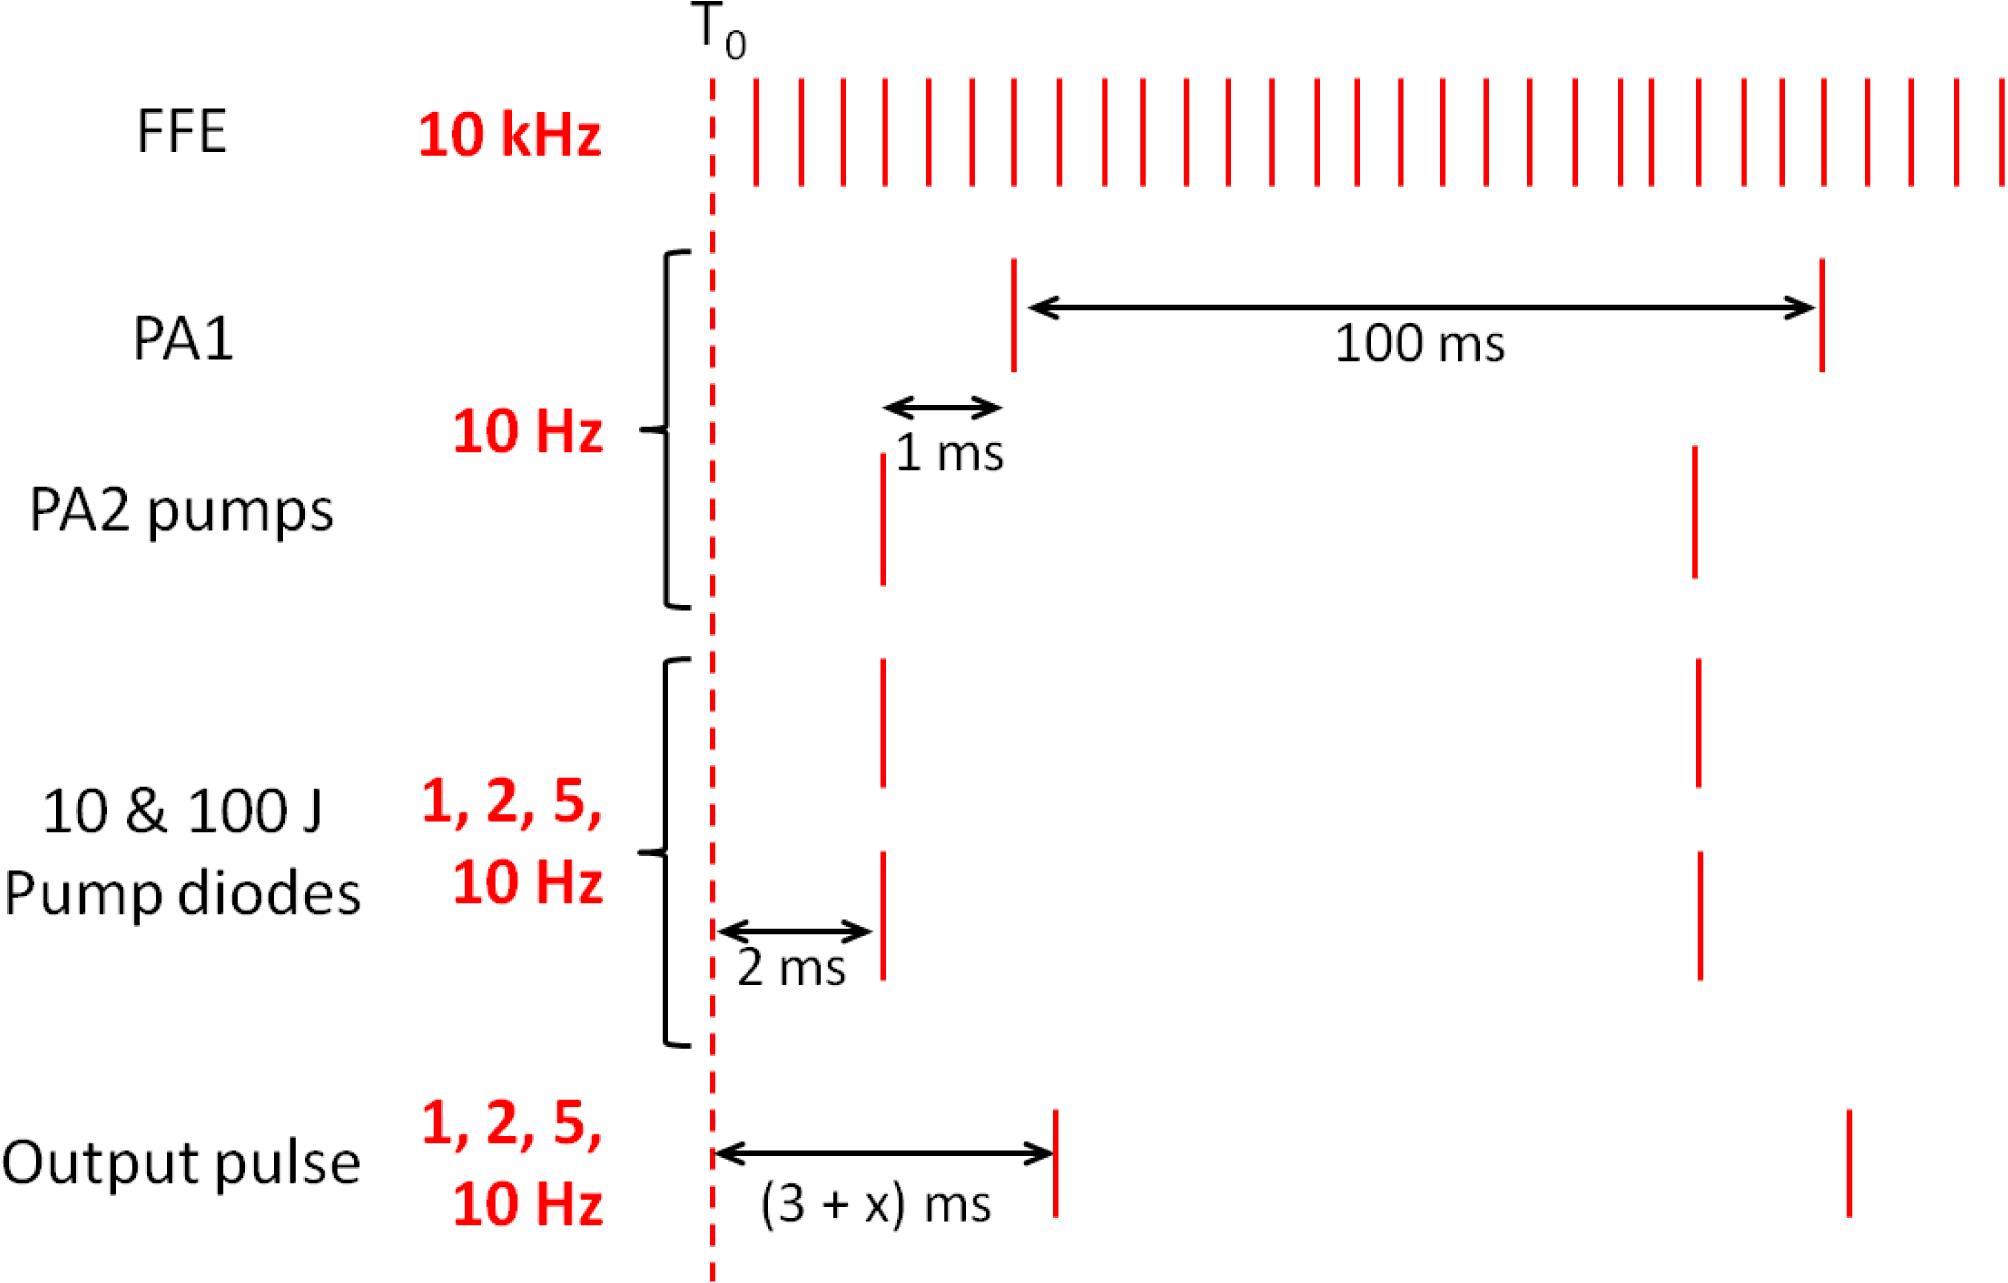
Fig. 5. DiPOLE100X timing diagram.
下载图片 查看原文
Fig. 7. (a) Photograph of the DiPOLE100X 10 J bimorph deformable mirror, built at the CLF, with inset showing schematic of electrode pattern, (b) corrected output wave front and (c) far-field CCD camera image measured at 10 J, 10 Hz on the DiPOLE prototype amplifier.
下载图片 查看原文
Fig. 8. Energy stability over half an hour with inset showing measured temporal pulse shape for amplification of 2.2 ns pulses at 8 J, 10 Hz.
下载图片 查看原文
Fig. 10. (a) Photograph of new 100 J deformable mirror, (b) target aberrated wave front and (c) residual error in generated wave front.
下载图片 查看原文
Fig. 11. Synoptic screen for control and monitoring of 10 J cryo-preamplifier. Red lines correspond to the main 1030 nm laser beam path, input from the FE (left) and output to the beam transport section (right); blue lines represent diagnostic beam paths; and orange lines correspond to 940 nm pump diode beam paths.
下载图片 查看原文
Fig. 12. Temporal pulse shaping results at 6.5 J, 10 Hz obtained using the DiPOLE prototype amplifier (a) flat-top and (b) multi-step pyramid pulse profiles.
下载图片 查看原文
Fig. 13. Time lapse photographs of DiPOLE100X build with 3D CAD view of completed system.
下载图片 查看原文
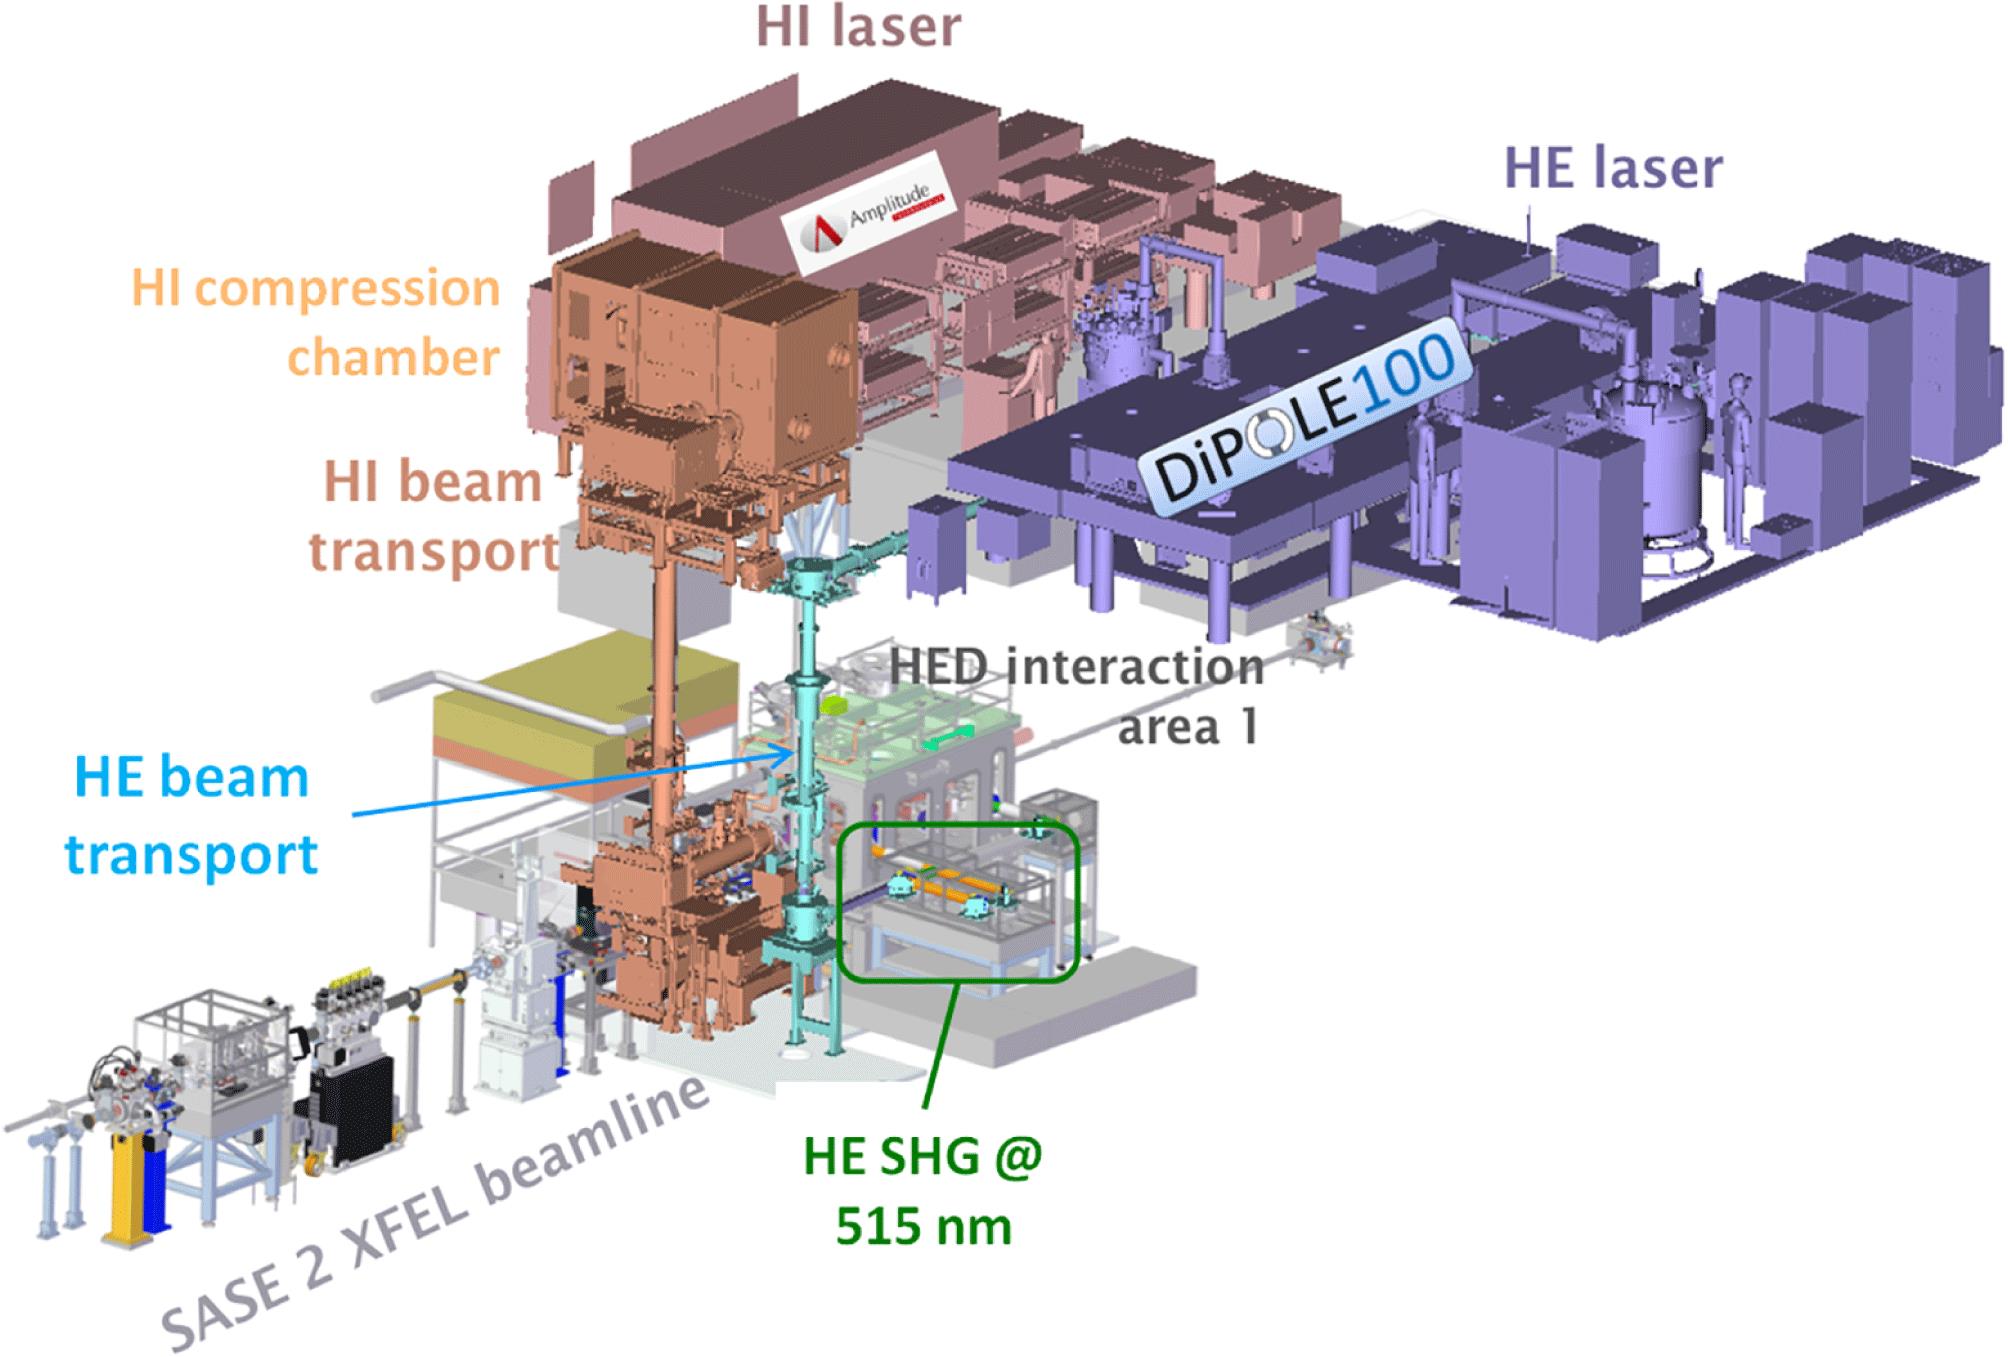
Fig. 14. Schematic showing the main components of the HED instrument.
下载图片 查看原文
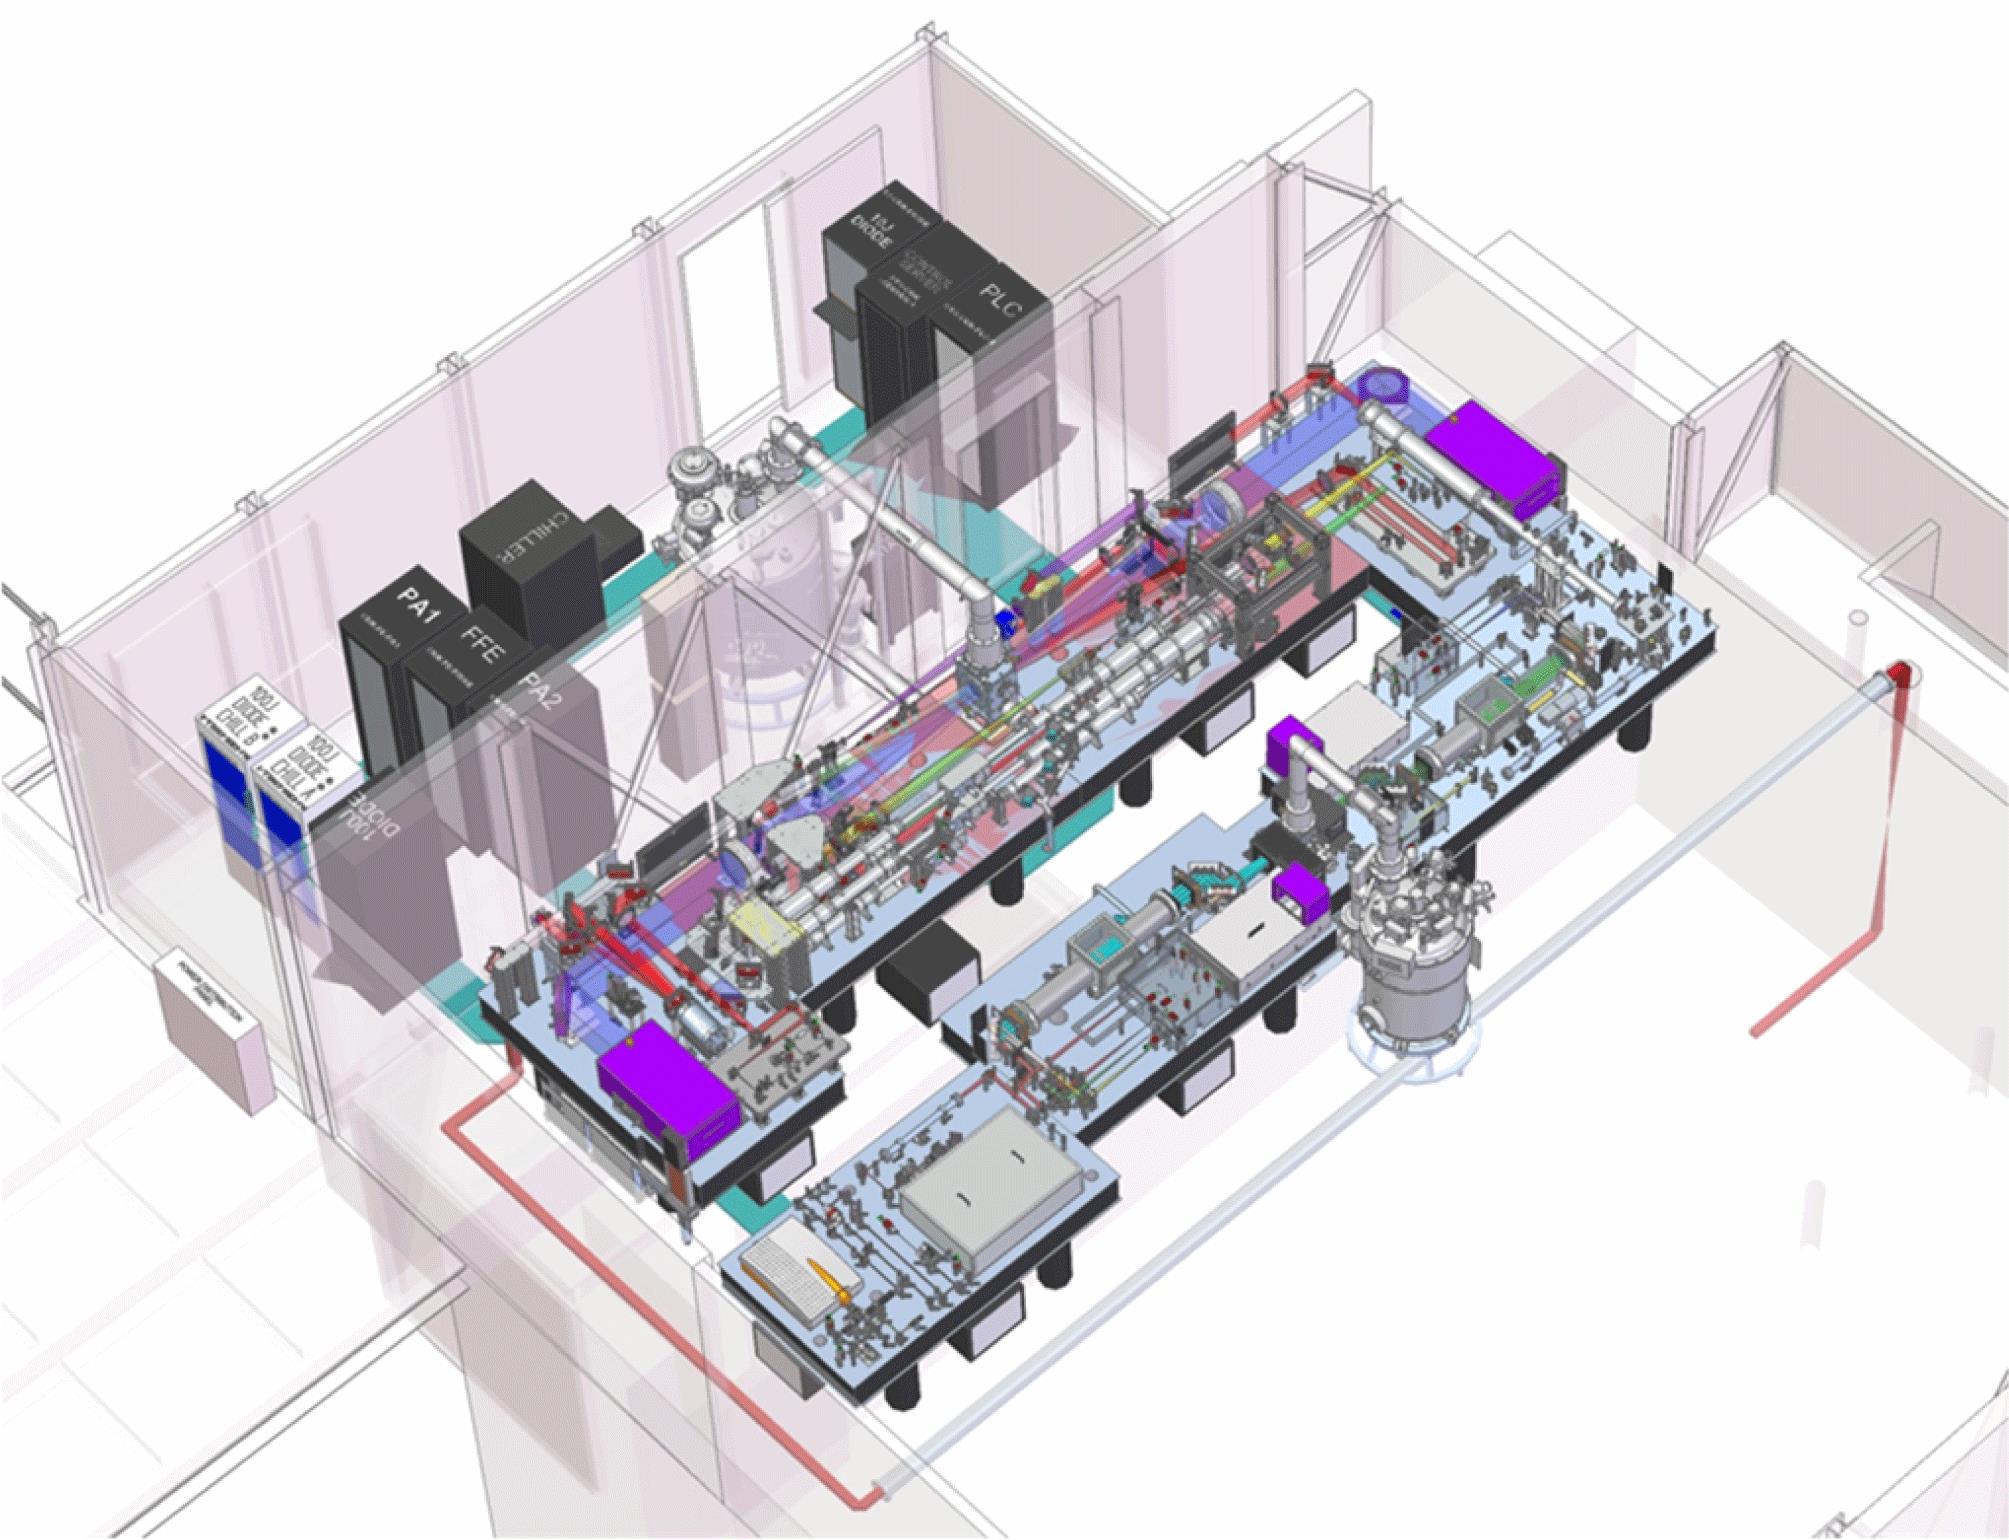
Fig. 15. Layout of DiPOLE100X in laser hutch at the HED instrument.
下载图片 查看原文
Table2. Functionality of user control screens in DiPOLE100X control system
| Control screen | Functions |
|---|
| Overviews | Access to summary/overview screens for each of the main sub-systems (FE, 10 J, 100 J) and the beam transport section. | | Synoptics | Real-time, interactive visual displays of the status of the main sub-systems (FE, 10 J, 100 J) and their individual components. Synoptic screens use a traffic light system to indicate the status of each individual component, with
green
indicating that all is okay,
amber
indicating a component requires attention, and
red
indicating that either the component is off or that there is an error that requires action. Control screens can be accessed directly by touching the component symbol on-screen, minimizing the number of actions needed to view and adjust settings. An example synoptic display for the 10 J cryo-preamplifier is shown in Figure
11
. | | Automation | Useful information related to beam steering and machine safety. | | Alignment | Overview of the current status of the automatic beam alignment system at various points within the system based on data from relevant near- and far-field diagnostic cameras. Again a traffic light system is used to indicate alignment status. | | Interlock | Status of system interlocks. | | Hazards | Important information on the status of all laser hazards. This screen can also be displayed on a remote monitor, sited outside the laser laboratory, to show whether it is safe to enter the area. |
|
查看原文
Paul Mason, Saumyabrata Banerjee, Jodie Smith, Thomas Butcher, Jonathan Phillips, Hauke Höppner, Dominik Möller, Klaus Ertel, Mariastefania De Vido, Ian Hollingham, Andrew Norton, Stephanie Tomlinson, Tinesimba Zata, Jorge Suarez Merchan, Chris Hooker, Mike Tyldesley, Toma Toncian, Cristina Hernandez-Gomez, Chris Edwards, John Collier. Development of a 100 J, 10 Hz laser for compression experiments at the High Energy Density instrument at the European XFEL[J]. High Power Laser Science and Engineering, 2018, 6(4): 04000e65.
 Yb–silica fibre oscillator; YDFA
 Yb–silica fibre amplifier (inc. temporal pulse shaping); PA
 room-temperature preamplifier (1
 Yb:CaF
2
regenerative, 2
Yb:CaF
2
regenerative, 2
 Yb:YAG multi-pass); MA
 main cryogenic amplifier (ceramic Yb:YAG multi-slab).
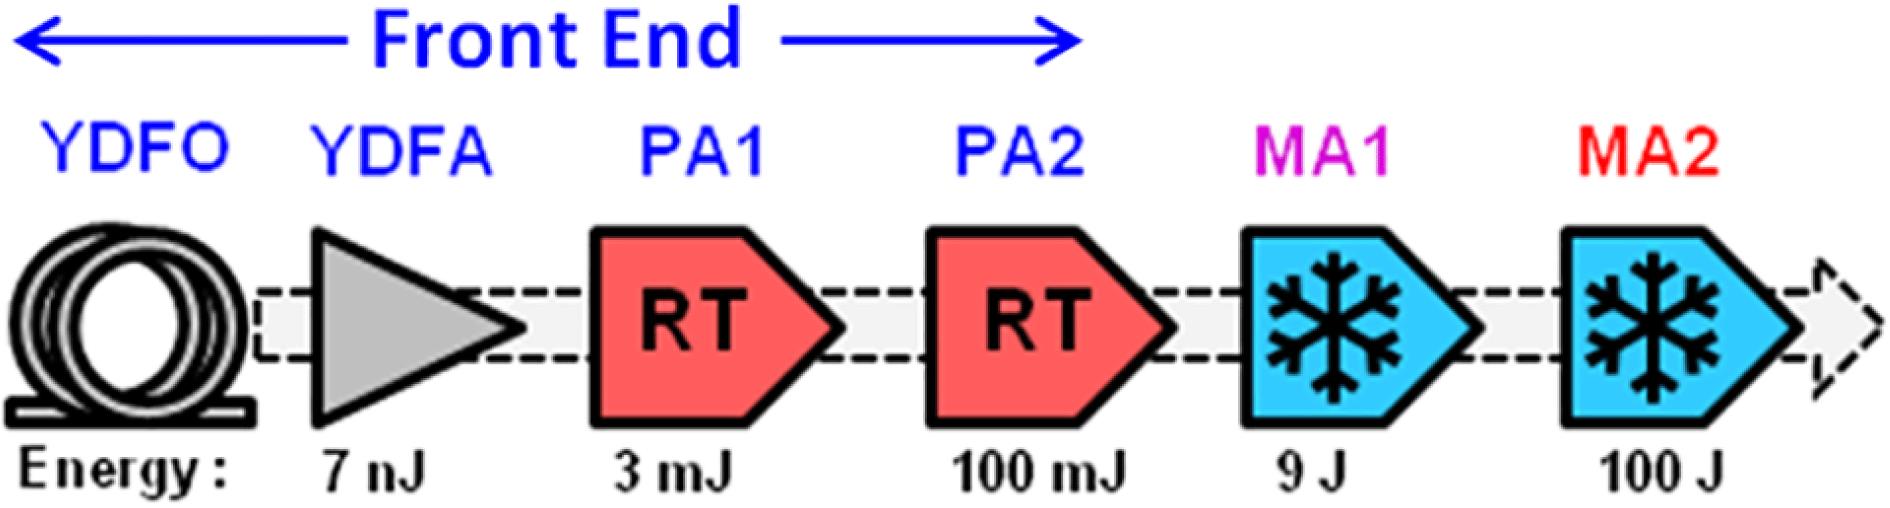
 fibre front end, DP
 diode pumps, cGC
 cryogenic gas coolers, DM
 deformable mirrors, BD
 beam diverter, FFE
 fibre front end (not shown).
 diode pumps, DM1
 10 J deformable mirror, BS
 beam splitters.


 diode pumps, DM2
 100 J deformable mirror, BD
 beam diverter.


 nm
nm 2.5% RMS
 1% RMS
 25 ps RMS
 ,
, )
)
 DL (
DL (
 )
) DL (
DL (
 )
) rad
rad rad
rad 4% RMS


 PDF全文
PDF全文

