Photonics Research, 2017, 5 (6): 06000728, Published Online: Dec. 7, 2017
Intracavity biosensor based on the Nd:YAG waveguide laser: tumor cells and dextrose solutions  Download: 539次
Figures & Tables
Fig. 1. (a) Diagram of the biosensor. (b) HRTEM image of G/W heterostructure. Graphene on the top and WSe 2
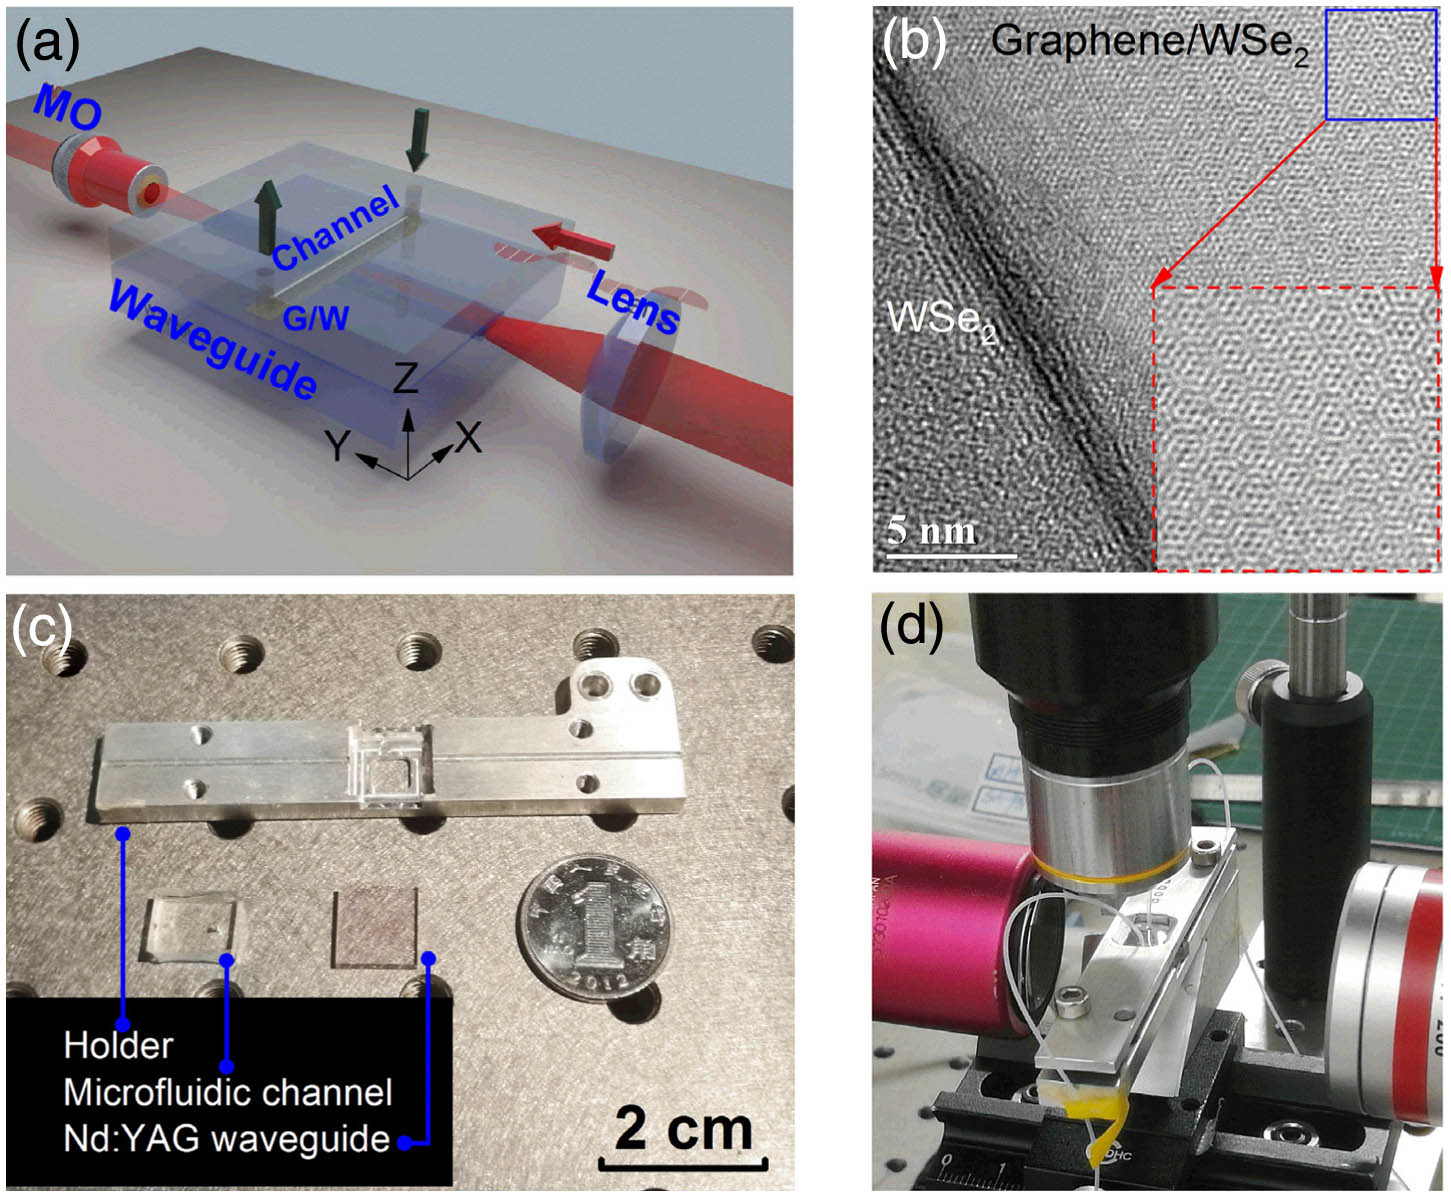
Fig. 2. (a) Refractive index distribution of the Nd:YAG waveguide and the propagation mode of the guided light at the wavelength of 1064 nm. (b) Polar image of the output light power along with the polarization variation. Wavelength of the detecting light is 1064 nm. (c) Real-time signal of different concentrations of dextrose solution. (d) Absorption coefficient corresponding to air, water, and dextrose solution.

Fig. 3. (a) Emission spectrum of the output laser. Inset is the measured near-field modal profile of the emitted laser from the Nd:YAG waveguide. (b) Output power of the Nd:YAG waveguide as a function of the pumping power. Variations of (c) P th ϕ P out P out

Fig. 4. (a) Real-time signal of different concentrations of dextrose solution in the active biosensor. (b) Output power of detecting light corresponding to the refractive index of the different liquid.


Guanhua Li, Huiyuan Li, Rumei Gong, Yang Tan, Javier Rodríguez Vázquez de Aldana, Yuping Sun, Feng Chen. Intracavity biosensor based on the Nd:YAG waveguide laser: tumor cells and dextrose solutions[J]. Photonics Research, 2017, 5(6): 06000728.


 PDF全文
PDF全文

