Photonics Research, 2019, 7 (4): 04000486, Published Online: Apr. 11, 2019
Controlling multiphoton excited energy transfer from Tm3+ to Yb3+ ions by a phase-shaped femtosecond laser field
Figures & Tables
Fig. 1. Schematic of the experimental setup. G 1 and G 2 are two diffraction gratings of 1200 lines/mm each. C 1 and C 2 are two cylindrical concave mirrors each of focus length 200 mm. SLM, spatial light modulator; λ / 4 , quarter-wave plate; L 1 , focusing lens; GA, genetic algorithm.
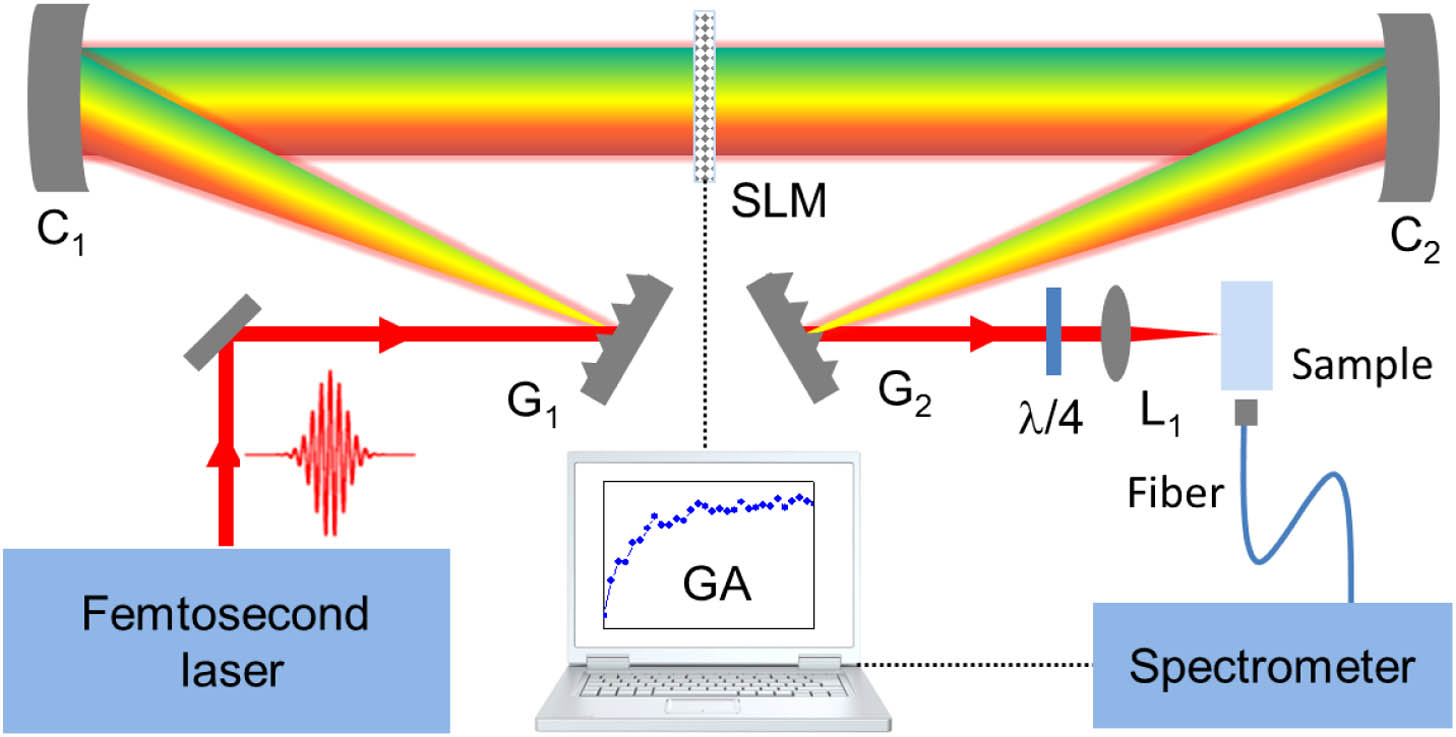
Fig. 2. Characterization of the Tm 3 + / Yb 3 + co-doped glass ceramic sample. (a) XRD pattern. (b), (c) TEM images.
Fig. 3. (a) Absorption spectrum of the Tm 3 + / Yb 3 + co-doped glass ceramics in the UV–VIS–NIR region and (b) the luminescence spectrum of the same sample with the excitation of an 800 nm femtosecond laser pulse.
Fig. 4. Laser peak intensity dependences of (a) luminescence intensities at 355, 454, 473, and 975 nm for the Tm 3 + / Yb 3 + co-doped glass ceramics and (b) luminescence intensity at 975 nm for the Yb 3 + single-doped glass ceramics, together with the absorption (lower right) and luminescence (upper left) spectra.
Fig. 5. Energy level structures of Tm 3 + and Yb 3 + ions, together with the proposed mechanisms for explaining the luminescence processes and the energy transfer from Tm 3 + to Yb 3 + ions.
Fig. 6. Dependences of luminescence intensities on the value of θ , the angle between the direction of input laser polarization and the optical axis of the λ / 4 plate. (a) Luminescence signals at 454 nm (red squares) and 975 nm (blue circles) for the Tm 3 + / Yb 3 + co-doped glass ceramics. (b) Luminescence signal at 975 nm (rose squares) for the Yb 3 + single-doped glass ceramics.
Fig. 7. Optimization processes for (a-1) enhancing and (a-2) suppressing the luminescence signal at 975 nm. Luminescence spectra of the Tm 3 + / Yb 3 + sample with (blue curve) and without (red curve) phase optimization for (b-1) optimal enhancement and (b-2) suppression. Phase masks (blue curve) and laser spectra (red curve) for (c-1) optimal enhancement and (c-2) suppression. Time profiles of the shaped (blue curve) and TL (red curve) femtosecond pulses for (d-1) optimal enhancement and (d-2) suppression.
Ye Zheng, Lianzhong Deng, Jianping Li, Tianqing Jia, Jianrong Qiu, Zhenrong Sun, Shian Zhang. Controlling multiphoton excited energy transfer from Tm3+ to Yb3+ ions by a phase-shaped femtosecond laser field[J]. Photonics Research, 2019, 7(4): 04000486.