特征变量选择和回归方法相结合的土壤有机质含量估算  下载: 1176次
Estimation of Soil Organic Matter Content Based on Characteristic Variable Selection and Regression Methods
1 青海师范大学地理科学学院,青海省自然地理与环境过程重点实验室, 青海 西宁 810008
2 中国环境科学研究院, 北京 100012
图 & 表
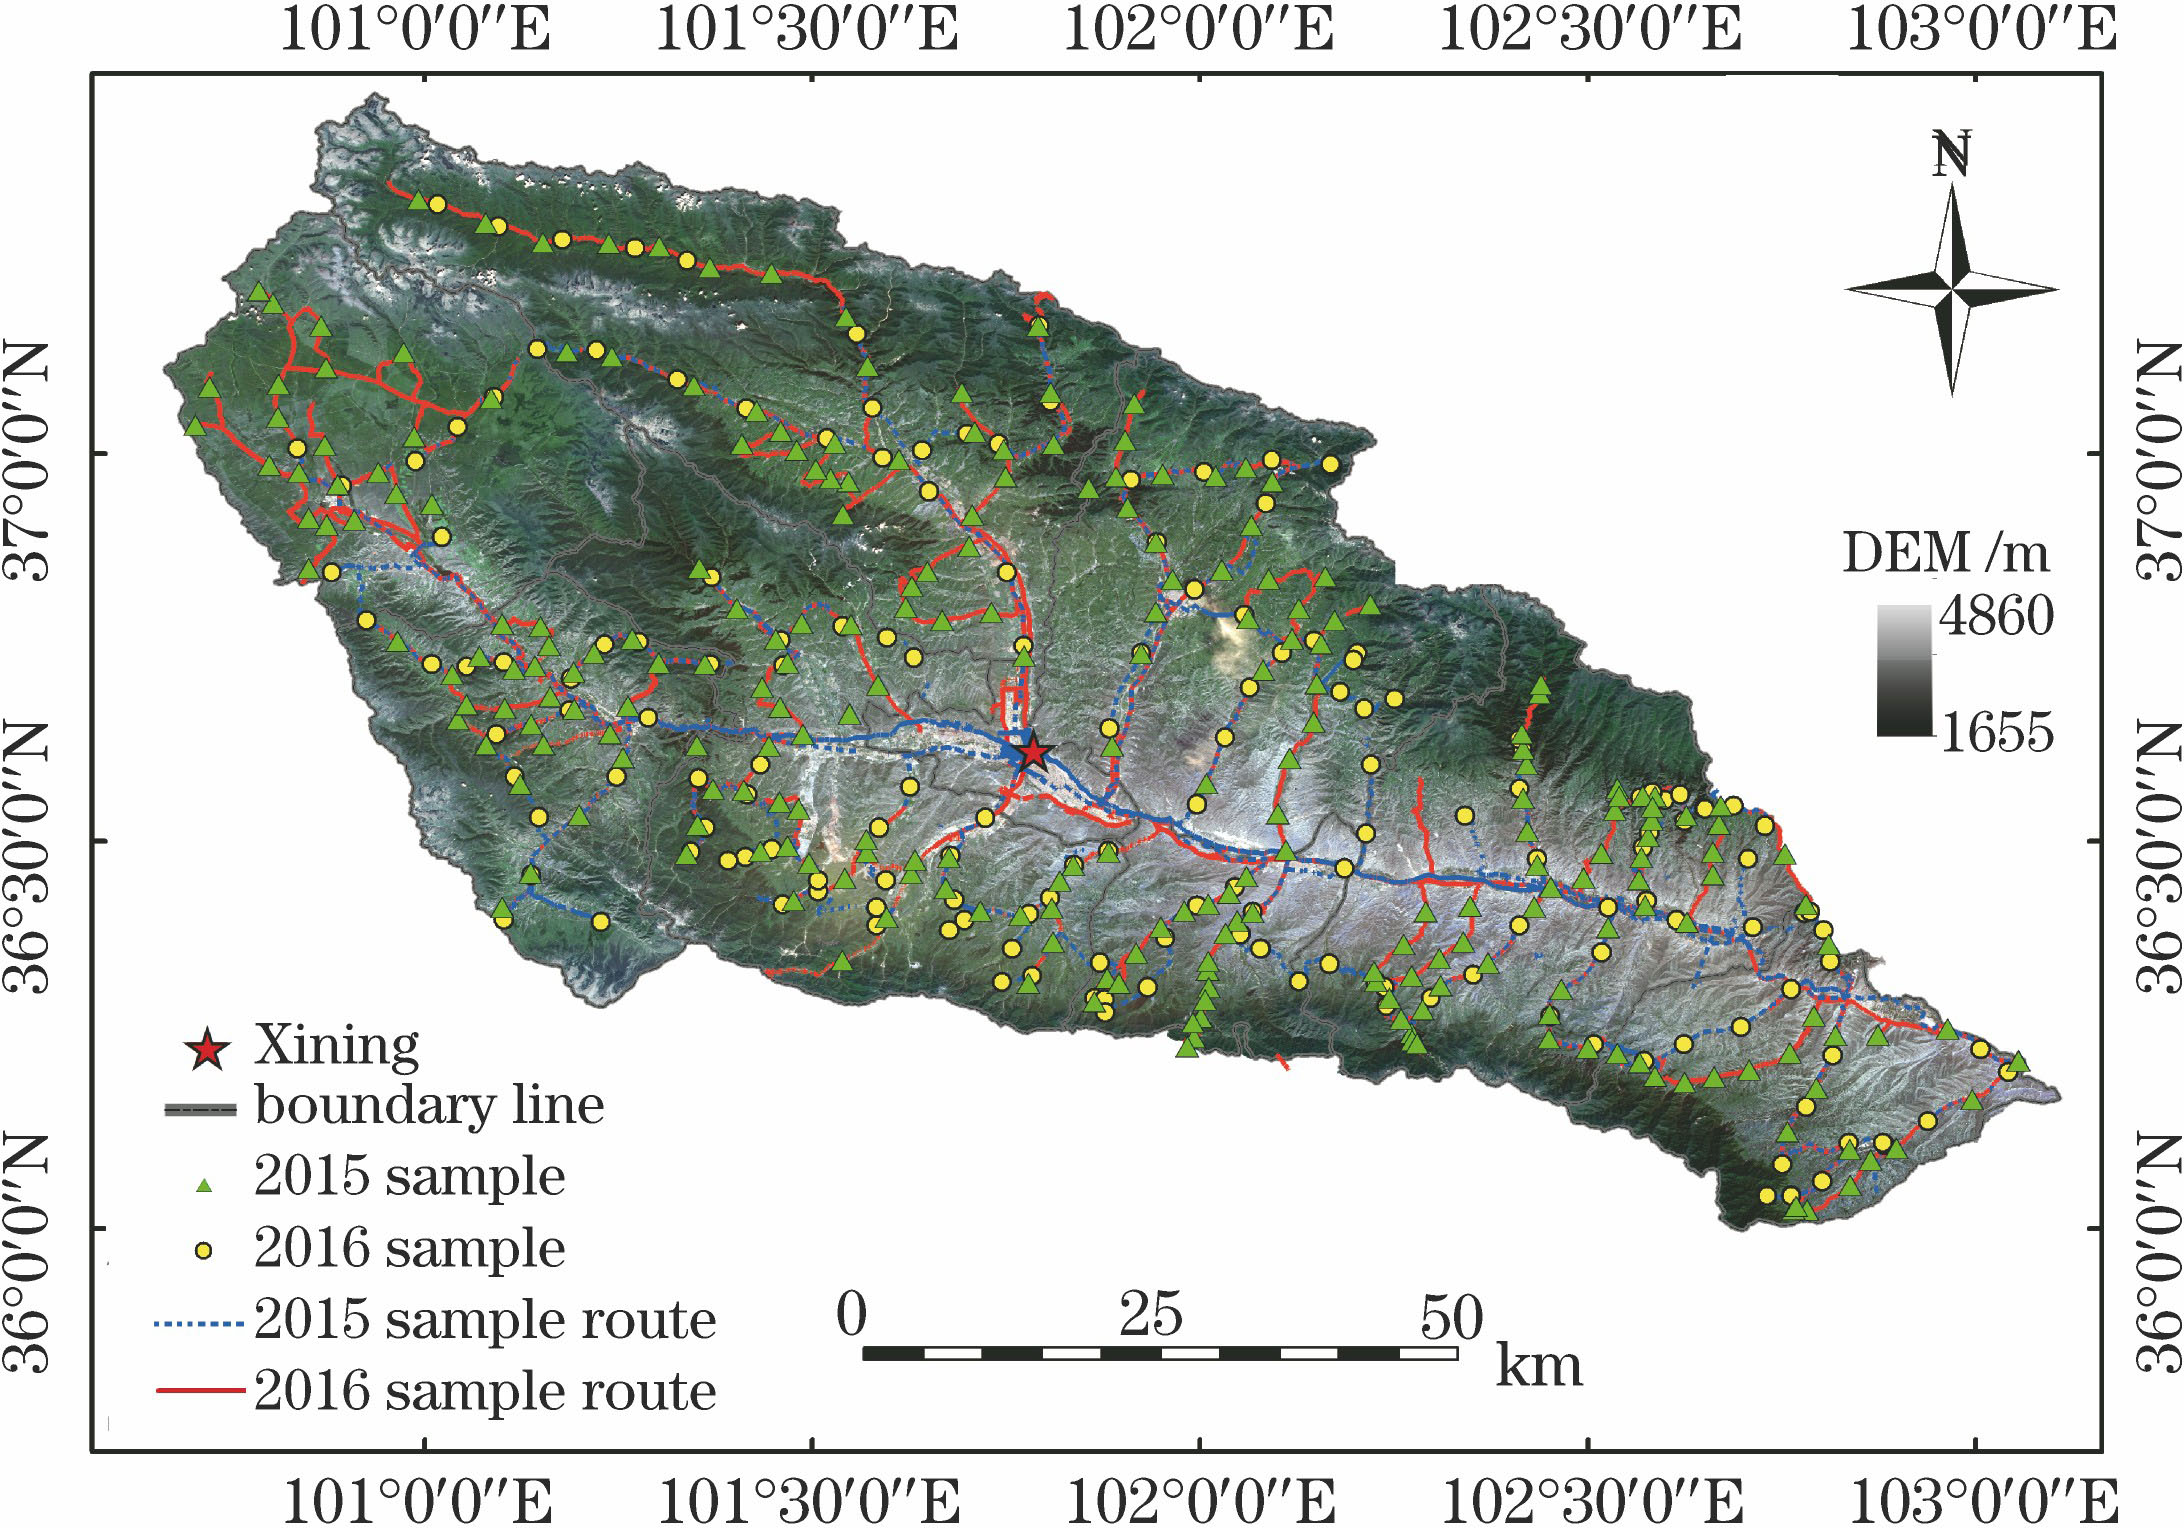
图 1. 研究区位置及采样点分布图
Fig. 1. Location of the study area and distribution of soil sampling sites
下载图片 查看原文
图 2. 土壤样品反射率曲线。(a) 原始光谱;(b) MSC-MF-1st Derivative预处理光谱
Fig. 2. Spectral reflectance curves of soil samples. (a) Raw spectra; (b) spectra after MSC-MF-1st Derivative pre-processing
下载图片 查看原文
图 3. sCARS变量筛选流程。(a)变量变化趋势;(b)十折交叉均方根误差;(c)变量回归系数
Fig. 3. Variable selection process by sCARS. (a) Changing trend of variables; (b) 10-fold RMSECV values; (c) regression coefficients of variables
下载图片 查看原文
图 4. GA特征变量筛选过程
Fig. 4. Characteristic variable selection process by GA
下载图片 查看原文
图 5. 预处理光谱sCARS-SPA特征变量筛选过程。(a)模型变量数;(b)变量指数
Fig. 5. Characteristic variable selection process by sCARS-SPA from the pre-processing spectrum. (a) Number of variables in the model; (b) variable index
下载图片 查看原文
图 6. 不同变量筛选方法挑选特征变量分布
Fig. 6. Distribution of characteristic variables with different variable selection methods
下载图片 查看原文
图 7. sCARS-PLSR模型预测SOM含量散点图
Fig. 7. Scatter plot for the measured and predicted value by sCARS-PLSR model
下载图片 查看原文
图 8. SPA-SVM模型预测SOM含量散点图
Fig. 8. Scatter plot for the measured and predicted value by SPA-SVM model
下载图片 查看原文
图 9. IRIV-RF模型预测SOM含量散点图
Fig. 9. Scatter plot for the measured and predicted value by IRIV-RF model
下载图片 查看原文
图 10. 不同变量筛选方法PLSR、SVM、RF模型建模结果
Fig. 10. Results of PLSR, SVM and RF models with different variable selection methods
下载图片 查看原文
图 11. 人工剔除异常值前后sCARS-RF模型散点图。(a)剔除异常值前;(b)剔除异常值后
Fig. 11. Scatter plots for the measured and predicted value by sCARS-RF model before and after artificially eliminating outliers. (a) Contain outliers; (b) eliminate outliers
下载图片 查看原文
表 1校准集和验证集土壤有机质含量统计表
Table1. Soil organic matter content statistics of calibration set and validation set
| Sample set | Samplenumber | Min /(g·kg-1) | Max /(g·kg-1) | Mean /(g·kg-1) | SD |
|---|
| Calibration set | 268 | 4.86 | 148.74 | 32.47 | 23.52 | | Validation set | 133 | 8.26 | 133.56 | 32.16 | 22.44 |
|
查看原文
表 2不同变量筛选方法的PLSR模型精度
Table2. Accuracies of PLSR model with different variable selection methods
| Selection method | Variable number | PC | Calibration set | Validation set |
|---|
| RMSECAL | | | RMSEVAL | RPD |
|---|
| Full-spectrum | 2000 | 5 | 0.842 | 9.326 | 0.835 | 9.069 | 2.5 | | sCARS | 51 | 5 | 0.874 | 8.327 | 0.883 | 7.797 | 2.9 | | SPA | 5 | 5 | 0.850 | 9.103 | 0.858 | 8.525 | 2.6 | | GA | 186 | 4 | 0.842 | 9.342 | 0.861 | 8.415 | 2.7 | | IRIV | 63 | 6 | 0.843 | 9.300 | 0.875 | 8.043 | 2.8 | | sCARS-SPA | 17 | 4 | 0.765 | 11.391 | 0.848 | 8.791 | 2.6 |
|
查看原文
表 3不同变量筛选方法的SVM建模精度
Table3. Accuracies of SVM model with different variable selection methods
| Selection method | Variable number | Optimal parameter | Calibration set | Validation set |
|---|
| g (nuclear function) | c (punishment coefficient) | | | RMSECAL | | | RMSEVAL | RPD |
|---|
| Full-spectrum | 2000 | 0.036 | 3.031 | 0.91 | 7.221 | 0.74 | 11.546 | 1.9 | | sCARS | 51 | 0.021 | 3.031 | 0.881 | 8.116 | 0.877 | 7.918 | 2.8 | | SPA | 5 | 0.004 | 1.741 | 0.858 | 8.855 | 0.889 | 7.477 | 3.0 | | GA | 186 | 0.012 | 1.741 | 0.867 | 8.577 | 0.871 | 8.093 | 2.8 | | IRIV | 63 | 0.021 | 3.031 | 0.869 | 8.493 | 0.864 | 8.307 | 2.7 | | sCARS-SPA | 17 | 0.011 | 2.858 | 0.877 | 8.246 | 0.873 | 8.052 | 2.8 |
|
查看原文
表 4不同变量筛选方法RF建模精度
Table4. Accuracies of RF model with different variable selection methods
| Selection method | Variable number | Calibration set | Validation set |
|---|
| RMSECAL | | | RMSEVAL | RPD |
|---|
| Full-spectrum | 2000 | 0.942 | 5.817 | 0.957 | 4.840 | 4.6 | | sCARS | 51 | 0.942 | 5.781 | 0.958 | 4.780 | 4.7 | | SPA | 5 | 0.930 | 6.585 | 0.954 | 5.082 | 4.4 | | GA | 186 | 0.939 | 5.894 | 0.959 | 4.699 | 4.8 | | IRIV | 63 | 0.941 | 5.927 | 0.960 | 4.656 | 4.8 | | sCARS-SPA | 17 | 0.940 | 5.910 | 0.955 | 4.971 | 4.5 |
|
查看原文
表 5人工剔除异常值后模型精度
Table5. Model accuracy after manually eliminating outliers
| Model | Calibration set | Validation set |
|---|
| RMSECAL | | | RMSEVAL | RPD |
|---|
| sCARS-PLSR | 0.943 | 5.538 | 0.926 | 5.987 | 3.7 | | sCARS-SVM | 0.926 | 6.092 | 0.957 | 4.903 | 4.6 | | sCARS-RF | 0.985 | 3.204 | 0.988 | 2.865 | 7.8 |
|
查看原文
李冠稳, 高小红, 肖能文, 肖云飞. 特征变量选择和回归方法相结合的土壤有机质含量估算[J]. 光学学报, 2019, 39(9): 0930002. Guanwen Li, Xiaohong Gao, Nengwen Xiao, Yunfei Xiao. Estimation of Soil Organic Matter Content Based on Characteristic Variable Selection and Regression Methods[J]. Acta Optica Sinica, 2019, 39(9): 0930002.


 PDF全文
PDF全文

