Photoacoustic characteristics of lipid-rich plaques under ultra-low temperature and formaldehyde treatment  Download: 714次
1 Key Laboratory of Cardiovascular Remodeling and Function Research, Department of Cardiology, Qilu Hospital of Shandong University, Jinan 250012, China
2 MOE Key Laboratory of Laser Life Science and Institute of Laser Life Science, College of Biophotonics, South China Normal University, Guangzhou 510631, China
3 Department of Cardiology, The Juye Hospital of Traditional Chinese Medicine, Heze 274900, China
Figures & Tables
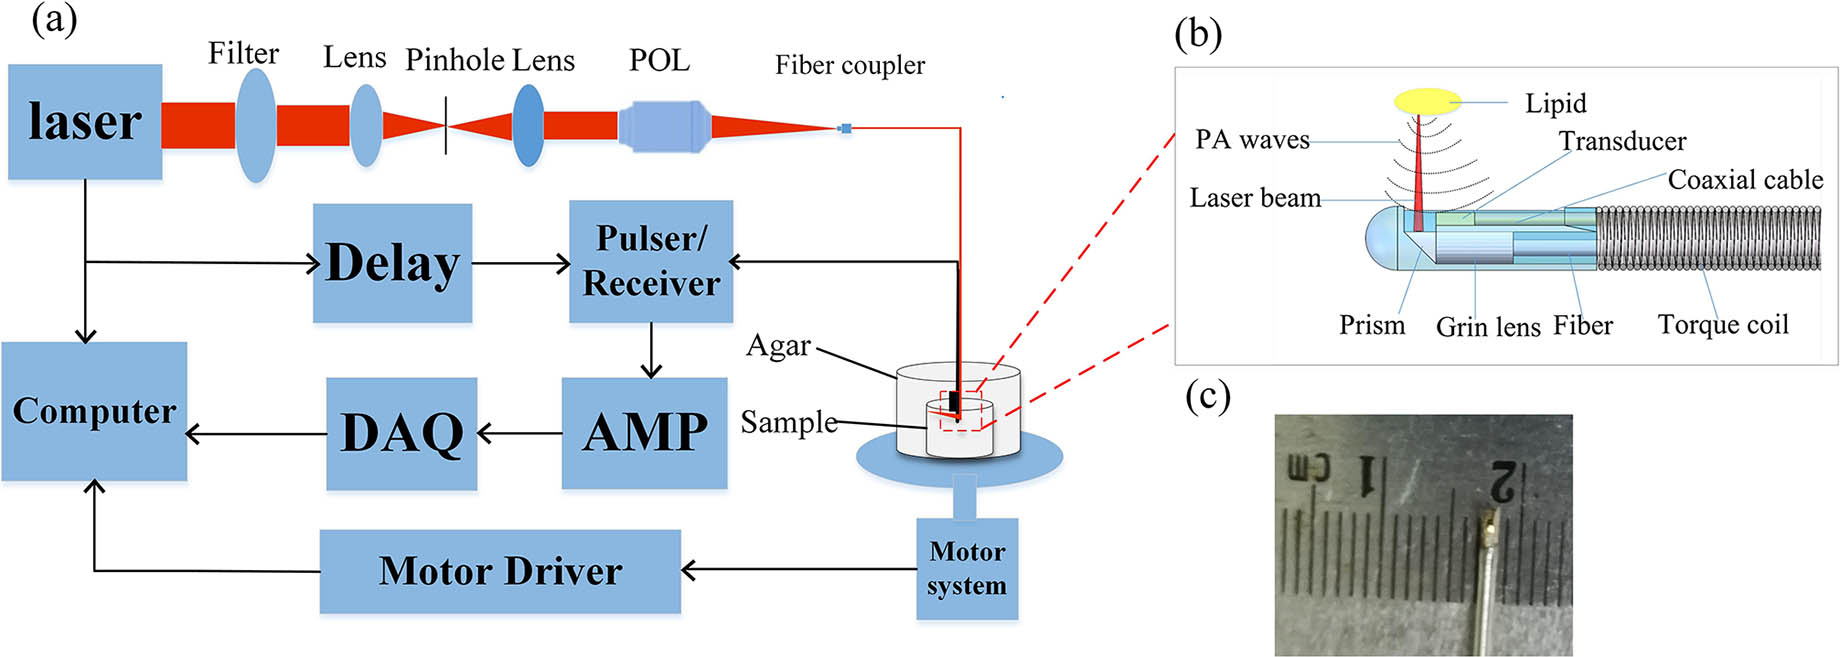
Fig. 1. Schematic of the system and photograph of the devices. (a) Schematic of the system: POL, plan objective lens; AMP, amplifier; DAQ, data acquisition system. (b) Schematic of the laser emission and PA signals reception. (c) Photograph of the integrated transducer.
下载图片 查看原文
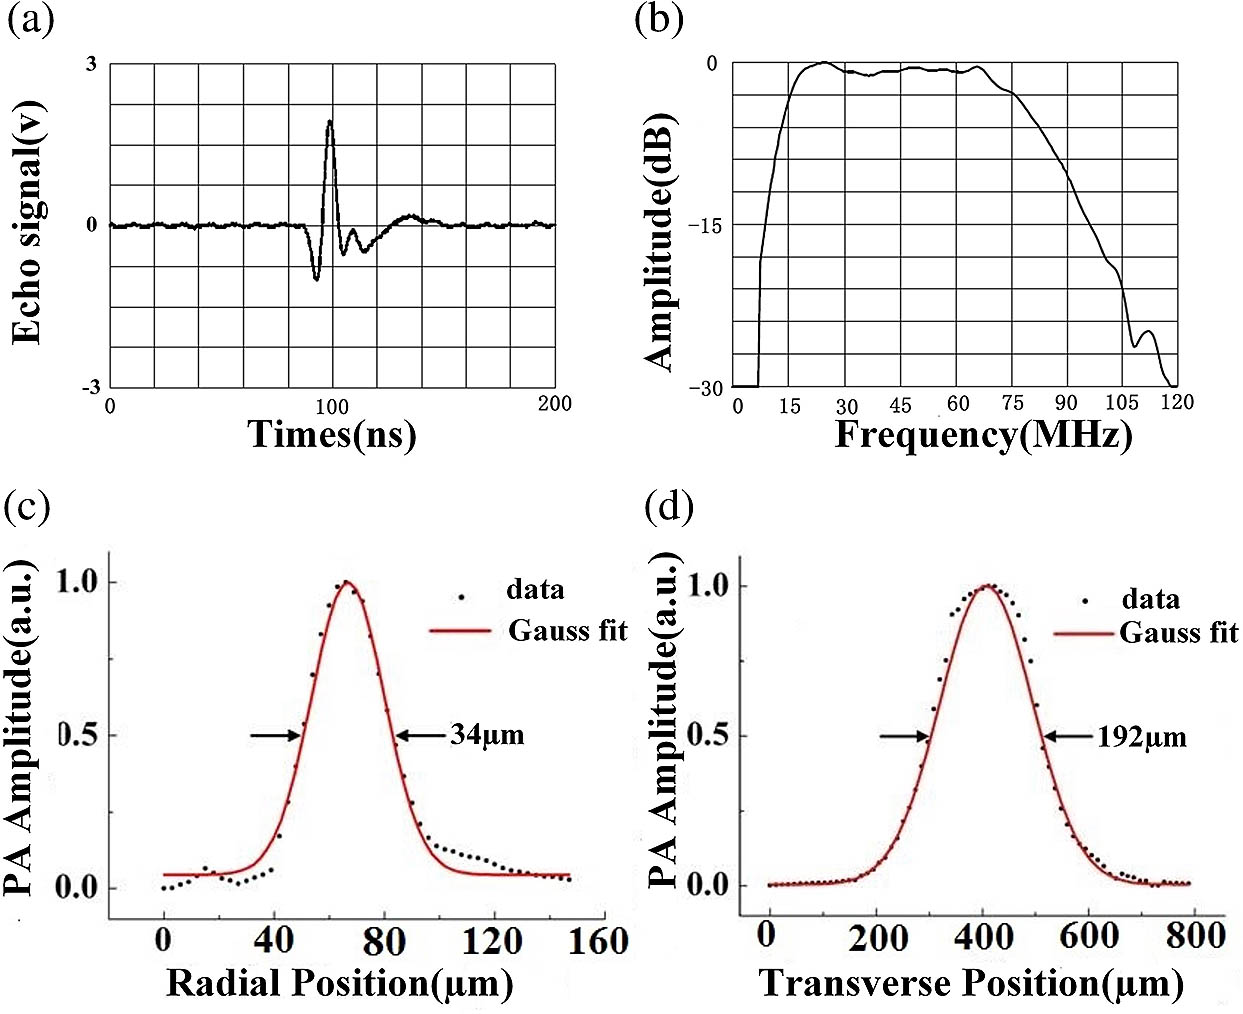
Fig. 2. Performance of the transducer and system. (a) The echo signal detected by the transducer. (b) Bandwidth of the transducer elements with a −6 dB bandwidth of 95%. (c) The axial resolution of the system. (d) The lateral resolution of the system.
下载图片 查看原文
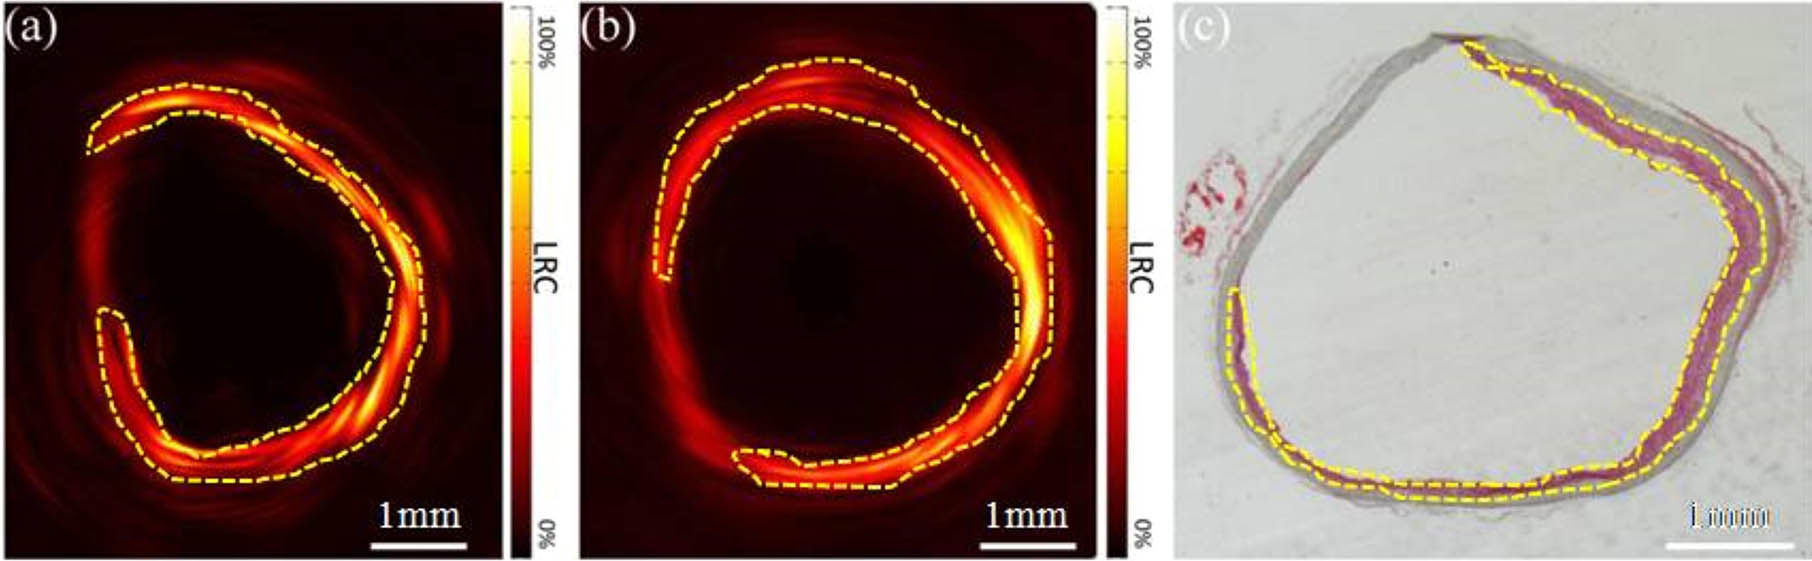
Fig. 3. Comparison of PA images experiencing pre- and post-frozen treatment with histological images. (a) The PA cross-section image of No. 2 vessel before frozen treatment. (b) The PA cross-section image of No. 2 vessel as shown in (a) after frozen treatment. (c) The matched histological cross-section image of No. 2 vessel in (a) and (b). LRC, lipid relative concentration.
下载图片 查看原文
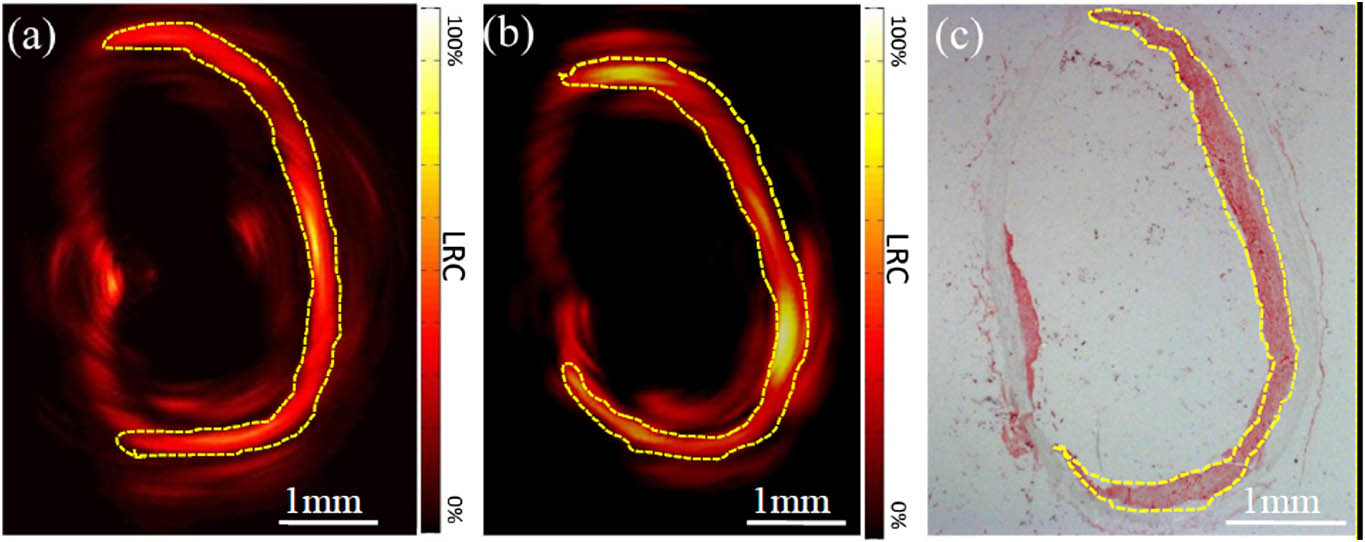
Fig. 4. Comparison of PA images experiencing pre- and post-formaldehyde treatment with histological images. (a) The PA cross-section image of No. 5 vessel before formaldehyde treatment. (b) The PA cross-section image of No. 5 vessel as shown in (a) after formaldehyde treatment. (c) The matched histological cross-section image of No. 5 vessel in (a) and (b).
下载图片 查看原文
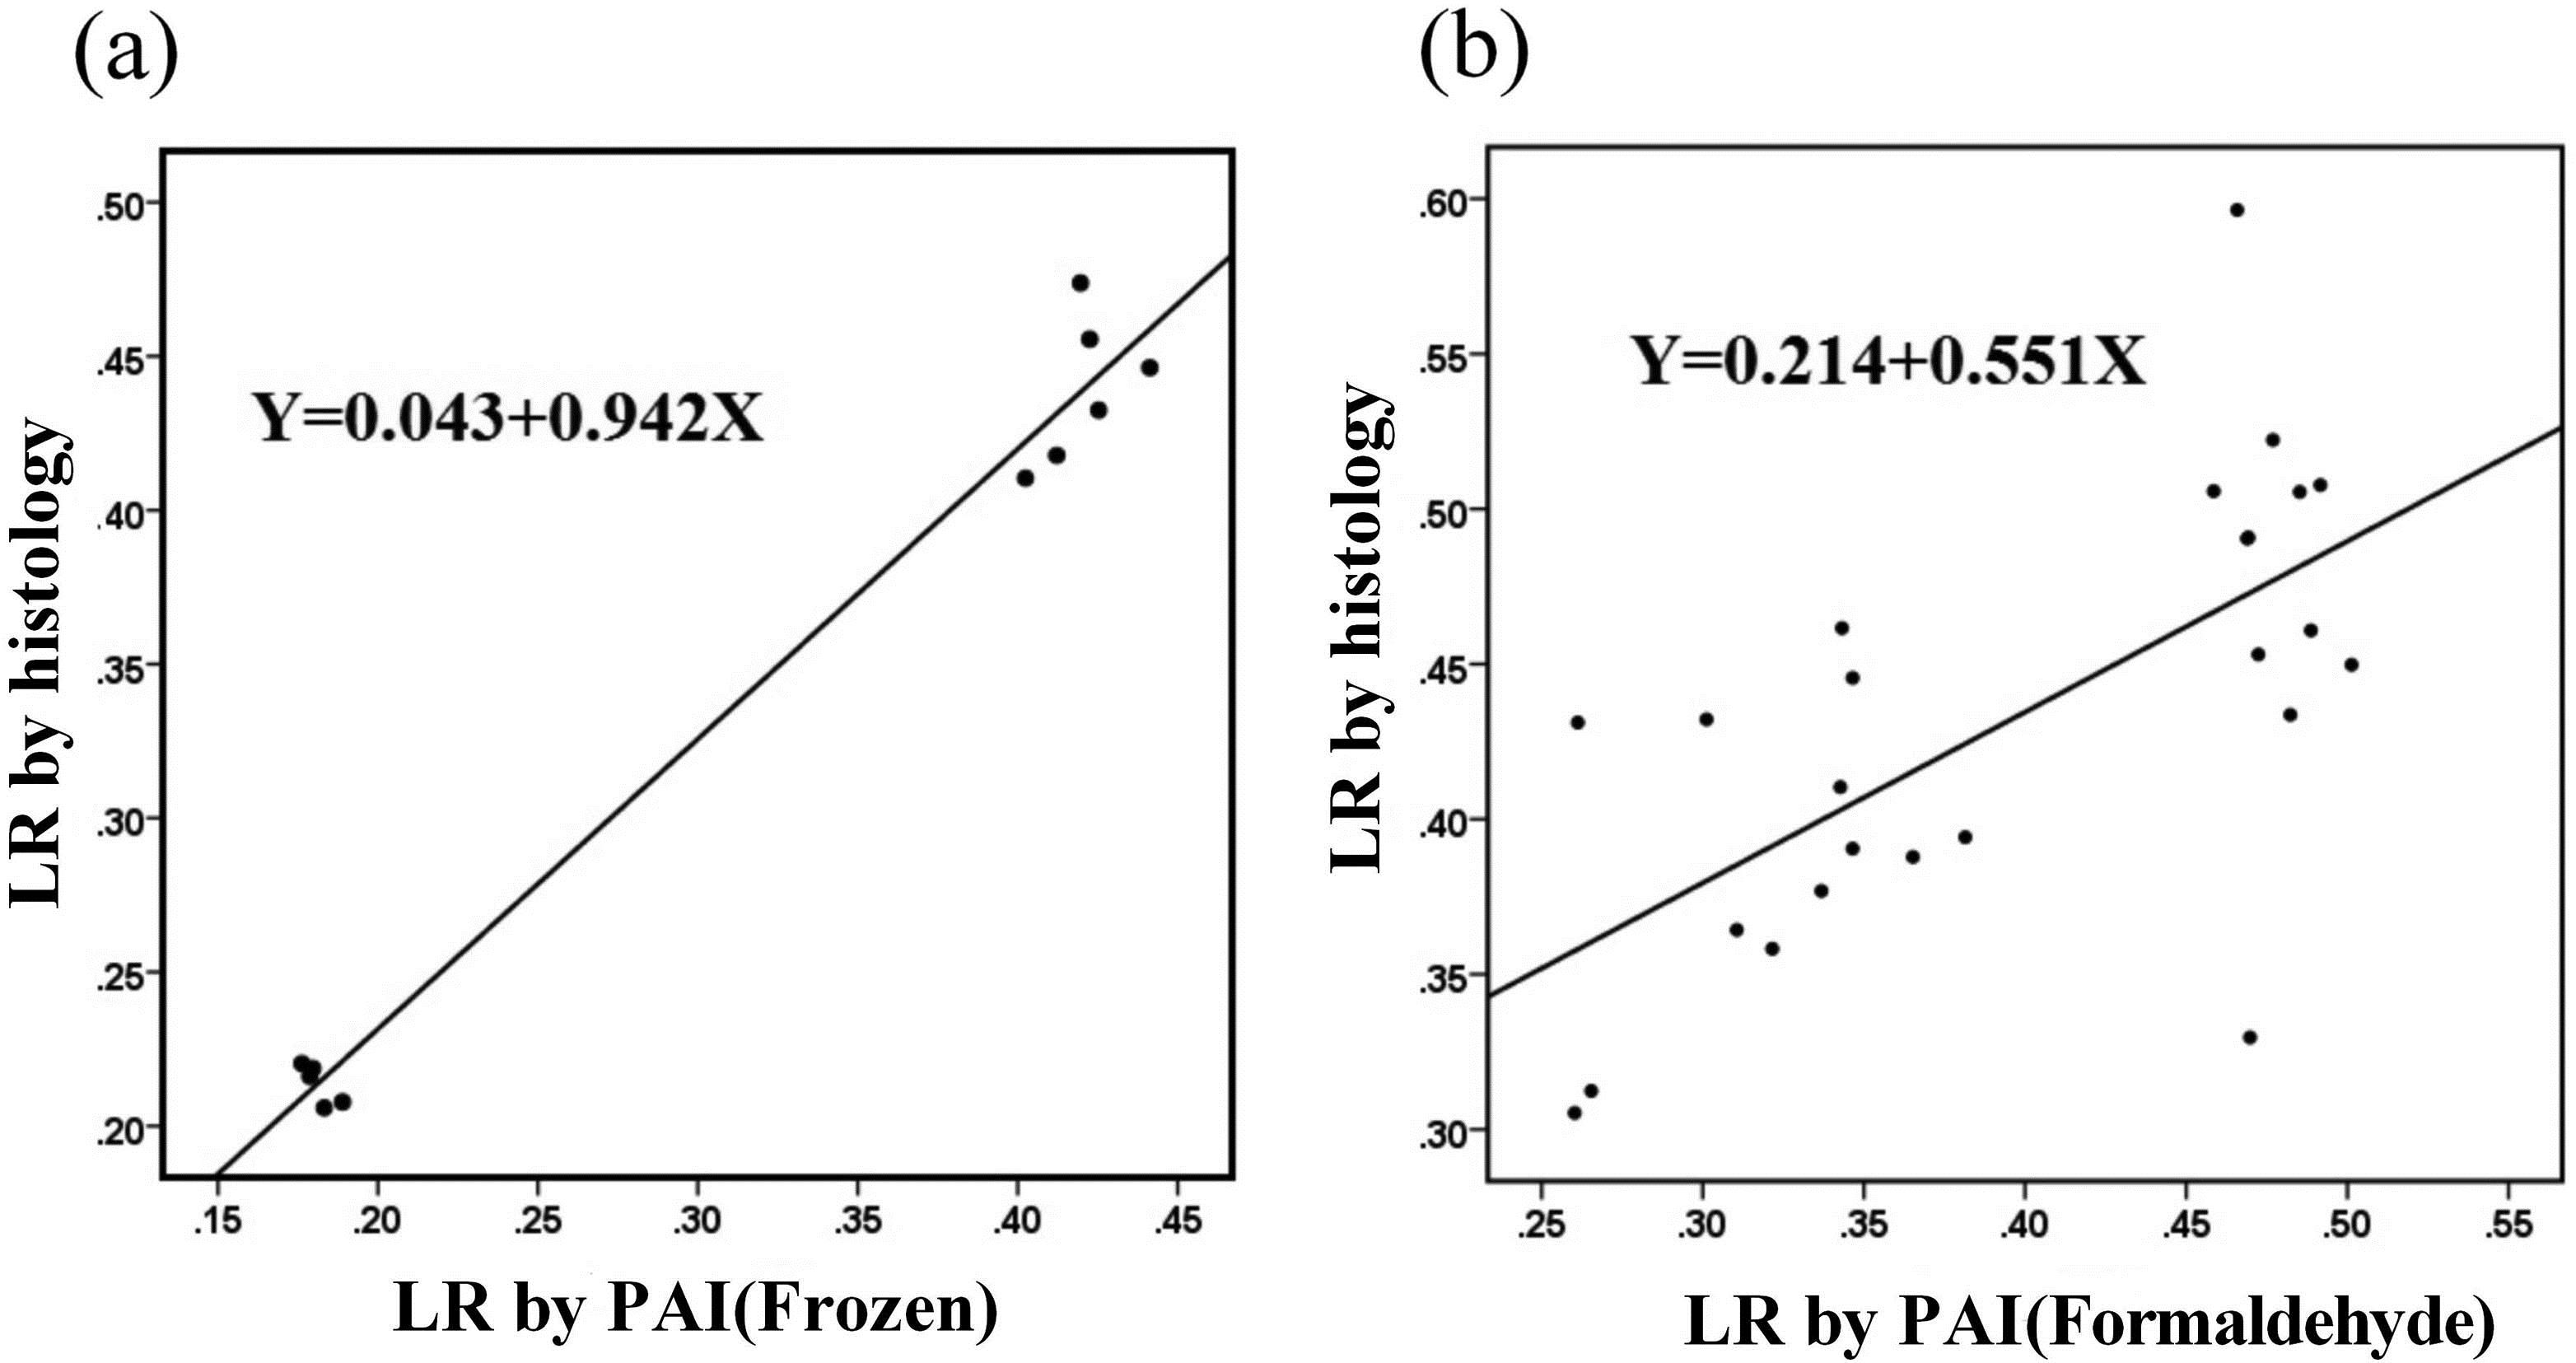
Fig. 5. Statistical analysis results. (a) Correlation between LR by histology and PAI post-frozen treatment, R2=0.942. (b) Correlation between LR by histology and PAI post-formaldehyde treatment, R2=0.551.
下载图片 查看原文
Table1. Difference and Correlation of Lipid Ratio Derived by PAI Pre- and Post-Treatments
| | Difference | Correlation |
|---|
| | Before Treatment | After Treatment | P Value | Pearson Coefficient | P Value |
|---|
| Frozen () | | | 0.299 | 0.990 | 0 | | Formaldehyde () | | | 0.854 | 0.863 | 0 |
|
查看原文
Table2. Correlation of Lipid Ratio Derived by PAI and Histology Pre- and Post-Treatments
| | PA Percentage | Histological Percentage | Correlation |
|---|
| Before processing | | | 0.967 | | After processing | | | 0.853 |
|
查看原文
Table3. Difference and Correlation of Lipid Ratio Derived by PAI and Histology Post-Frozen and Formaldehyde Treatment
| | PAI | Histology | Value | Correlation |
|---|
| Frozen () | | | 0.001 | 0.991 | | Formaldehyde () | | | 0.011 | 0.658 |
|
查看原文
Mingjun Xu, Peng Lei, Jianqin Feng, Fangfang Liu, Sihua Yang, Pengfei Zhang. Photoacoustic characteristics of lipid-rich plaques under ultra-low temperature and formaldehyde treatment[J]. Chinese Optics Letters, 2018, 16(3): 031702.


 PDF全文
PDF全文

