Chinese Optics Letters, 2018, 16 (3): 031702, Published Online: Jul. 13, 2018  

Photoacoustic characteristics of lipid-rich plaques under ultra-low temperature and formaldehyde treatment Download: 714次

Author Affiliations
1 Key Laboratory of Cardiovascular Remodeling and Function Research, Department of Cardiology, Qilu Hospital of Shandong University, Jinan 250012, China
2 MOE Key Laboratory of Laser Life Science and Institute of Laser Life Science, College of Biophotonics, South China Normal University, Guangzhou 510631, China
3 Department of Cardiology, The Juye Hospital of Traditional Chinese Medicine, Heze 274900, China
Abstract
Photoacoustic imaging (PAI) has been used to characterize the spatial and quantitative features of lipid-rich atherosclerotic plaques with high sensitivity and specificity. In this Letter, we first validate that the ultra-low temperature and formaldehyde treatment have no effect on photoacoustic characteristics of the artery samples. Comparative experiments between the PAI and histological results demonstrate that the ultra-low temperature or formaldehyde treatment has few effects on the PAI of the lipid-rich atherosclerotic plaques; the lipid relative concentration and the lipid percentage by PAI hold high correlation with histology.

Acute cardiovascular events, caused by atherosclerotic plaque rupture and subsequent thrombosis, are still the leading cause of mortality and morbidity worldwide. These rupture-prone plaques are deemed as vulnerable plaques, characterized by a large lipid core and thin fibrous cap[1,2]. Clinically available imaging techniques with high spatial resolution in vivo include intravascular ultrasound (IVUS) and intravascular optical coherence tomography (OCT). IVUS provides adequate imaging depth, yet it lacks the ability of accurate plaque components identification. OCT possesses the highest spatial resolution, but the imaging depth is limited due to light absorption of the blood[3,4]. Moreover, neither technique is precise enough to characterize the lipid component within the plaques[57" target="_self" style="display: inline;">–7]. Photoacoustic imaging (PAI) is an emerging technique capable of providing anatomic, functional, and molecular information about biological tissue, which can provide volumetric images with high optical contrast and high ultrasonic spatial resolution at sufficient imaging depths (up to 1–5 cm). Most important of all, PAI can characterize the lipid component with high sensitivity and specificity[8,9].

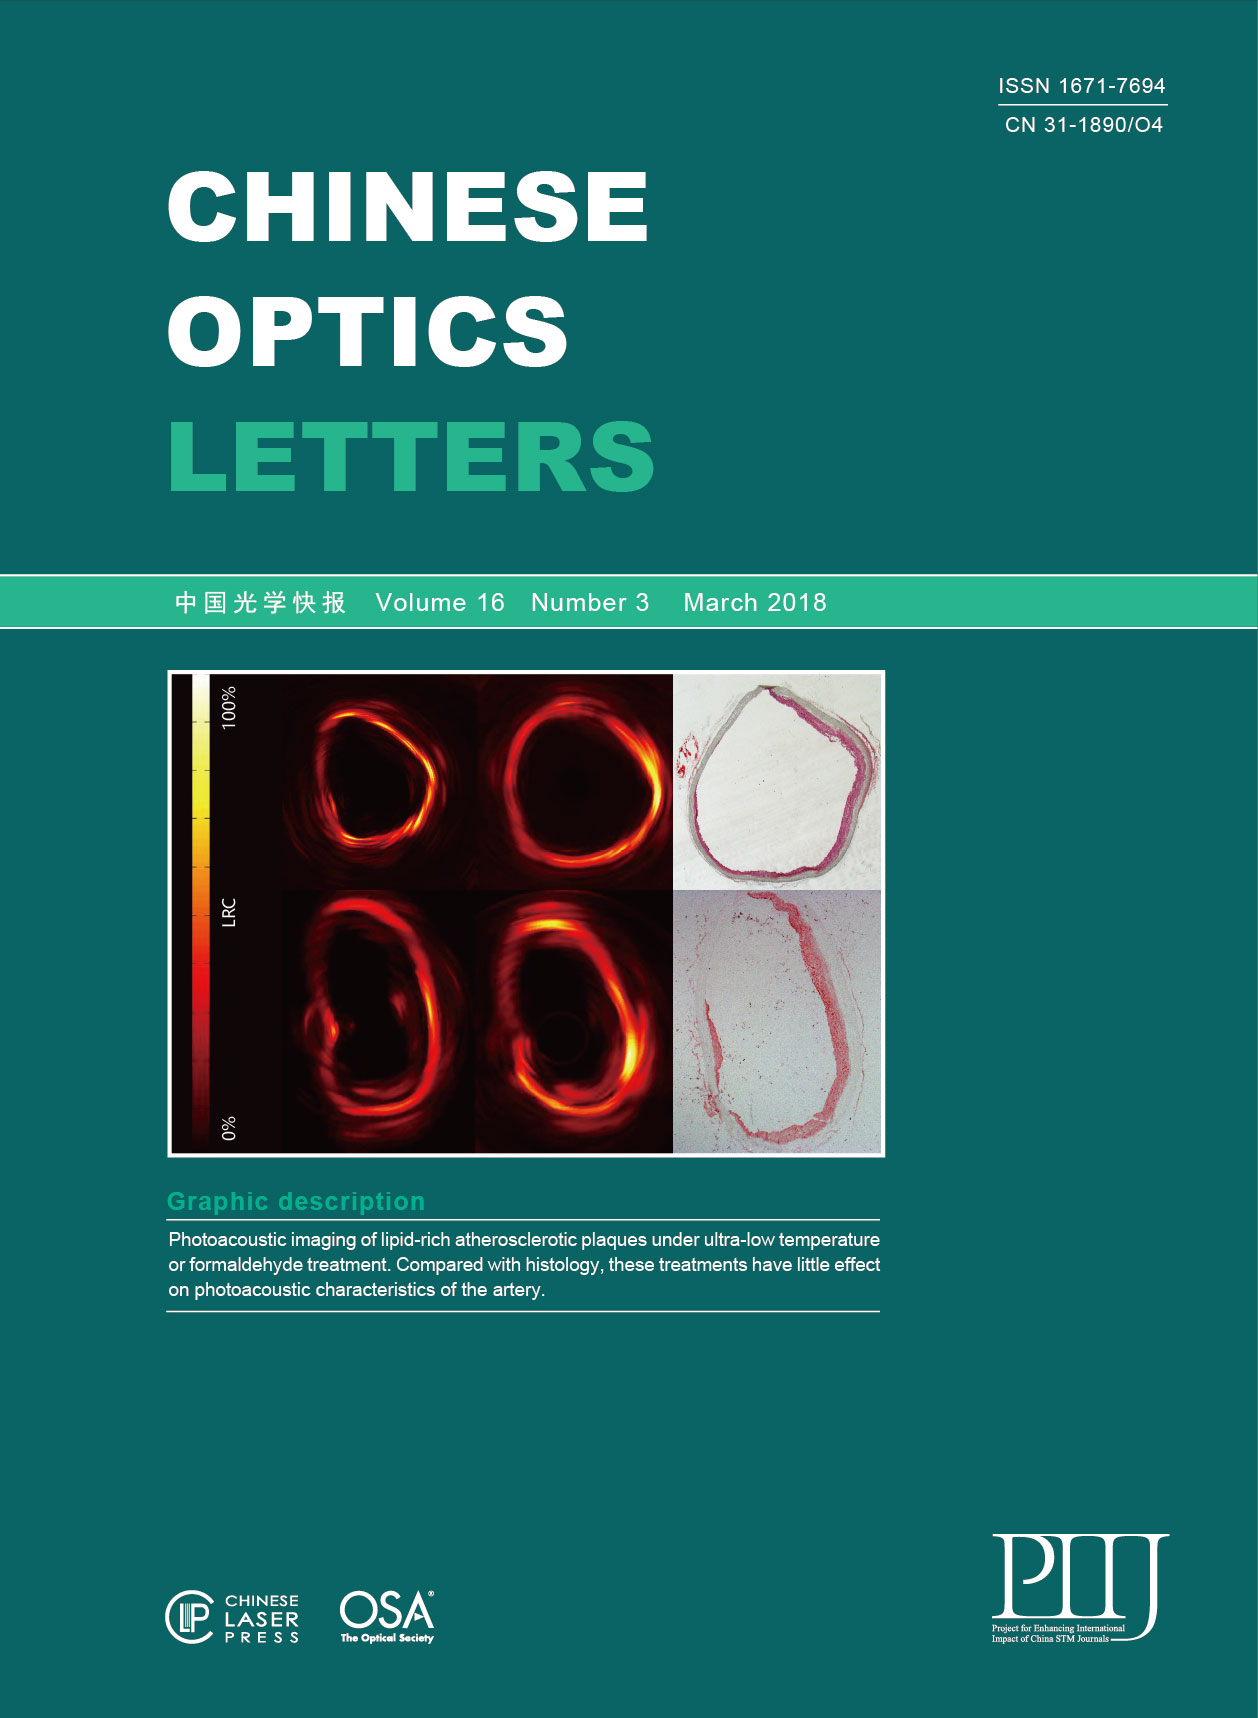
To date, most reports involve samples stored in formaldehyde or under ultra-low temperature. As we know, formaldehyde fixation may lead to lipid loss[10,11], and the freeze–thaw cycle can degenerate proteins and biological molecules. These could alter the photoacoustic (PA) characteristics of the tissues, which might, in turn, cause bias on the results explanation and pre-clinical translational research on PAI. In this Letter, we aim to compare the PAI results before and after these two treatments with histology and the golden standard to validate their effects on artery PA features.

The scheme of the PAI system is shown in Fig. 1. An optical parametric oscillator (OPO) laser (VIBRANT B 532I, OPOTEK, USA) delivering 10 ns laser pulses with a repetition rate of 10 Hz is used to excite PA signals. The laser beam is first filtered by a filter (FEL0650, Thorlabs, USA), then the laser passes through a 50 μm pinhole for spatial filtering, a plan objective lens (4X, Olympus, Japan) is used to focus the laser into a multimode fiber, and a customized graded-index (GRIN) lens (GrinTech, Germany) of 0.5 mm in diameter is used to focus the laser by the end of the multimode fiber; then, the laser beam is delivered onto the sample by a mirror with an angle of 45°, which is coated with a silver membrane. The PA signal, collected by the single transducer (0.5mm×0.6mm×0.2mm dimensions, 45 MHz central frequency, 95%, 6dB bandwidth, single element, DOPPLER, China), is first amplified by the preamplifier (5073PR, Olympus, USA), then amplified 20 dB with an amplifier (ZFL-500, Mini Circuits, USA), digitized and collected by a high-speed data acquisition card (M-3i. 4110, Spectrum, Germany) at a sampling rate of 100 MHz, and finally stored in the computer. The acquired PA signals are post-processed for image display. All the processes mentioned above are controlled by a LabVIEW program on the computer.

Fig. 1. Schematic of the system and photograph of the devices. (a) Schematic of the system: POL, plan objective lens; AMP, amplifier; DAQ, data acquisition system. (b) Schematic of the laser emission and PA signals reception. (c) Photograph of the integrated transducer.

下载图片 查看所有图片

The atherosclerotic rabbit model was established according to our previous reports[12,13]. Briefly, male New Zealand white rabbits with 2 kg in weight were fed with atherogenic diet (1% cholesterol) and underwent balloon-induced abdomen aorta endothelial denudation by a 4 Fr balloon catheter through the right femoral artery. The high cholesterol diet was conducted for 20 weeks successively. After sacrificed by euthanasia, the abdomen aorta was excised and divided into six equal 1-cm-long segments and numbered from 1–6. All animal care and experimental protocols complied with the Animal Management Rule of the Ministry of Public Health, People’s Republic of China and were approved by the Animal Care Committee of Shandong University.

As is well-known, the blood shows strong optical absorption in the range 400–600 nm, and water-rich tissue greatly absorbs the energy of light from 900 nm to the far-infrared range. Light in a narrow range of 600–900 nm can effectively avoid the strong absorption, which is known as an optical window for biomedical imaging. A pulsed laser at 760 and 780 nm wavelengths was used for vascular sample imaging[1421" target="_self" style="display: inline;">21].

The vessel-mimic agar phantom was fixed in an electric displacement platform for supporting the artery segments placed within it. The high-frequency ultrasound transducer was used to collect PA signals. The performance of the transducer is shown in Fig. 2. 400 A lines were acquired to reconstruct a cross-sectional dual-wavelength PAI image. The imaging planes were moved from the top of the artery to the bottom axially with the spatial distance of 50 μm by use of an axial motor (C7826-9012 K, Oriental Motor, Japan). Each artery provided seven imaging planes. After marking the bottom of each segment, numbers 1–3 artery segments were stored in an ultra-low temperature (80°C) refrigerator (902-ULTS, Thermo, USA), and numbers 4–6 artery segments were immersed in 4% formaldehyde. One week later, the six segments were retrieved and imaged again according to the protocol mentioned above. The top of each artery segment was assured with the marker on the bottom. Thus, imaging planes were matched to those before treatment at the same 50 μm distance from the top. All of the PAI experiments of pre/post-ultra-low temperature treatment and pre/post-formaldehyde treatment were conducted at the same room temperature (25°C).

Fig. 2. Performance of the transducer and system. (a) The echo signal detected by the transducer. (b) Bandwidth of the transducer elements with a 6dB bandwidth of 95%. (c) The axial resolution of the system. (d) The lateral resolution of the system.

下载图片 查看所有图片

To prove the spatial resolution of the system, a 20 μm diameter carbon fiber was immersed in the inner surface of a gelatin phantom, the PAI of the carbon fiber has been done, and, according to the PA image, the experimental data of the imaged carbon fiber was plotted along its axial and lateral directions, respectively. The dotted lines were then fitted with Gaussian functions to estimate the radial and transverse resolutions of PAI. Based on the full width at half-maximum (FWHM) of the fitted functions, the axial resolution is estimated to be 34 μm, while the lateral resolution is 192 μm, as shown in Figs. 2(c) and 2(d).

Artery segments were frozen and histological slices were prepared with the thickness of 5 μm for oil-red O staining. Slides were scanned by microscope (Olympus BX53; Olympus, Japan). The positive staining areas, which indicate the lipid components, were measured and quantified by the index lipid ratio (LR), expressed as the percentage of the stained area divided by the plaque area with the Image-Pro Plus (IPP) software (Image-Pro Plus 6.0, Media Cybernetics)[22,23].

PA images were also analyzed by the IPP software to calculate the LR index. Pixels of the lipid signal (A) in the PA images and those of the plaque (B) were counted, respectively. The LR index was calculated by the formula A/(A+B). Statistical analysis was conducted by SPSS 19.0 (SPSS Inc., Chicago, USA). Quantitative data are presented as mean±standard deviation (SD). A paired t test was used to compare the differences of LR before and after treatment or differences of LR derived from PAI and histological analysis. The Pearson correlation was used to test the relationship and agreement of the PAI and histology. P0.05 was considered statistically significant.

The lipid component can be clearly identified on PA images, which correlated very well with histology. Numbers 1–3 artery segments were treated by an ultra-low temperature. Although the lipid contents quantified by the PAI tended to decrease after such treatment, the LR index did not differ from pre- to post-treatment significantly (P>0.05, Table 1). Taking the number 2 artery segment, for example (Fig. 3), the lipid signals could be detected from 11 o’clock to 9 o’clock on the PA image, occupying an almost 270° arch. After the ultra-low temperature treatment, lipid signals could also be detected in the same area as illustrated by the yellow dash in Figs. 3(a) and 3(b). These lipid-containing areas corresponded to the oil red O staining area on histological images. The LR index measured by PAI correlated well with that by histology, as evidenced from the Pearson correlation (Table 3 and Fig. 5).

Table 1. Difference and Correlation of Lipid Ratio Derived by PAI Pre- and Post-Treatments

 DifferenceCorrelation
 Before TreatmentAfter TreatmentP ValuePearson CoefficientP Value
Frozen (N=13)0.334±0.1300.329±0.1220.2990.9900
Formaldehyde (N=19)0.317±0.0450.316±0.0400.8540.8630

查看所有表

Fig. 3. Comparison of PA images experiencing pre- and post-frozen treatment with histological images. (a) The PA cross-section image of No. 2 vessel before frozen treatment. (b) The PA cross-section image of No. 2 vessel as shown in (a) after frozen treatment. (c) The matched histological cross-section image of No. 2 vessel in (a) and (b). LRC, lipid relative concentration.

下载图片 查看所有图片

Numbers 4–6 artery segments were treated with formaldehyde. As illustrated in Fig. 4, the lipid components could be identified by PAI regardless of the treatment. The lipid signals correlate well with histological staining.

Fig. 4. Comparison of PA images experiencing pre- and post-formaldehyde treatment with histological images. (a) The PA cross-section image of No. 5 vessel before formaldehyde treatment. (b) The PA cross-section image of No. 5 vessel as shown in (a) after formaldehyde treatment. (c) The matched histological cross-section image of No. 5 vessel in (a) and (b).

下载图片 查看所有图片

Fig. 5. Statistical analysis results. (a) Correlation between LR by histology and PAI post-frozen treatment, R2=0.942. (b) Correlation between LR by histology and PAI post-formaldehyde treatment, R2=0.551.

下载图片 查看所有图片

Although lipid contents quantified by the PAI tended to decrease after such treatment, the LR index did not differ from pre- to post-treatment significantly (P > 0.05, Table 1).The correlation of the LR derived by the PAI and histology pre- and post-treatment were shown in Table 2. LR index measured by PAI correlated well with that by histology, as evidenced from Pearson correlation (Table 3 and Fig. 5). There is a good correlation between PAI and histology, demonstrating that PAI is a potentially ideal tool to evaluate lipid components in atherosclerotic plaque, which is pivotal to vulnerable plaques responsible for acute coronary events.

Table 2. Correlation of Lipid Ratio Derived by PAI and Histology Pre- and Post-Treatments

 PA PercentageHistological PercentageCorrelation
Before processing0.300±0.0970.332±0.0860.967
After processing0.371±0.1050.403±0.0970.853

查看所有表

Moreover, differences and correlations of LR derived by PAI and histology after different treatments were further explored in Table 3 and Fig. 5. LRs derived by PAI were smaller than by histology; this might be due to limited image depth and is in accordance with a previous study reported by Wang et al.[21].

Table 3. Difference and Correlation of Lipid Ratio Derived by PAI and Histology Post-Frozen and Formaldehyde Treatment

 PAIHistologyP ValueCorrelation
Frozen (N=11)0.312±0.1250.370±0.1190.0010.991
Formaldehyde (N=25)0.397±0.0850.433±0.0710.0110.658

查看所有表

Although the LR indices from pre- and post-treatment PAI agreed with each other, the correlation coefficient after the formaldehyde treatment is reduced to 0.658 (Table 3). But, good correlation between the PAI and the histology is observed (Fig. 5).

In this study, we found that ultra-low temperature or formaldehyde treatment has few effects on lipid characterization by PAI. As we know, formaldehyde fixation may lead to lipid loss[24]. However, Donato et al. found that the fixation of cells with formaldehyde was ideal for the study of lipid droplets because the cells retain their lipid content, and their lipid droplet structure is unaffected[25,26], which is in accordance with our conclusion. It is reported that freezing may destroy the fat globule, leading to a reduction on the fat content measurement of donor human milk[27,28]. In our study, there is only a slight tendency for the lipid percentage to reduce after ultra-low temperature freezing. This might be due to the huge histological difference of rabbit abdominal aorta and human breast milk.

We validate that neither ultra-low temperature nor formaldehyde treatment has an effect on the PA characteristics of arteries acquired from the atherosclerotic rabbit model. PAI holds high accuracy of lipid identification compared to histology.

References

[1] CelermajerD. S.ChowC. K.MarijonE.AnsteyN. M.WooK. S., J. Am. Coll. Cardiol.60, 1207 (2012).JACCDI0735-1097

[2] FinnV.NakanoM.NarulaJ.KolodgieF. D.VirmaniR., Arterioscler. Thromb. Vasc. Biol.30, 1282 (2010).ATVBFA1079-5642

[3] JangI. K.BoumaB. E.KangD. H.ParkS. J.ParkS. W.SeungK. B.ChoiK. B.ShishkovM.SchlendorfK.PomerantsevE., Am. Coll. Cardiol.39, 604 (2002).

[4] VirmaniR.BurkeA. P.FarbA.KolodgieF. D., J. Am. Coll. Cardiol.47, C13 (2006).JACCDI0735-1097

[5] WeiW.LiX.ZhouQ.ShungK. K.ChenZ., J. Biomed. Opt.16, 106001 (2011).JBOPFO1083-3668

[6] EgodageK.MatthäusC.DochowS.SchieI. W.HärdtnerC.HilgendorfI.PoppJ., Chin. Opt. Lett.15, 090008 (2017).CJOEE31671-7694

[7] Rico-JimenezJ. J.Campos-DelgadoD. U.VilligerM.OtsukaK.BoumaB. E.JoJ. A., Biomed. Opt. Express7, 4069 (2016).

[8] WangL. V.HuS., Science335, 1458 (2012).SCIEAS0036-8075

[9] HuS.YanP.MaslovK.LeeJ. M.WangL. V., Opt. Lett.34, 3899 (2009).OPLEDP0146-9592

[10] DallamR. D., J. Histochem. Cytochem.5, 178 (1957).JHCYAS0022-1554

[11] HeslingaF. J. M.DcierkaufF. A., J. Histochem. Cytochem.9, 572 (1961).JHCYAS0022-1554

[12] ZhangL.LiuY.LuX. T., Am. J. Physiol. Heart Circ. Physiol.297, H2004 (2009).

[13] HuX. B.ZhangP. F.SuH. J., Ultrasound Med. Biol.37, 1579 (2011).USMBA30301-5629

[14] YeM.CaoM.YuanJ.ChenY. D.ChengQ.TaoC.LiuX. J.XuG.WangX. D., Chin. Opt. Lett.14, 081701 (2016).CJOEE31671-7694

[15] ZhangJ.YangS. H.JiX. R.ZhouQ.XingD., J. Am. Coll. Cardiol.64, 385 (2014).JACCDI0735-1097

[16] LinX. W.SunM. J.FengN. Z.HuD. P.ShenY., Chin. Opt. Lett.15, 111701 (2017).CJOEE31671-7694

[17] JiX.XiongK.YangS.XingD., Opt. Express.23, 9130 (2015).OPEXFF1094-4087

[18] HuJ.YuM. L.YeF.XingD., J. Biomed. Opt.16, 020503 (2011).JBOPFO1083-3668

[19] ZhaoY.YangS.ChenC.XingD., Opt. Lett.39, 2565 (2014).OPLEDP0146-9592

[20] WangB.KarpioukA.YeagerD.AmirianJ.LitovskyS.SmallingR.EmelianovS., Ultrasound. Med. Biol.38, 2098 (2012).USMBA30301-5629

[21] WangB.SuJ. L.AmirianJ.LitovskyS. H.SmallingR.EmelianovS., Opt. Express18, 4889 (2010).OPEXFF1094-4087

[22] Andrés-ManzanoM. J.AndrésV.DoradoB., Methods Mol. Biol.13, 85 (2015).

[23] DeutschM. J.SchrieverS. C.RoscherA. A.EnsenauerR., Anal Biochem.15, 445 (2014).

[24] LeistD. P.NettlettonG. S.FeldhoffR. C., J. Histochem. Cytochem.34, 437 (1986).JHCYAS0022-1554

[25] BoskeyA. L.CohenM. L.BulloughP. G., Calcif. Tissue Int.34, 328 (1982).CTINDZ0171-967X

[26] DonatoD. D.BrasaemleD. L., J. Histochem. Cytochem.51, 773 (2003).JHCYAS0022-1554

[27] Vázquez-RománS.Alonso-DíazC.García-LaraN. R.Escuder-ViecoD.Pallás-AlonsoC. R., AnPediatr (Barc)81, 185 (2014).

[28] LevH. M.OventalA.MandelD.MimouniF. B.MaromR.LubetzkyR., J. Perinatol.34, 396 (2014).JOPEEI0743-8346

Mingjun Xu, Peng Lei, Jianqin Feng, Fangfang Liu, Sihua Yang, Pengfei Zhang. Photoacoustic characteristics of lipid-rich plaques under ultra-low temperature and formaldehyde treatment[J]. Chinese Optics Letters, 2018, 16(3): 031702.

引用该论文: TXT   |   EndNote

相关论文

加载中...

关于本站 Cookie 的使用提示

中国光学期刊网使用基于 cookie 的技术来更好地为您提供各项服务,点击此处了解我们的隐私策略。 如您需继续使用本网站,请您授权我们使用本地 cookie 来保存部分信息。
全站搜索
您最值得信赖的光电行业旗舰网络服务平台!