Chinese Optics Letters, 2016, 14 (2): 021101, Published Online: Sep. 21, 2018
Effect of time bin size on accuracy of streak tube imaging lidar  Download: 953次
Figures & Tables
Fig. 1. (a) Schematic diagram of the STIL data collection process, (b) illustration of the work principle of the streak tube detector, and (c) the streak image at the phosphor screen, as captured by the CCD.

Fig. 2. Simulated dependence of range error on the time bin size. The simulation parameters are τ laser = 1 ns SNR = 27.5 t ¯ = 10 m N = 1000

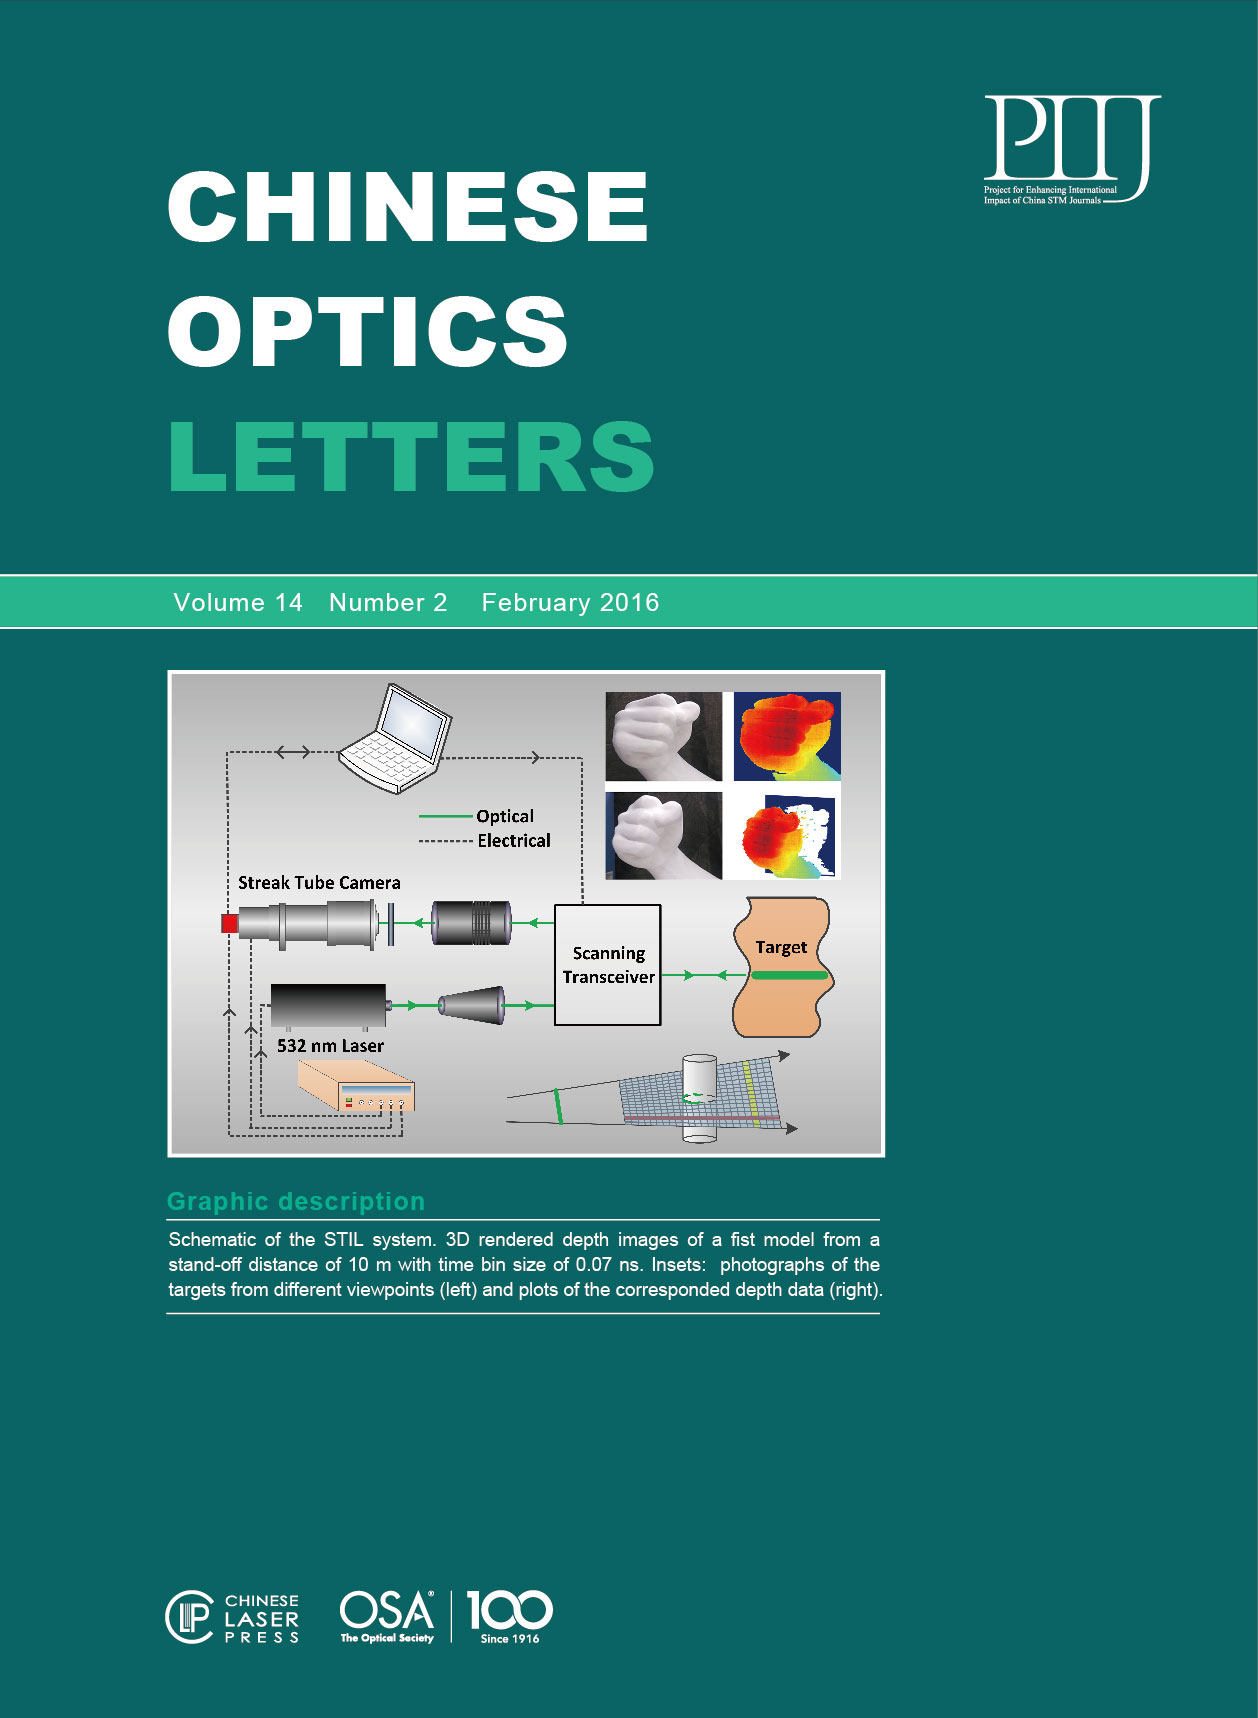
Fig. 3. Schematic of the STIL system based on the 532 nm wavelength illumination and a streak tube camera detector.


Fig. 5. Dependence curves between the range error and time bin size obtained for the indoor experiments, analytical estimate, and simulation result.

Fig. 6. 3D-rendered depth images of a fist model from a stand-off distance of 10 m, using different time bin sizes. The close-up photographs in column (a) are different viewpoints of the target that was scanned. Plots of the depth data obtained for time bin sizes of 0.07, 0.18, 0.36, and 0.78 ns are shown in columns (b) to (e); each of these columns show three different viewpoints.

Guangchao Ye, Rongwei Fan, Zhaodong Chen, Xinrui Xu, Ping He, Deying Chen. Effect of time bin size on accuracy of streak tube imaging lidar[J]. Chinese Optics Letters, 2016, 14(2): 021101.


 PDF全文
PDF全文

