Chinese Optics Letters, 2018, 16 (1): 010606, Published Online: Jul. 17, 2018  

Demodulation method combining virtual reference interferometry and minimum mean square error for fiber-optic Fabry–Perot sensors Download: 815次

Author Affiliations
1 National Engineering Laboratory for Fiber Optic Sensing Technology, Wuhan University of Technology, Wuhan 430070, China
2 Key Laboratory of Fiber Optic Sensing Technology and Information Processing, Ministry of Education, Wuhan University of Technology, Wuhan 430070, China
3 Department of Electrical and Computer Engineering, University of Toronto, Toronto M5S-3G4, Canada
Abstract
We propose a cavity length demodulation method that combines virtual reference interferometry (VRI) and minimum mean square error (MMSE) algorithm for fiber-optic Fabry–Perot (F-P) sensors. In contrast to the conventional demodulating method that uses fast Fourier transform (FFT) for cavity length estimation, our method employs the VRI technique to obtain a raw cavity length, which is further refined by the MMSE algorithm. As an experimental demonstration, a fiber-optic F-P sensor based on a sapphire wafer is fabricated for temperature sensing. The VRI-MMSE method is employed to interrogate cavity lengths of the sensor under different temperatures ranging from 28°C to 1000°C. It eliminates the “mode jumping” problem in the FFT-MMSE method and obtains a precision of 4.8 nm, corresponding to a temperature resolution of 2.0°C over a range of 1000°C. The experimental results reveal that the proposed method provides a promising, high precision alternative for demodulating fiber-optic F-P sensors.

Fiber-optic sensors have been widely employed for the advantages of simple structure, high sensitivity, freedom from electromagnetic interference, and suitability for harsh environments[1,2]. In recent years, fiber-optic high temperature sensors have received widespread attention. Various high temperature sensors based on long period fiber gratings (LPFG)[3], Fabry–Perot interferometers (FPI)[4,5], and fiber Bragg gratings (FBG)[2] are demonstrated. Because sapphire fibers have a very high melting point, which is the most important performance for the sensing applications at a very high temperature, a lot of Letters presented the sensors combined with Fabry–Perot (F-P) and sapphire fibers. But, the fringe contrast of the sensor output depended on many factors, such as the quality of the silica-to-sapphire fiber splice, the surface roughness of the fiber end, and the F-P surface, which are hard to control.

For obtaining the high precision and resolution of the measurement, a variety of demodulation methods have been developed to extract the cavity length of the F-P sensors accurately through different algorithms. The wavelength tracking method offers high sensitivity. However, it is limited to measuring only relative changes in the F-P cavity length, and the dynamic range is limited as well[6]. The fast Fourier transform (FFT) method is a classic method for cavity length demodulation and is widely used as the first step to obtain raw cavity length estimation. It transforms the signal from an optical wavelength domain to a cavity length domain and gives the raw absolute cavity length. The FFT method is fast, has a wide dynamic range, and is less affected by noise. However, the resolution is much lower than that of the wavelength tracking method[7], and the demodulating precision is limited by the optical frequency range. To circumvent these disadvantages, researchers have to find other algorithms for different experimental environments. Wang et al. used the FFT method to obtain an estimated optical path difference (OPD) and, subsequently, obtained a more accurate value using the frequency estimation algorithm, achieving a resolution of 3.0 nm[8]. A wavelet phase extracting demodulation algorithm was proposed for optical fiber F-P sensing. The FFT method was also used to obtain the estimated cavity length first. This algorithm have the advantage of speed and simplicity[9]. A demodulation system based on the frequency modulated continuous wave (FMCW) technique in an air-gap FPI has a temperature resolution of 0.02°C, which is much higher than the measurement resolution using the traditional wavelength shift detection method[10]. Ying et al. provided a novel algorithm combining the minimum mean square error (MMSE) estimation and the Fibonacci method based on FFT[11]. The resolution achieved using this algorithm is 0.15 nm, and a quick demodulation within 0.03 s is possible[12].

However, the MMSE signal processing method has a serious drawback because there is a problem of “mode jumping” as the demodulated range becomes larger. The demodulated range of the MMSE signal processing method must be limited in one mode (240 nm in our system) to avoid the “mode jumping” problem. This requires that the resolution of the algorithm for obtaining the estimated cavity length be less than half of one mode (120 nm)[12]. Since the resolution of the FFT (over 1 μm) does not meet the requirement, because FFT does not take into account the chromatic dispersion of the F-P cavity, the result of the combined FFT-MMSE method has to be corrected manually.

In this Letter, we propose the use of virtual reference interferometry (VRI) for initial estimation of the cavity length, because it takes the dispersion into account. VRI has been used to measure chromatic dispersion in short fibers and components[13,14] and is capable of extracting first- and second-order dispersion directly from spectral interference (SI) patterns[13]. Our novel demodulating method combines VRI and MMSE for optical fiber F-P sensors. Furthermore, we fabricated an optical fiber F-P high temperature sensor based on a sapphire wafer and obtained the cavity length through the proposed method. The results show that the proposed method can effectively avoid the “mode jumping” problem and achieve the same high precision of MMSE.

The combined VRI-MMSE method includes two parts, i.e., the VRI and the MMSE algorithm. The former is used to obtain an approximate cavity length, and the latter is used to achieve a more exact cavity length.

The principle of VRI is shown in detail in Ref. [13]. A summary of the steps of the demodulating method of the combined VRI-MMSE is now presented. First, a SI pattern is obtained from an FPI. Second, a simulated interference pattern is generated numerically using a virtual reference path. Third, the simulated interference pattern is multiplied (point-by-point) with the real interference pattern to produce a second-order interference pattern. Fourth, the amplitude modulation of the second-order interference pattern is extracted and used it calculate the group delay τg(λ0) by Eq. (1)[13], and the cavity length Lr can be obtained by Eq. (2): τg(λ0)=Ng(λ0)Lrc=Lν(1)(λ0)c,Lr=τg(λ0)cNg(λ0),where Ng(λ0) is the group index of the F-P sensor. The center wavelength λ0 is determined by the second-order interference pattern. Fifth, a more accurate cavity length L can be calculated by the MMSE-based signal processing method. The mean square error (MSE) between the true cavity length L and the estimated value Lr can be expressed as[12]mse(Lr)=1Nn=0N1(IReal(n,L)ILr(n,Lr)),ILr(n,Lr)=r1+r2+2r1r2cos(4πnLrλ0+nΔλ)1+r1+r2+2r1r2cos(4πnLrλ0+nΔλ),where IReal(n,L) is the actual discrete spectral sequence acquired by the spectrometer. ILr(n,Lr) is the analog interference signal, as shown in Eq. (4). N is the number of elements in the discrete spectral sequence. After selecting the appropriate estimation range and step size of the cavity length, we obtain a series of MSE{mse(Lr)} from Eq. (3). The best estimated value of the cavity length corresponds to the Lr, for which the MSE is minimized.

The schematic of our experimental system is shown in Fig. 1. Broadband light from the LED (850 nm) was launched into the 2×2 fiber coupler, and then injected to the sapphire-wafer-based fiber F-P sensor in the high temperature furnace (KSL-1100X). The optical interference spectrum reflected from the F-P sensor was received by the optical spectrum analyzer (OSA, AQ6370 C) via the fiber coupler again, and the output of the OSA was demodulated by the computer.

Fig. 1. Fiber-optic F-P high temperature sensing experimental system based on a sapphire wafer.

下载图片 查看所有图片

In order to evaluate the performance of the VRI-MMSE demodulating method, the system was tested for high temperature sensing. The F-P sensor was placed in the high temperature furnace, and its temperature was set to cover the range of from 28°C to 1000°C at an increment of 100°C. Each temperature was kept for half an hour to ensure a uniform temperature distribution. The measured interference spectra at 28°C, 100°C, and 200°C are shown in Fig. 2, respectively. As shown in Fig. 2, the envelope of each interferogram is the spectral shape of the LED source, and the envelope (background power) has no effect on data processing. For facilitating the following discussion, here, we define the signal-to-noise ratio (SNR) as the ratio of the amplitude of the interference signal to that of the background noise. The SNR of the SI pattern is sufficiently high (inset of Fig. 2) to allow accurate extraction of the cavity length using our method.

Fig. 2. (Color online) Interference spectra at the temperatures of 28°C, 100°C, and 200°C, respectively.

下载图片 查看所有图片

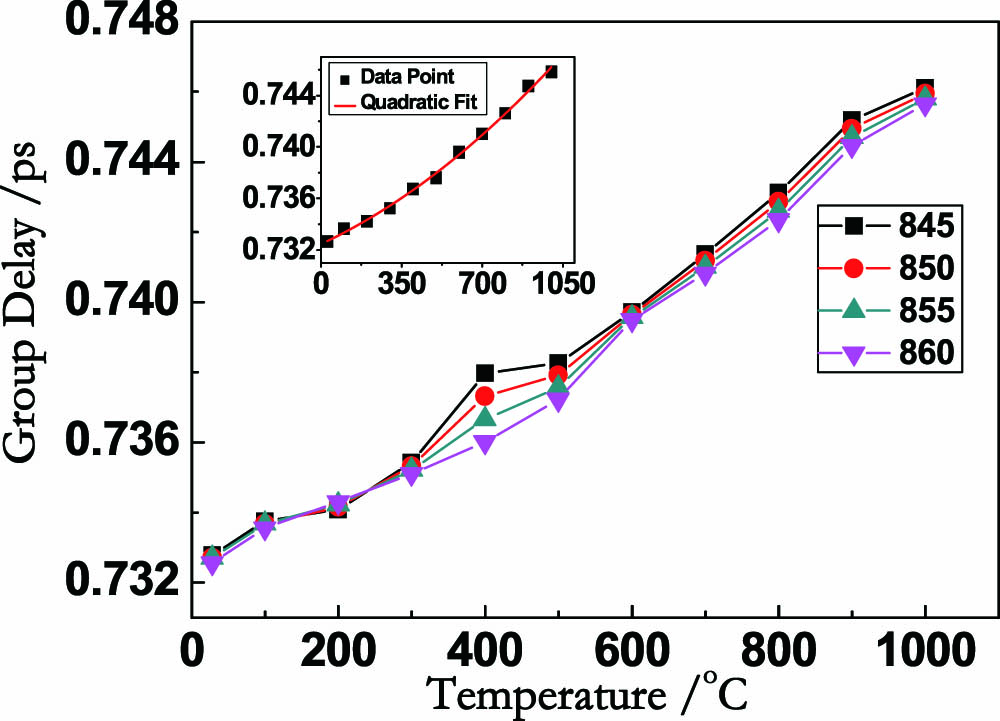
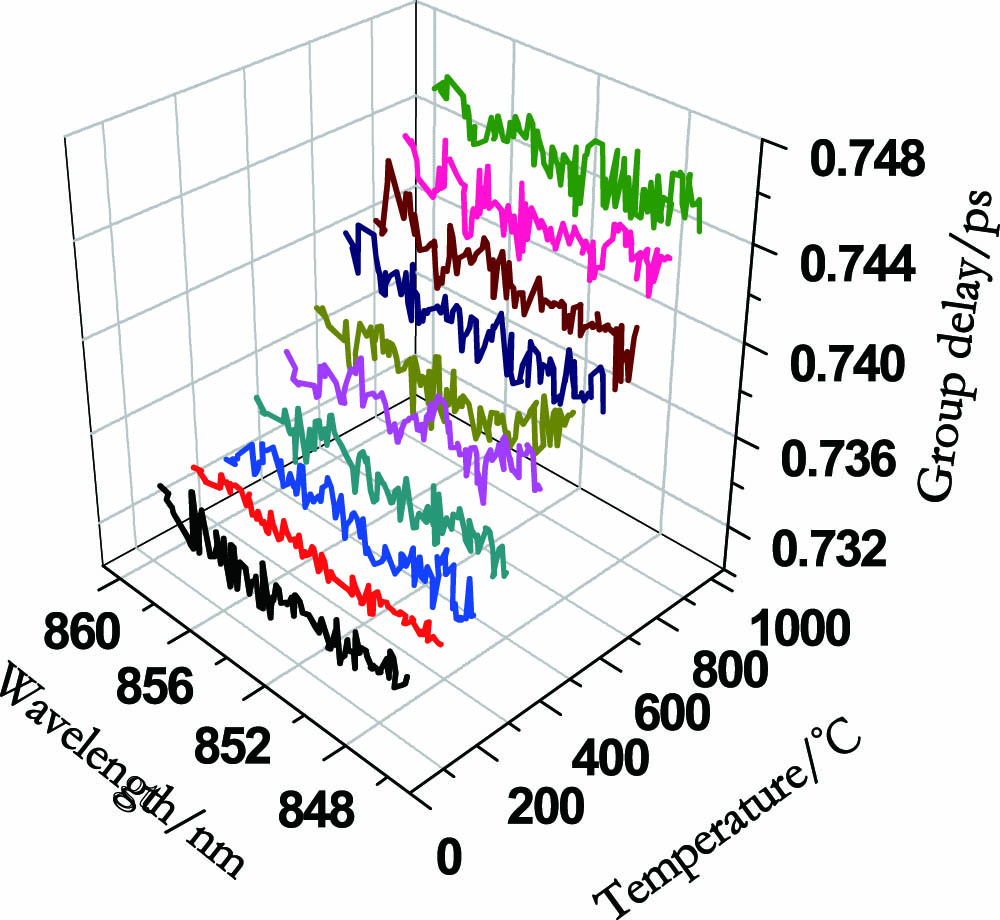
Figure 3 shows the group delay at different temperatures obtained by the VRI process. The group delay at each temperature is represented by a different color line. The group delay is roughly linearly distributed at the same temperature and increases when the temperature increases, as expected. Figure 4 shows the group delay at each temperature point at different wavelengths after linear fitting of the data of Fig. 3. The data points in Fig. 4 are calculated by the fitting formula of the temperature at each wavelength. The group delay is selected when the average error is minimal (at the wavelength 855 nm), as shown in the inset in Fig. 4, from which the Lr can be calculated from Eq. (4). It can be seen from Fig. 4 that the accuracy of the result obtained by using the only VRI processing method is not high. The average error is 43.1 nm (meeting the requirement to avoid the “mode jumping” problem) compared with the real cavity length, which corresponds to the temperature of 18°C, whose performance is much better than that of the FFT. We have to process the data further using some algorithms in order to get accurate measurement results.

Fig. 3. (Color online) Group delay at different temperatures.

下载图片 查看所有图片

Fig. 4. (Color online) Group delay as a function of temperature at different wavelengths.

下载图片 查看所有图片

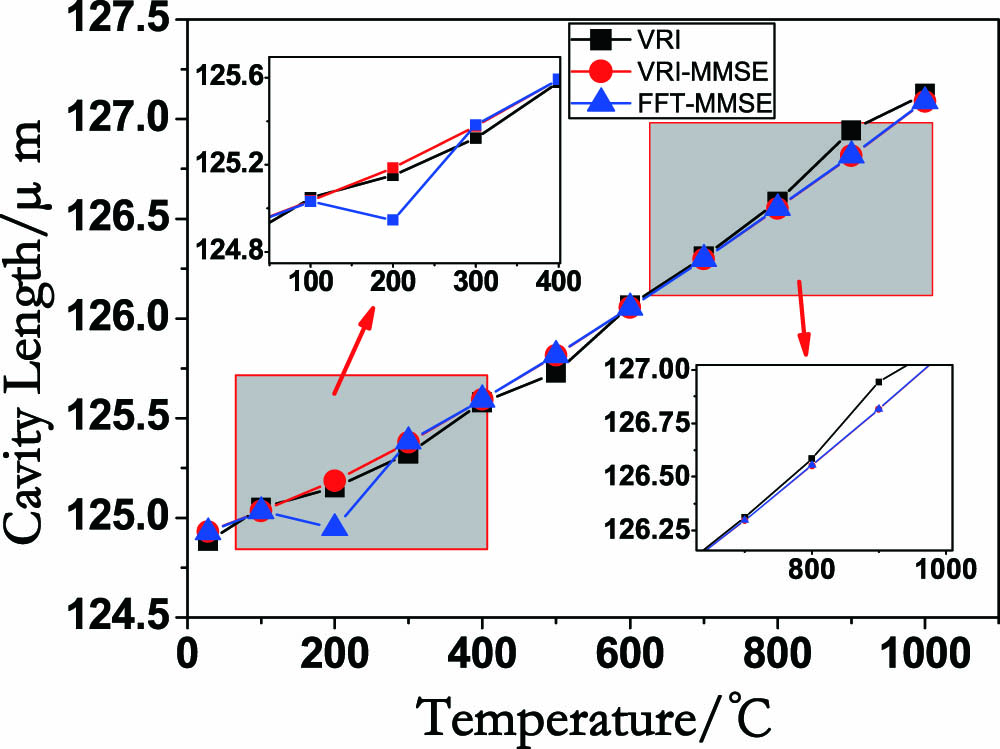
Figure 5 demonstrates the corresponding results obtained by the VRI, FFT-MMSE, and VRI-MMSE demodulating methods, respectively. The cavity length varies linearly with temperature. As shown in the down inset, the line of VRI-MMSE coincides approximately with that of FFT-MMSE, but it is quite different from the result of VRI. So, the VRI-MMSE processing method can reach the same accuracy and resolution as the FFT-MMSE processing method, which is capable of providing subnanometer resolution and demodulation error[11,12]. Obviously, the accuracy of the VRI processing method is not ideal. But, there is a mode jumping point[12] at 200°C in the curve of the FFT-MMSE, which is shown in the top inset. It is clear that the VRI-MMSE processing method solves the problem of the FFT-MMSE’s mode jumping and achieves a high accuracy. The VRI processing method can substitute FFT in our high temperature sensing system.

Fig. 5. (Color online) Corresponding cavity lengths decoded by the methods of VRI, MMSE, and VRI-MMSE.

下载图片 查看所有图片

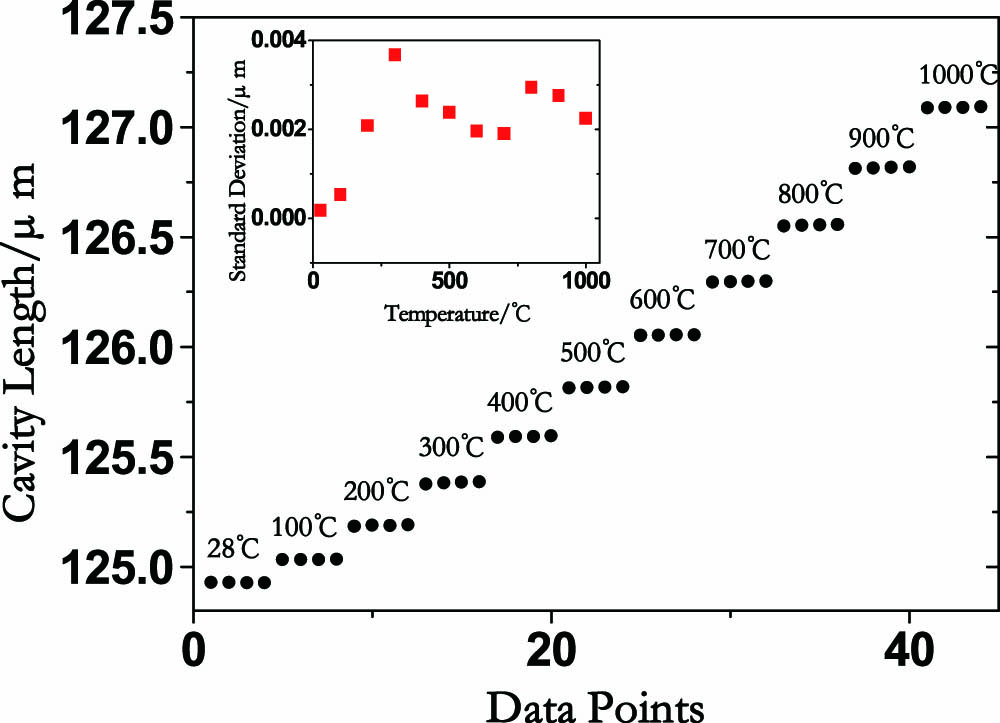
The cavity length was measured experimentally at several temperature levels from 28°C to 1000°C. During the test, 44 spectra were recorded, and the standard deviation at each temperature step was calculated, as shown in Fig. 6. There is a small variation in the F-P spectra repeated at the same temperature, since there was optical noise and electrical interference during the OSA acquisition of the SI pattern. But, we can see that the stability of this processing method is excellent. The average error is 4.8 nm, and the average standard deviation is 2.1 nm. If we define resolution to be twice the standard deviation, then the resolution of this method is 4.2 nm, corresponding to a temperature measurement resolution of 2.0°C, over the measurement range of 1000°C. The resolution achieved here is sufficient for applications such as aviation, aerospace, or metallurgical industry.

Fig. 6. Stability measurement result of the VRI-MMSE processing method.

下载图片 查看所有图片

In conclusion, a demodulation method combining VRI and MMSE for a fiber FPI is proposed and demonstrated. By the high temperature testing experiment, the obtained resolution of the demodulating method is 4.2 nm. Integrating advantages of VRI and the MMSE-based signal processing method, this method achieves a high demodulation resolution and absolute measurement of the cavity length, while it uses VRI instead of FFT to eliminate the mode jump phenomenon of FFT-MMSE at the same time. The proposed method is a novel alternative technology of conventional F-P demodulation based on FFT.

Xinwang Gui, Michael Anthony Galle, Li Qian, Weilong Liang, Ciming Zhou, Yiwen Ou, Dian Fan. Demodulation method combining virtual reference interferometry and minimum mean square error for fiber-optic Fabry–Perot sensors[J]. Chinese Optics Letters, 2018, 16(1): 010606.
引用该论文: TXT   |   EndNote

相关论文

加载中...

关于本站 Cookie 的使用提示

中国光学期刊网使用基于 cookie 的技术来更好地为您提供各项服务,点击此处了解我们的隐私策略。 如您需继续使用本网站,请您授权我们使用本地 cookie 来保存部分信息。
全站搜索
您最值得信赖的光电行业旗舰网络服务平台!