对合肥夏季臭氧的数值模拟:太阳辐射及其关联机制的作用
In recent years, many cities in China have gradually changed from single-type particulate matter pollution to compound air pollution, with increasingly prominent ozone pollution in summer especially. The Yangtze River Delta where Hefei City is located is the region with the most serious ozone pollution in summer. Thus, we analyze in depth the changes in summer ozone concentrations and solar radiation intensity in Hefei by combining two experimental methods of observational analysis and numerical simulations to understand the possible correlations between them. Numerical modeling is also adopted to reproduce the daily variations in solar radiation intensity and ground-level ozone concentrations in different weather conditions. The contribution of each physicochemical process to ozone production is quantified by the process analysis techniques embedded in the model, and the details of the influence of gas-phase chemistry, dry and wet depositions, and diffusive transport on ozone concentrations in different weather conditions are distinguished. Our study is expected to explore the effect of solar radiation on ground-level ozone concentrations with the help of sophisticated observations and effective simulations to deepen the understanding about the intrinsic mechanism of solar radiation directly and indirectly affecting ozone concentrations. Finally, we can analyze the causes of urban ozone pollution in summer in a more scientific manner and provide a necessary theoretical basis for the effective prevention and control of ozone pollution.
MS-711 is a new generation of all-weather grating spectroradiometer, which measures in the spectral range of 300-1100 nm with a spectral resolution of less than 7 nm. The data for the air quality model are obtained from the final operational global analysis (FNL) project, and the emission inventory of the pollutant sources is provided by the multiresolution emission inventory model for climate and air pollution research (MEIC). The ozone concentration data are obtained from the Hefei Ambient Air Quality Monitoring Station. WRF v4.1 and CAMx v7.10 are utilized for the numerical modeling of meteorological fields and air quality. The model employs a three-layer nested grid with grid side lengths of 27, 9, and 3 km, ranging from Northeast Asia, Eastern China, and Hefei City and its surroundings respectively. The WRF microphysics is the Morrison double-moment scheme, and the cumulus parameterization is the Grell 3D ensemble scheme. The gas phase chemistry mechanism of CAMx is CB05, and the secondary organic aerosol scheme is CF. We also leverage time-lagged correlation analysis (TLCC) to assess the relationship between solar radiation intensity and ground-level ozone concentrations. Meanwhile, TLCC is adopted to calculate the correlation of one time series with another at different points in time. We shift the ozone concentration series backward by a certain amount of time and then calculate the correlation coefficient between it and solar radiation intensity. The integrated process rate analysis (IPR) method is a process analysis technique that combines chemical kinetic modeling and statistical analysis methods embedded in the CAMx model. Additionally, we employ it to analyze the effects of a variety of chemical reactions and physical processes on ozone generation and elimination rates to determine the rates and understand the ozone generation and elimination mechanisms.
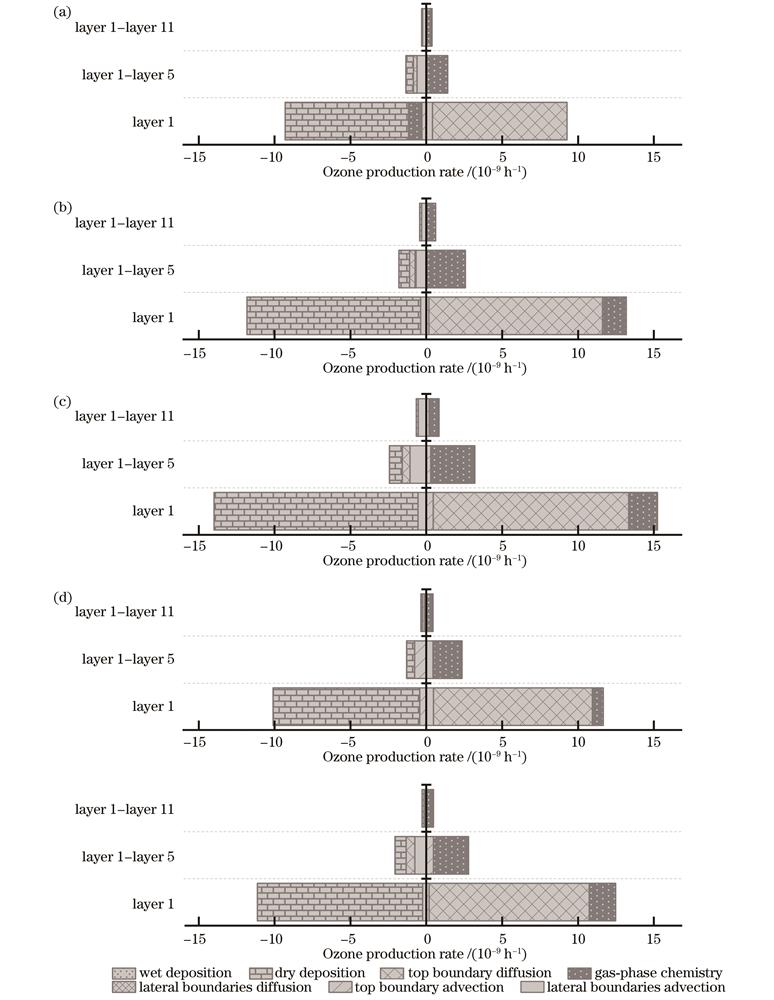
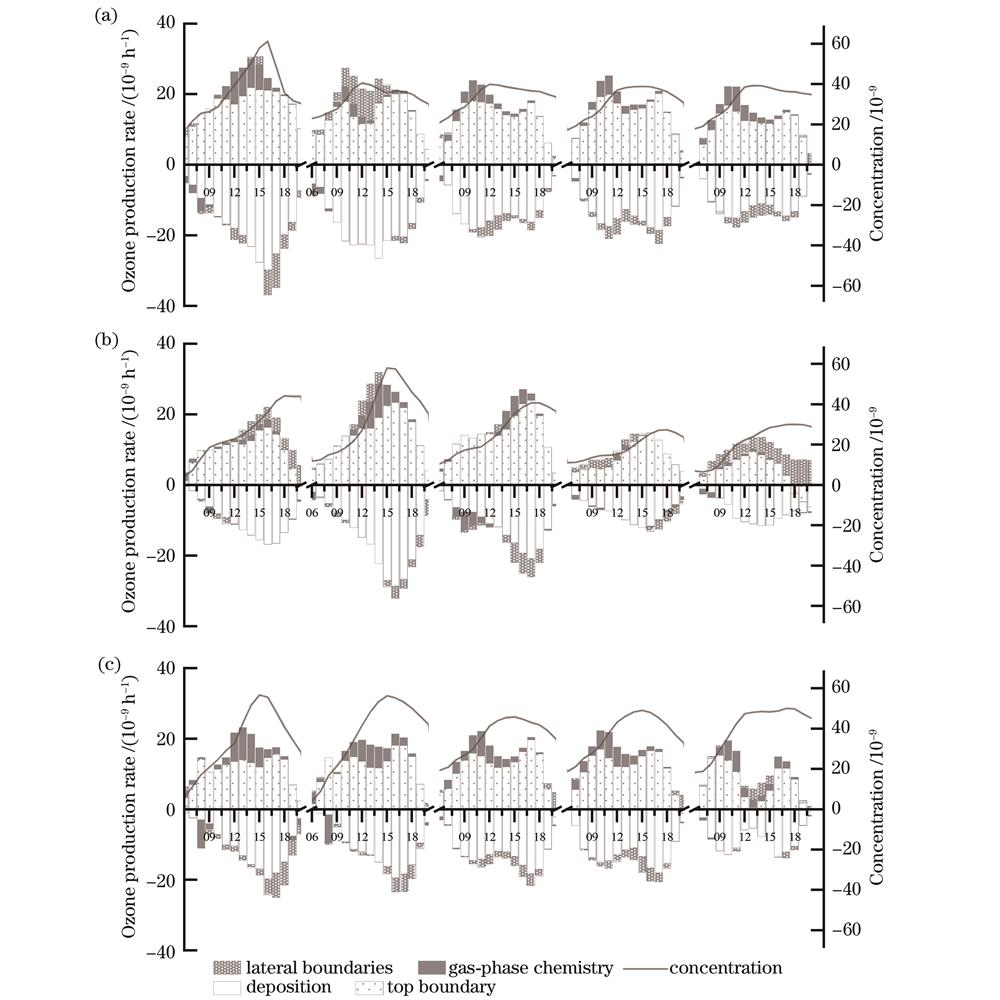
The observations and numerical simulations confirm that the zone peak of summer daytime occurs approximately 2-3 h after the peak solar radiation intensity (Fig. 3). From layer 1 to layer 5, the ozone concentrations increase gradually with the rising height (Fig. 5). The contributions of ozone sources in the near-surface layer (layer 1) are as follows. The vertical diffusion process from high altitude to the ground contributes a generation rate of +8.87×10⁻⁹ h-1, which is a main reason for ozone concentration increase, while the contribution of dry depositions is -8.12×10⁻⁹ h-1 and it is the main ozone scavenging process (Fig. 6). Layer 6-layer 7 correspond to altitudes of 1931-3371 m, and the main reason for low ozone concentrations is due to the rapidly decreased contribution of photochemical processes (Fig. 5). The ozone accumulation on sunny days comes from photochemical processes first, and when the solar radiation intensity decreases, the large input of ozone generated in the upper part of the boundary layer is the key factor in maintaining the ozone concentrations. However, the ozone concentrations maintain a slowly decreasing trend in the following hours due to the convection development in the late afternoon, which blocks subsidence [Fig. 7(a)]. On rainy days, Vc (contribution of chemical processes) values are small, slowly coming, and short-lived, while the significantly enhanced Vtp (contribution of diffusive transport at the upper interface) throughout the afternoon hours is the primary reason for the growth and maintenance of ozone concentrations [Fig. 7(b)]. On cloudy days, solar radiation dominates the ozone growth stage, and dry and wet depositions and horizontal fluxes dominate the ozone decline stage [Fig. 7(c)].
The vertical motion of the atmosphere exerts a significant effect on near-surface ozone concentrations. The ozone concentrations gradually increase from the ground up to approximately 1 km, with a positive contribution from the downward movement of the air that transports the high ozone concentration in the upper layers to the near-surface during sunny days and a negative contribution from the upward movement of the air that dilutes the ozone concentration in the air below the boundary layer during rainy days. The daily variations in ozone concentrations in different weather conditions are closely related to the contribution of several mechanisms. Solar radiation-driven photochemical reactions, diffusive transport, and wet and dry depositions affect ozone production at different moments and altitudes, and the process analysis results show that the quantitative contributions can explain the daily variability of ozone concentrations characterized by different weather conditions.
1 引言
2013年,中国政府发布了《大气污染防治行动计划》。通过控制颗粒物,许多城市的空气质量逐步得到提高,空气污染特征也发生了明显的变化[1-3]。近年来,城市空气污染已经由起初单一的颗粒物污染类型逐步转变为大气复合污染类型[4-6],特别是臭氧(O3)污染问题愈发突出[7-8]。
O3是对流层中重要的痕量气体成分[9-11]。近地层的O3部分来源于平流层输送,还有大部分是对流层中所含的前体物,例如氮氧化物(NOx)、挥发性有机物(VOCs)、一氧化碳(CO)、甲烷(CH4)等,在太阳辐射下发生光化学反应而生成的[12-13]。近地层O3的研究涉及O3与前体物质的排放特征以及光化学反应生成机制[14-15],这都与气象条件的变化有着密切关系[16-18]。Gong和Liao[19]在对华北地区O3污染发生时的气象条件进行研究时发现,高温、低湿、对流层底部的异常南风和500 hPa高度的异常高压会导致高空生成大量O3,并由异常的下沉气流输送至地表造成O3污染。Han等[20]研究了气象因素对华东地区夏季地表O3浓度日间变化规律的影响,指出弱气旋和盛行南风这两种天气类型会给地表 O3分别带来1.7%和4.6%的正异常。日间O3的形成与太阳辐射驱动的一系列光化学反应相关[2],包括引发反应、自由基生成反应、自由基传递反应以及终止反应。然而,在实际大气环境中太阳辐射不仅直接作用于O3的光化学反应过程[21],而且它引起的地气系统热量传输还会改变边界层的厚度和结构[22],进而影响边界层中大气污染物质的运输和扩散[23]。
除了观测实验研究外,亦有许多学者运用数值模拟方法对O3展开研究。基于过程分析(IPR),模拟实验可以得到不同物理化学过程对O3浓度的影响,进而解释O3浓度变化的成因。汪海恒等[24]利用天气预报模式及社区多尺度空气质量模型(WRF/CMAQ)模式系统对粤北地区一次O3污染事件进行了过程分析,得出外来输送堆积和本地气相化学生成共同造成了韶关地区O3污染过程的结论。杨豪[25-26]利用耦合化学模块的天气预报(WRF-Chem)模式探究了华北地区发生的多次大气污染事件中的气溶胶-光解速率相互作用和气溶胶-辐射反馈,研究表明O3与太阳辐射存在着相互影响,减排造成气溶胶-辐射相互作用弱化导致地表最大8 h O3平均浓度增加。沈劲等[27]利用空气质量模型与IPR等工具对珠三角地区O3浓度的分析表明,夏季化学过程对O3的影响较为明显,而其他季节O3浓度主要受物理过程影响。李莉[28]对长三角地区O3污染的IPR研究显示,在O3浓度最高值时段输送过程的贡献较大,而化学过程主要发生在高空,并通过向地面的传输扩散进而导致近地面O3浓度升高。张瑞欣等[29]对乌海市夏季O3污染特征的IPR显示,6月和7月化学过程和输送共同导致了O3浓度升高,且化学过程的贡献是输送的两倍,而8月O3浓度的升高则主要为输送作用的影响。上述研究多是利用空气质量模型对O3生成机制进行IPR,研究重点聚焦于O3浓度与前体物质浓度、宏观气象要素之间的关系,对本质上驱动气象要素变化和光化学反应的太阳辐射特征的研究相对较少。
本文利用MS-711太阳辐射监测数据,运用天气预报模式及功能扩展的综合空气质量模型(WRF/CAMx)数值模式,结合观测分析与模拟计算两种实验方法,应用IPR技术量化各物理化学过程对O3浓度生成的贡献,探究太阳辐射对日间O3浓度的影响,进而深化对太阳辐射影响O3浓度内在机制的认识,更加科学地理解夏季城市O3污染的产生原因,同时可以为有效防治O3污染提供必要的理论基础。
2 数据与方法
2.1 数据来源
太阳辐射观测数据来源于新一代全天候光栅光谱辐射计MS-711。MS-711安装在合肥市中心区域一栋5层高的实验楼顶,它的测量光谱范围为300~1100 nm,光谱分辨率小于7 nm,波长精度小于0.2 nm,温度响应小于2%,响应时间在10 ms~5 s。MS-711使用期间每年标定一次,实验观测期为2018年7月1—31日,观测数据每10 min采集一次。空气质量模型的数据来源于FNL(Final Operational Global Analysis)气象再分析资料,污染源排放清单由中国多尺度排放清单模型MEIC(Multiresolution Emission Inventory model for climate and air pollution research)提供(http://meicmodel.org.cn)。O3浓度数据来自合肥市环境空气质量监测站(国控站点)公开发布的结果,监测方法和数据质控满足《环境空气气态污染物(SO2、NO2、O3、CO)连续自动监测系统技术要求及检测方法 HJ 654-2013》的规范要求。
2.2 WRF/CAMx 模型与研究区域概况
本文使用WRF v4.1对气象场进行模拟,模式参数化方案设置如
表 1. WRF模式参数设置
Table 1. Parameter settings of WRF
|
表 2. CAMx模式参数设置
Table 2. Parameter settings of CAMx
|
2.3 滞后相关分析
时间滞后相关(TLCC)是一种用于分析时间序列数据的方法。TLCC用于计算一个时间序列在不同时间点与另一个时间序列的相关性,其中时间序列可以是同一个变量在不同时间点的取值,也可以是两个不同变量在相同时间点的取值。为了考虑时间滞后的影响,可以将其中一个时间序列向前或向后移动一定的时间,然后计算两个时间序列之间的相关性[30]。计算公式如下:
式中:j表示时间滞后的长度;n表示时间序列的长度;Xi和Yi分别是两个时间序列的取值。
2.4 IPR技术
通过对模型中运行的单个物理和化学过程进行分解,IPR可以对光化学模型的模拟结果进行深度分析。CAMx 中的综合过程速率分析方法是一种结合了化学动力学模型和统计分析方法的IPR技术,被广泛应用于区域光化学污染研究[31-32]。对于模式中的污染物浓度变化,可以使用下式计算:
即污染物浓度变化(
IPR方法可以分析多种化学反应和物理过程对O3生成和消解速率的影响,从而确定O3的生成机制和消解机制。
3 分析与讨论
3.1 WRF/CAMx模拟结果评估

图 1. 合肥市2018年7月模拟太阳总辐射与MS-711观测的太阳总辐射对比
Fig. 1. Comparison between simulated total solar radiation and MS-711 observed total solar radiation in July 2018 in Hefei
WRF模拟的太阳总辐射一般在20:00至次日5:00为0,从6:00开始太阳总辐射逐渐增加,到中午达到峰值,之后逐渐减小。比较模拟和实测的太阳总辐射日变化可以发现,两者具有很好的一致性,因此用WRF模拟的太阳辐射研究它影响O3浓度的过程和机理是可行的。

图 2. 合肥市2018年7月WRF/CAMx模拟与监测站点(琥珀山庄)的O3浓度对比
Fig. 2. Comparison of simulated and monitored O3 concentrations in July 2018 in Hefei using WRF/CAMx model and a monitoring station (Hupo Shanzhuang)
表 3. 2018年7月逐小时O3与太阳辐射模拟结果
Table 3. Hourly simulated results of O3 and solar radiation in July 2018
| ||||||||||||||||||||||||||||||||||||||||||
3.2 O3日变化与太阳辐射的关系
每天从日出开始,随着太阳辐射增强,生成O3的光化学反应速率增加;午后随着太阳辐射减弱,生成O3的光化学反应速率下降。这一过程在太阳辐射和O3浓度的日变化曲线上都呈现出显著的峰区。已有研究发现,一天当中太阳辐射的最大值与O3浓度的最大值出现的时刻并不重合,在夏季时的统计结果显示O3浓度最大值出现的时间要平均晚于太阳辐射最大值出现的时间约3 h[36]。
本文分别利用WRF模拟和实际观测得到的太阳辐射和O3浓度,通过滞后相关分析来评估太阳辐射和O3浓度的相关性。设置偏移时间设置为0~5 h,分别记为Rlag(0)~Rlag(5)。

图 3. 2017年7月辐射与O3的时间滞后相关性特征
Fig. 3. Time-lagged correlation characteristics between radiation and O3 in July 2017

图 4. 2017年7月特征天气下辐射与O3的时间滞后相关性特征。(a)基于观测数据;(b)基于模拟结果
Fig. 4. Time-lagged correlation characteristics between radiation and O3 under characteristic weather in July 2017. (a) Based on observation data; (b) based on simulation results
3.3 O3生成过程的垂直差异
为了进一步解析太阳辐射变化影响O3的机理,本文采用IPR方法定量分析不同物理化学过程对O3浓度分布的影响。CAMx输出数据在垂直方向分为11层,统计layer 1~layer 11的O3浓度平均值如

图 5. Layer 1~layer 11 O3浓度的统计分析
Fig. 5. Statistical analysis of O3 concentration from layer 1 to layer 11
如

图 6. 2018年7月合肥市区O3的平均生成过程。(a)O3平均生成过程;(b)日间O3生成过程;(c)晴天日间O3生成过程;(d)雨天日间O3生成过程;(e)云天日间O3生成过程
Fig. 6. Average O3 generation process in Hefei in July 2018. (a) Average O3 generation process; (b) O3 generation process during daytime; (c) O3 generation process during sunny daytime; (d) O3 generation process during rainy daytime; (e) O3 generation process during cloudy daytime
由于白天以O3的生成为主,夜间以O3的消耗为主。为了更一步了解太阳辐射强度变化与O3浓度之间的关系,本文只选择白天(北京时间的6:00—20:00),按照不同日照条件分类进行比较,如图
3.4 O3日变化的发生机制
O3浓度的日变化可以由模拟得到的近地面(~26 m)每小时气相化学、干湿沉降、垂直和水平通量的贡献速率来具体分析,分别记为Vc、Vdp、Vtp、Vlb。

图 7. 合肥市区近地层(layer 1,~26 m)O3平均生成过程日变化。(a)晴天特征时间;(b)雨天特征时间段;(c)云天特征时间段
Fig. 7. Diurnal variation of average O3 generation process in near-surface layer (layer 1, ~26 m) in Hefei. (a) Characteristic time during sunny days; (b) characteristic time during rainy days; (c) characteristic time during cloudy days
从图
晴天时,Vc出现时间早,增长速度快,一般在正午之前达到峰值,与太阳辐射强度的变化具有高度一致性,O3浓度很快达到一个较大的数值。正午过后,Vtp出现明显的下降,在14:00前后形成一个谷底。除去12日因为正的水平输入贡献较为特殊,其余几天水平输入贡献都为负。在后者这种情况下,Vtp在午后下降,同时Vdp的数值也同步下降。Vtp、Vdp、Vlb三者之间的关系可以理解为:当午后因为热力对流发展,气流上升运动加强,Vtp减弱,同时Vdp也减弱,周围空气辐合稀释O3浓度(Vlb为负,数值下降)。这也解释了晴天O3上升快,维持高浓度时间长的动力机制。晴天O3的积累首先来自光化学过程,当太阳辐射强度下降后,边界层上部生成的O3大量输入,是维持O3浓度的关键因素。但受制于午后对流发展使得下沉受阻,所以O3浓度维持了此后几个小时缓慢下降的趋势。O3浓度先后受到太阳辐射、热力驱动动力输送的影响,因此,O3浓度与太阳辐射强度的统计相关性不太好。
雨天时,Vc数值小,出现的时间晚,持续时间短。Vtp从早晨开始到下午持续缓慢增加,Vdp的贡献为负,数值变化与Vtp基本一致。整个下午时段显著增强的Vtp是O3浓度增长和维持的首要原因。Vlb的变化情况没有明显的规律性,这也是降雨发生时气流运动活跃且多变的必然结果。
阴天时,Vc的贡献明显高于雨天,接近晴天。Vc最大值出现在约12:00,比晴天稍晚。Vtp在午后出现低谷,Vdp的贡献与Vtp相反,数值基本同步变化。Vlb以负的贡献为主。阴天午后仍然有明显的对流上升运动,Vtp、Vdp都受到影响而减弱,但持续时间不长;随后Vdp带来O3的净输出达到一天中的最大(出现在约17:00),这使得O3浓度随之迅速下降。阴天太阳辐射主导O3增长阶段,干湿沉降和水平通量主导O3下降阶段,两者机制不同,但其叠加作用的结果让O3浓度日变化曲线呈现更好的轴对称性,这将会使太阳辐射与O3浓度呈现出更好的相关性,尽管这种相关性是带有时延滞后的。
4 结论
本文对合肥市夏季O3污染进行了连续一个月的观测和数值模拟实验,观测得到的太阳辐射和O3浓度之间存在特殊的滞后相关特点,数值模拟也同样证实了这一现象。
观测结果和数值模拟都证实,夏季日间O3峰值出现在太阳辐射强度峰值出现之后约2~3 h,模拟结果得到的相关系数大于观测结果,原因在于实际过程中O3光化学反应过程还受到前体物排放强度的制约,这会弱化太阳辐射对O3浓度的直接影响。大气垂直运动对近地面O3浓度具有影响。从地面往上到约1 km的高度,O3浓度逐渐增加,晴天时空气下沉运动将上层高浓度O3传输至近地面,是正的贡献;雨天时空气上升运动将稀释边界层以下空气中的O3浓度,是负的贡献。不同天气条件下,O3浓度的日变化和几种机制的贡献度密切相关。晴天O3的积累首先来自光化学过程,当太阳辐射强度下降后,边界层上部生成的O3大量输入,是维持O3浓度的关键因素。雨天整个下午时段O3浓度的增长和维持主要取决于通过上边界的垂直输送的贡献。阴天太阳辐射主导O3增长阶段,干湿沉降和水平通量主导O3下降阶段。
[1] Zhang Q A, Zheng Y X, Tong D, et al. Drivers of improved PM2.5 air quality in China from 2013 to 2017[J]. Proceedings of the National Academy of Sciences of the United States of America, 2019, 116(49): 24463-24469.
[2] Ding D, Xing J, Wang S X, et al. Impacts of emissions and meteorological changes on China′s ozone pollution in the warm seasons of 2013 and 2017[J]. Frontiers of Environmental Science & Engineering, 2019, 13(5): 76.
[3] Xue T, Liu J, Zhang Q, et al. Rapid improvement of PM2.5 pollution and associated health benefits in China during 2013-2017[J]. Science China Earth Sciences, 2019, 62(12): 1847-1856.
[4] Li G, Bei N, Cao J, et al. Widespread and persistent ozone pollution in eastern China[J]. Atmospheric Chemistry and Physics, 2016, 17(4): 1-39.
[5] 王文兴, 柴发合, 任阵海, 等. 新中国成立70年来我国大气污染防治历程、成就与经验[J]. 环境科学研究, 2019, 32(10): 1621-1635.
Wang W X, Chai F H, Ren Z H, et al. Process, achievements and experience of air pollution control in China since the founding of the People′s republic of China 70 years ago[J]. Research of Environmental Sciences, 2019, 32(10): 1621-1635.
[6] 赵忆睿, 曹念文, 贾鹏程, 等. 紫外多波长激光雷达的臭氧和气溶胶同步观测研究[J]. 激光与光电子学进展, 2022, 59(16): 1601001.
[7] Zheng D Y, Huang X J, Guo Y H. Spatiotemporal variation of ozone pollution and health effects in China[J]. Environmental Science and Pollution Research, 2022, 29(38): 57808-57822.
[8] Wang Y S, Li W J, Gao W K, et al. Trends in particulate matter and its chemical compositions in China from 2013-2017[J]. Science China Earth Sciences, 2019, 62(12): 1857-1871.
[9] 迟雨蕾, 赵传峰. 臭氧卫星遥感反演进展及挑战[J]. 光学学报, 2023, 48(18): 1800005.
Chi Y L, Zhao C F. Progress and challenges of ozone satellite remote sensing inversion[J]. Acta Optica Sinica, 2023, 48(18): 1800005.
[10] 朱芳, 司福祺, 詹锴, 等. Chappuis-Wulf波段临边辐射臭氧廓线的反演[J]. 光学学报, 2021, 41(4): 0401005.
[11] 张建文, 李博, 林冠宇, 等. 臭氧激光雷达四通道光纤光谱仪设计[J]. 激光与光电子学进展, 2023, 60(20): 2011004.
[12] 曲雅微. 大气细颗粒物与臭氧的垂直结构和相互作用研究[D]. 南京: 南京大学, 2020.
QuY W. Study on vertical structure and interaction between atmospheric fine particles and ozone[D]. Nanjing: Nanjing University, 2020.
[13] Qiu X H, Ying Q, Wang S X, et al. Significant impact of heterogeneous reactions of reactive chlorine species on summertime atmospheric ozone and free-radical formation in North China[J]. Science of the Total Environment, 2019, 693: 133580.
[14] 王占山, 李云婷, 陈添, 等. 北京城区臭氧日变化特征及与前体物的相关性分析[J]. 中国环境科学, 2014, 34(12): 3001-3008.
Wang Z S, Li Y T, Chen T, et al. Analysis on diurnal variation characteristics of ozone and correlations with its precursors in urban atmosphere of Beijing[J]. China Environmental Science, 2014, 34(12): 3001-3008.
[15] 刘建, 吴兑, 范绍佳, 等. 前体物与气象因子对珠江三角洲臭氧污染的影响[J]. 中国环境科学, 2017, 37(3): 813-820.
Liu J, Wu D, Fan S J, et al. Impacts of precursors and meteorological factors on ozone pollution in Pearl River Delta[J]. China Environmental Science, 2017, 37(3): 813-820.
[16] Li K, Jacob D J, Liao H, et al. Anthropogenic drivers of 2013-2017 trends in summer surface ozone in China[J]. Proceedings of the National Academy of Sciences of the United States of America, 2019, 116(2): 422-427.
[17] Jia M W, Zhao T L, Cheng X H, et al. Inverse relations of PM2.5 and O3 in air compound pollution between cold and hot seasons over an urban area of East China[J]. Atmosphere, 2017, 8(3): 59.
[18] 于世杰, 尹沙沙, 张瑞芹, 等. 郑州市近地面臭氧污染特征及气象因素分析[J]. 中国环境监测, 2017, 33(4): 140-149.
Yu S J, Yin S S, Zhang R Q, et al. Analysis on the characteristics of surface ozone pollution and meteorological factors in Zhengzhou[J]. Environmental Monitoring in China, 2017, 33(4): 140-149.
[19] Gong C, Liao H. A typical weather pattern for ozone pollution events in North China[J]. Atmospheric Chemistry and Physics, 2019, 19(22): 13725-13740.
[20] Han H, Liu J, Shu L, et al. Local and synoptic meteorological influences on daily variability in summertime surface ozone in Eastern China[J]. Atmospheric Chemistry and Physics, 2020, 20(1): 203-222.
[21] Li M M, Wang T J, Xie M, et al. Agricultural fire impacts on ozone photochemistry over the Yangtze River Delta region, East China[J]. Journal of Geophysical Research: Atmospheres, 2018, 123(12): 6605-6623.
[22] Liu R, Han Z, Wu J, et al. The impacts of urban surface characteristics on radiation balance and meteorological variables in the boundary layer around Beijing in summertime[J]. Atmospheric Research, 2017, 197: 167-176.
[23] 耿一超, 田春艳, 陈晓阳, 等. 珠江三角洲秋季臭氧干沉降特征的数值模拟[J]. 中国环境科学, 2019, 39(4): 1345-1354.
Geng Y C, Tian C Y, Chen X Y, et al. Numerical simulation of ozone dry deposition characteristics in autumn over the Pearl River Delta region, China[J]. China Environmental Science, 2019, 39(4): 1345-1354.
[24] 汪海恒, 沈傲, 许亦非, 等. 粤北地区一次臭氧污染过程分析及数值模拟[J]. 环境科学学报, 2022, 42(10): 49-61.
Wang H H, Shen A, Xu Y F, et al. Analysis and numerical simulation of an ozone pollution process in northern Guangdong[J]. Acta Scientiae Circumstantiae, 2022, 42(10): 49-61.
[25] 杨豪. 气溶胶-辐射相互作用对中国东部臭氧浓度影响的数值模拟研究[D]. 南京: 南京信息工程大学, 2022.
YangH. Numerical simulation study on the influence of aerosol-radiation interaction on ozone concentration in Eastern China[D]. Nanjing: Nanjing University of Information Science & Technology, 2022.
[26] Yang H, Chen L, Liao H, et al. Impacts of aerosol–photolysis interaction and aerosol–radiation feedback on surface-layer ozone in North China during multi-pollutant air pollution episodes[J]. Atmospheric Chemistry and Physics, 2022, 22(6): 4101-4116.
[27] 沈劲, 何灵, 程鹏, 等. 珠三角北部背景站臭氧浓度变化特征[J]. 生态环境学报, 2019, 28(10): 2006-2011.
Shen J, He L, Cheng P, et al. Characteristics of ozone concentration variation in the northern background site of the Pearl River Delta[J]. Ecology and Environmental Sciences, 2019, 28(10): 2006-2011.
[28] 李莉. 典型城市群大气复合污染特征的数值模拟研究[D]. 上海: 上海大学, 2013.
LiL. Numerical simulation study on the characteristics of combined air pollution in typical urban agglomerations[D]. Shanghai: Shanghai University, 2013.
[29] 张瑞欣, 陈强, 夏佳琦, 等. 乌海市夏季臭氧污染特征及基于过程分析的成因探究[J]. 环境科学, 2021, 42(9): 4180-4190.
Zhang R X, Chen Q, Xia J Q, et al. Exploring characteristics and causes of summer ozone pollution based on process analysis in Wuhai[J]. Environmental Science, 2021, 42(9): 4180-4190.
[30] 张轩谊, 韦飞, 彭松武, 等. 太阳远紫外在临近空间的辐射特性研究[J]. 光谱学与光谱分析, 2023, 43(2): 374-382.
[31] Li L, Chen C H, Huang C, et al. Process analysis of regional ozone formation over the Yangtze River Delta, China using the Community Multi-scale Air Quality modeling system[J]. Atmospheric Chemistry and Physics, 2012, 12(22): 10971-10987.
[32] Wang X, Zhang Y, Hu Y, et al. Process analysis and sensitivity study of regional ozone formation over the Pearl River Delta, China, during the PRIDE-PRD2004 campaign using the CMAQ model[J]. Atmospheric Chemistry & Physics Discussions, 2009, 9(6): 635-645.
[33] Chen W D, Cui F, Zhou H, et al. Impacts of different radiation schemes on the prediction of solar radiation and photovoltaic power[J]. Atmospheric and Oceanic Science Letters, 2017, 10(6): 446-451.
[34] Ruiz-Arias J A, Arbizu-Barrena C, Santos-Alamillos F J, et al. Assessing the surface solar radiation budget in the WRF model: a spatiotemporal analysis of the bias and its causes[J]. Monthly Weather Review, 2016, 144(2): 703-711.
[35] 王明欢, 赖安伟, 陈正洪, 等. WRF模式模拟的地表短波辐射与实况对比分析[J]. 气象, 2012, 38(5): 585-592.
Wang M H, Lai A W, Chen Z H, et al. Comparison of WRF forecast downward shortwave radiation with observations-a pilot study[J]. Meteorological Monthly, 2012, 38(5): 585-592.
[36] Huang X M, Yi M J, Deng S M, et al. The characteristics of daily solar irradiance variability and its relation to ozone in Hefei, China[J]. Air Quality, Atmosphere & Health, 2023, 16: 277-288.
Article Outline
易明建, 黄雪梅, 姜永清, 赵强, 李艺, 邓淑梅. 对合肥夏季臭氧的数值模拟:太阳辐射及其关联机制的作用[J]. 光学学报, 2024, 44(6): 0601011. Mingjian Yi, Xuemei Huang, Yongqing Jiang, Qiang Zhao, Yi Li, Shumei Deng. Numerical Simulation of Summer Ozone in Hefei: Role of Solar Radiation and Its Associated Mechanisms[J]. Acta Optica Sinica, 2024, 44(6): 0601011.


