全局模型和局部优化的深度网络显著性检测  下载: 1036次
Deep Network Saliency Detection Based on Global Model and Local Optimization
1 海军航空工程学院控制工程系, 山东 烟台 264001
2 中国国防科技信息中心, 北京 100142
3 海军92493部队98分队, 辽宁 葫芦岛 125000
图 & 表
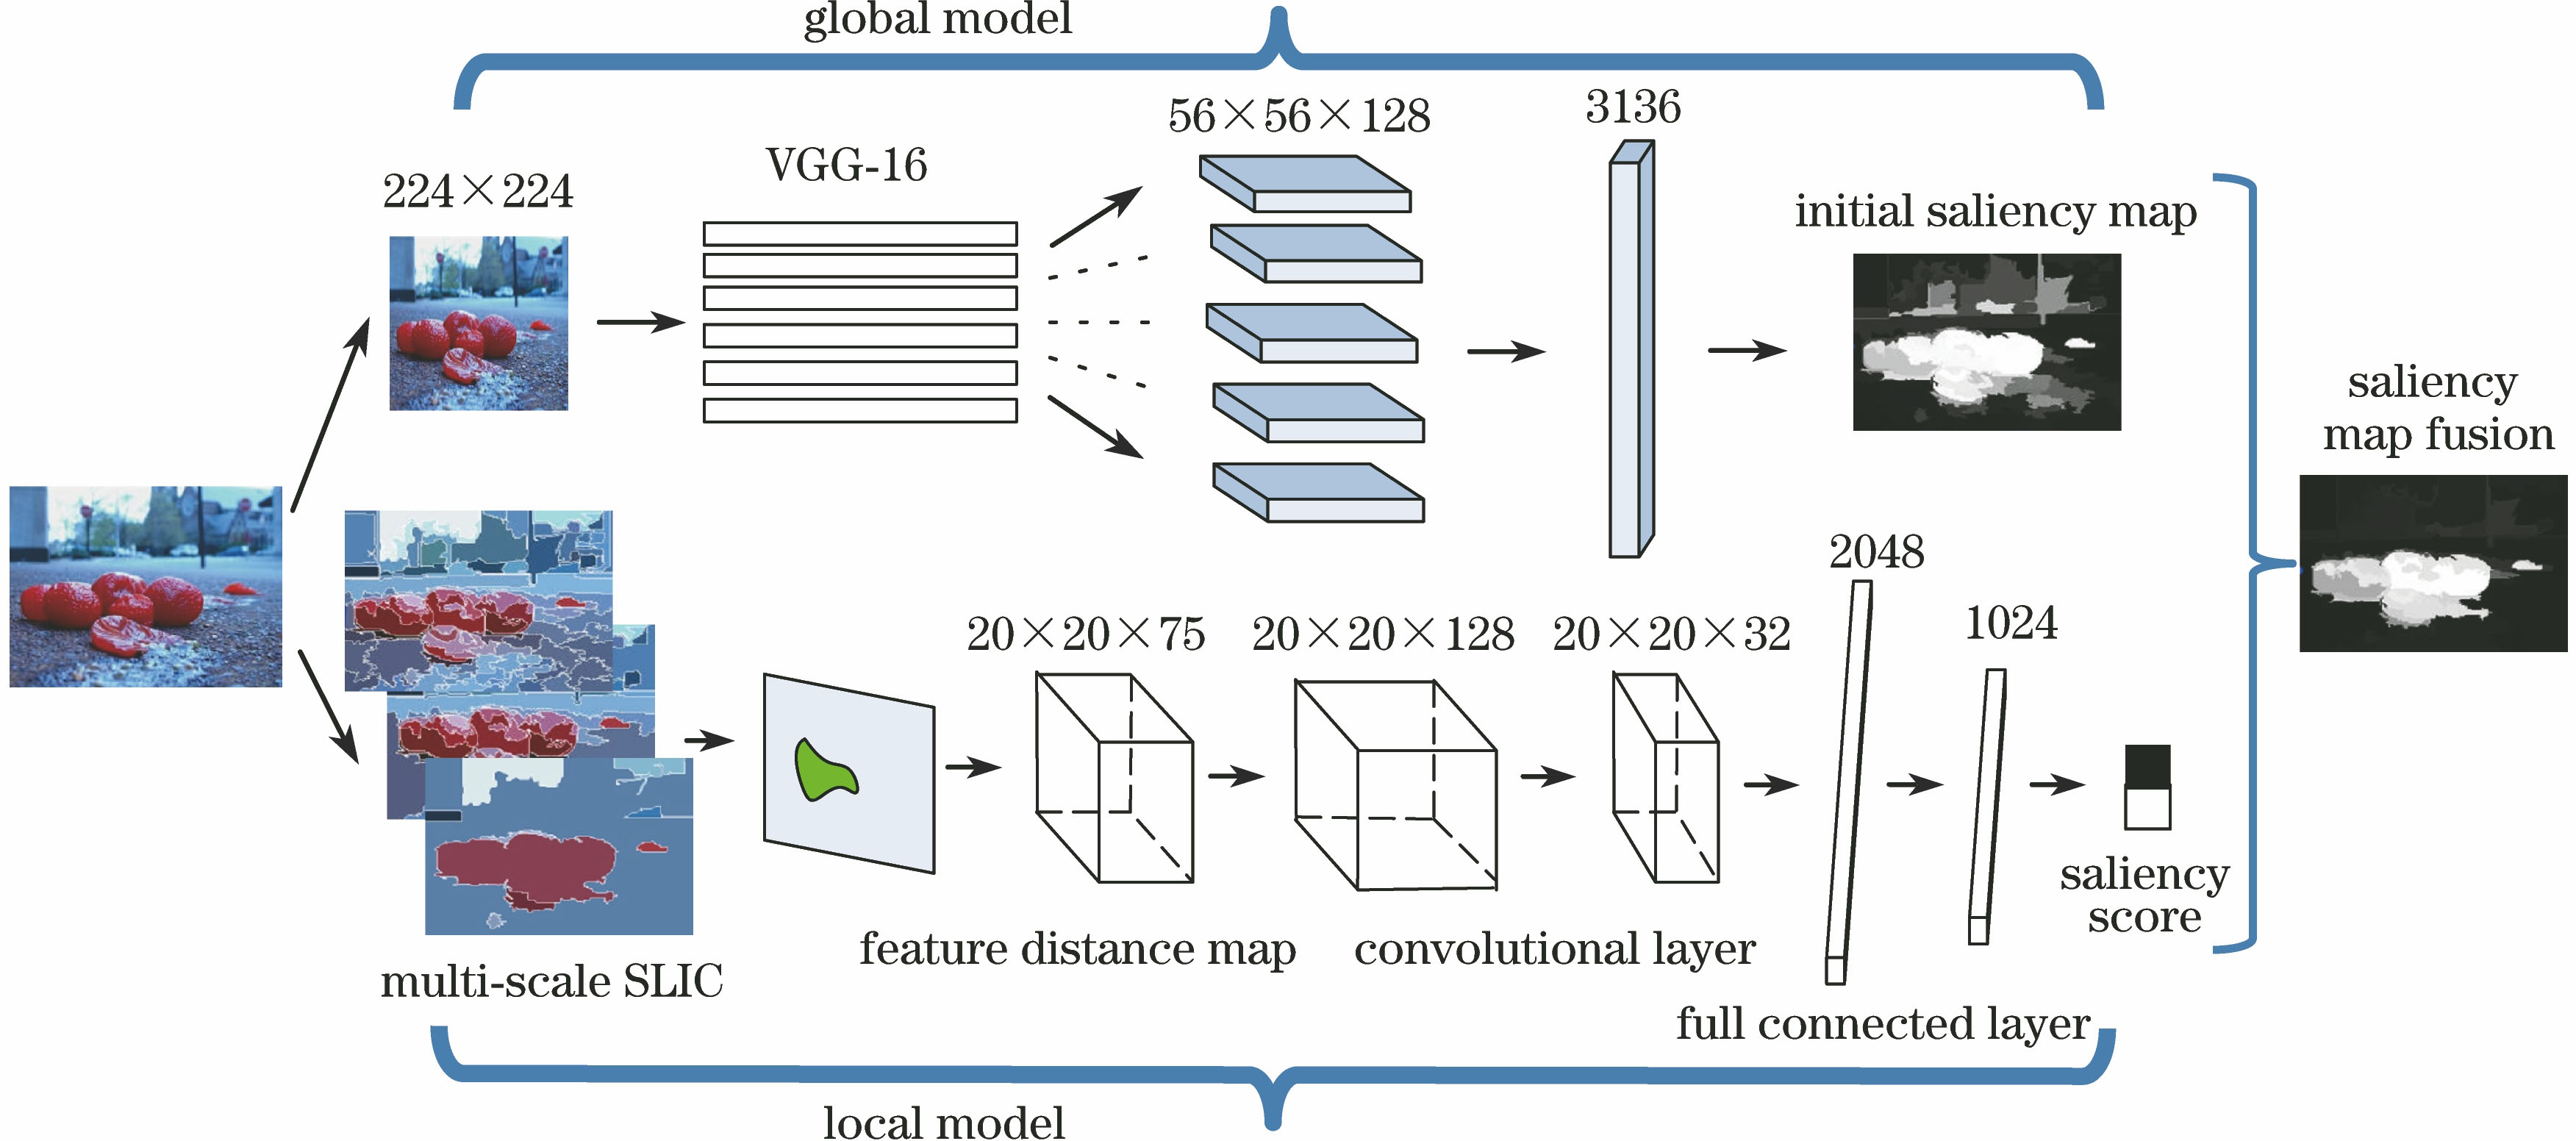
图 1. 模型结构
Fig. 1. Structure of model
下载图片 查看原文
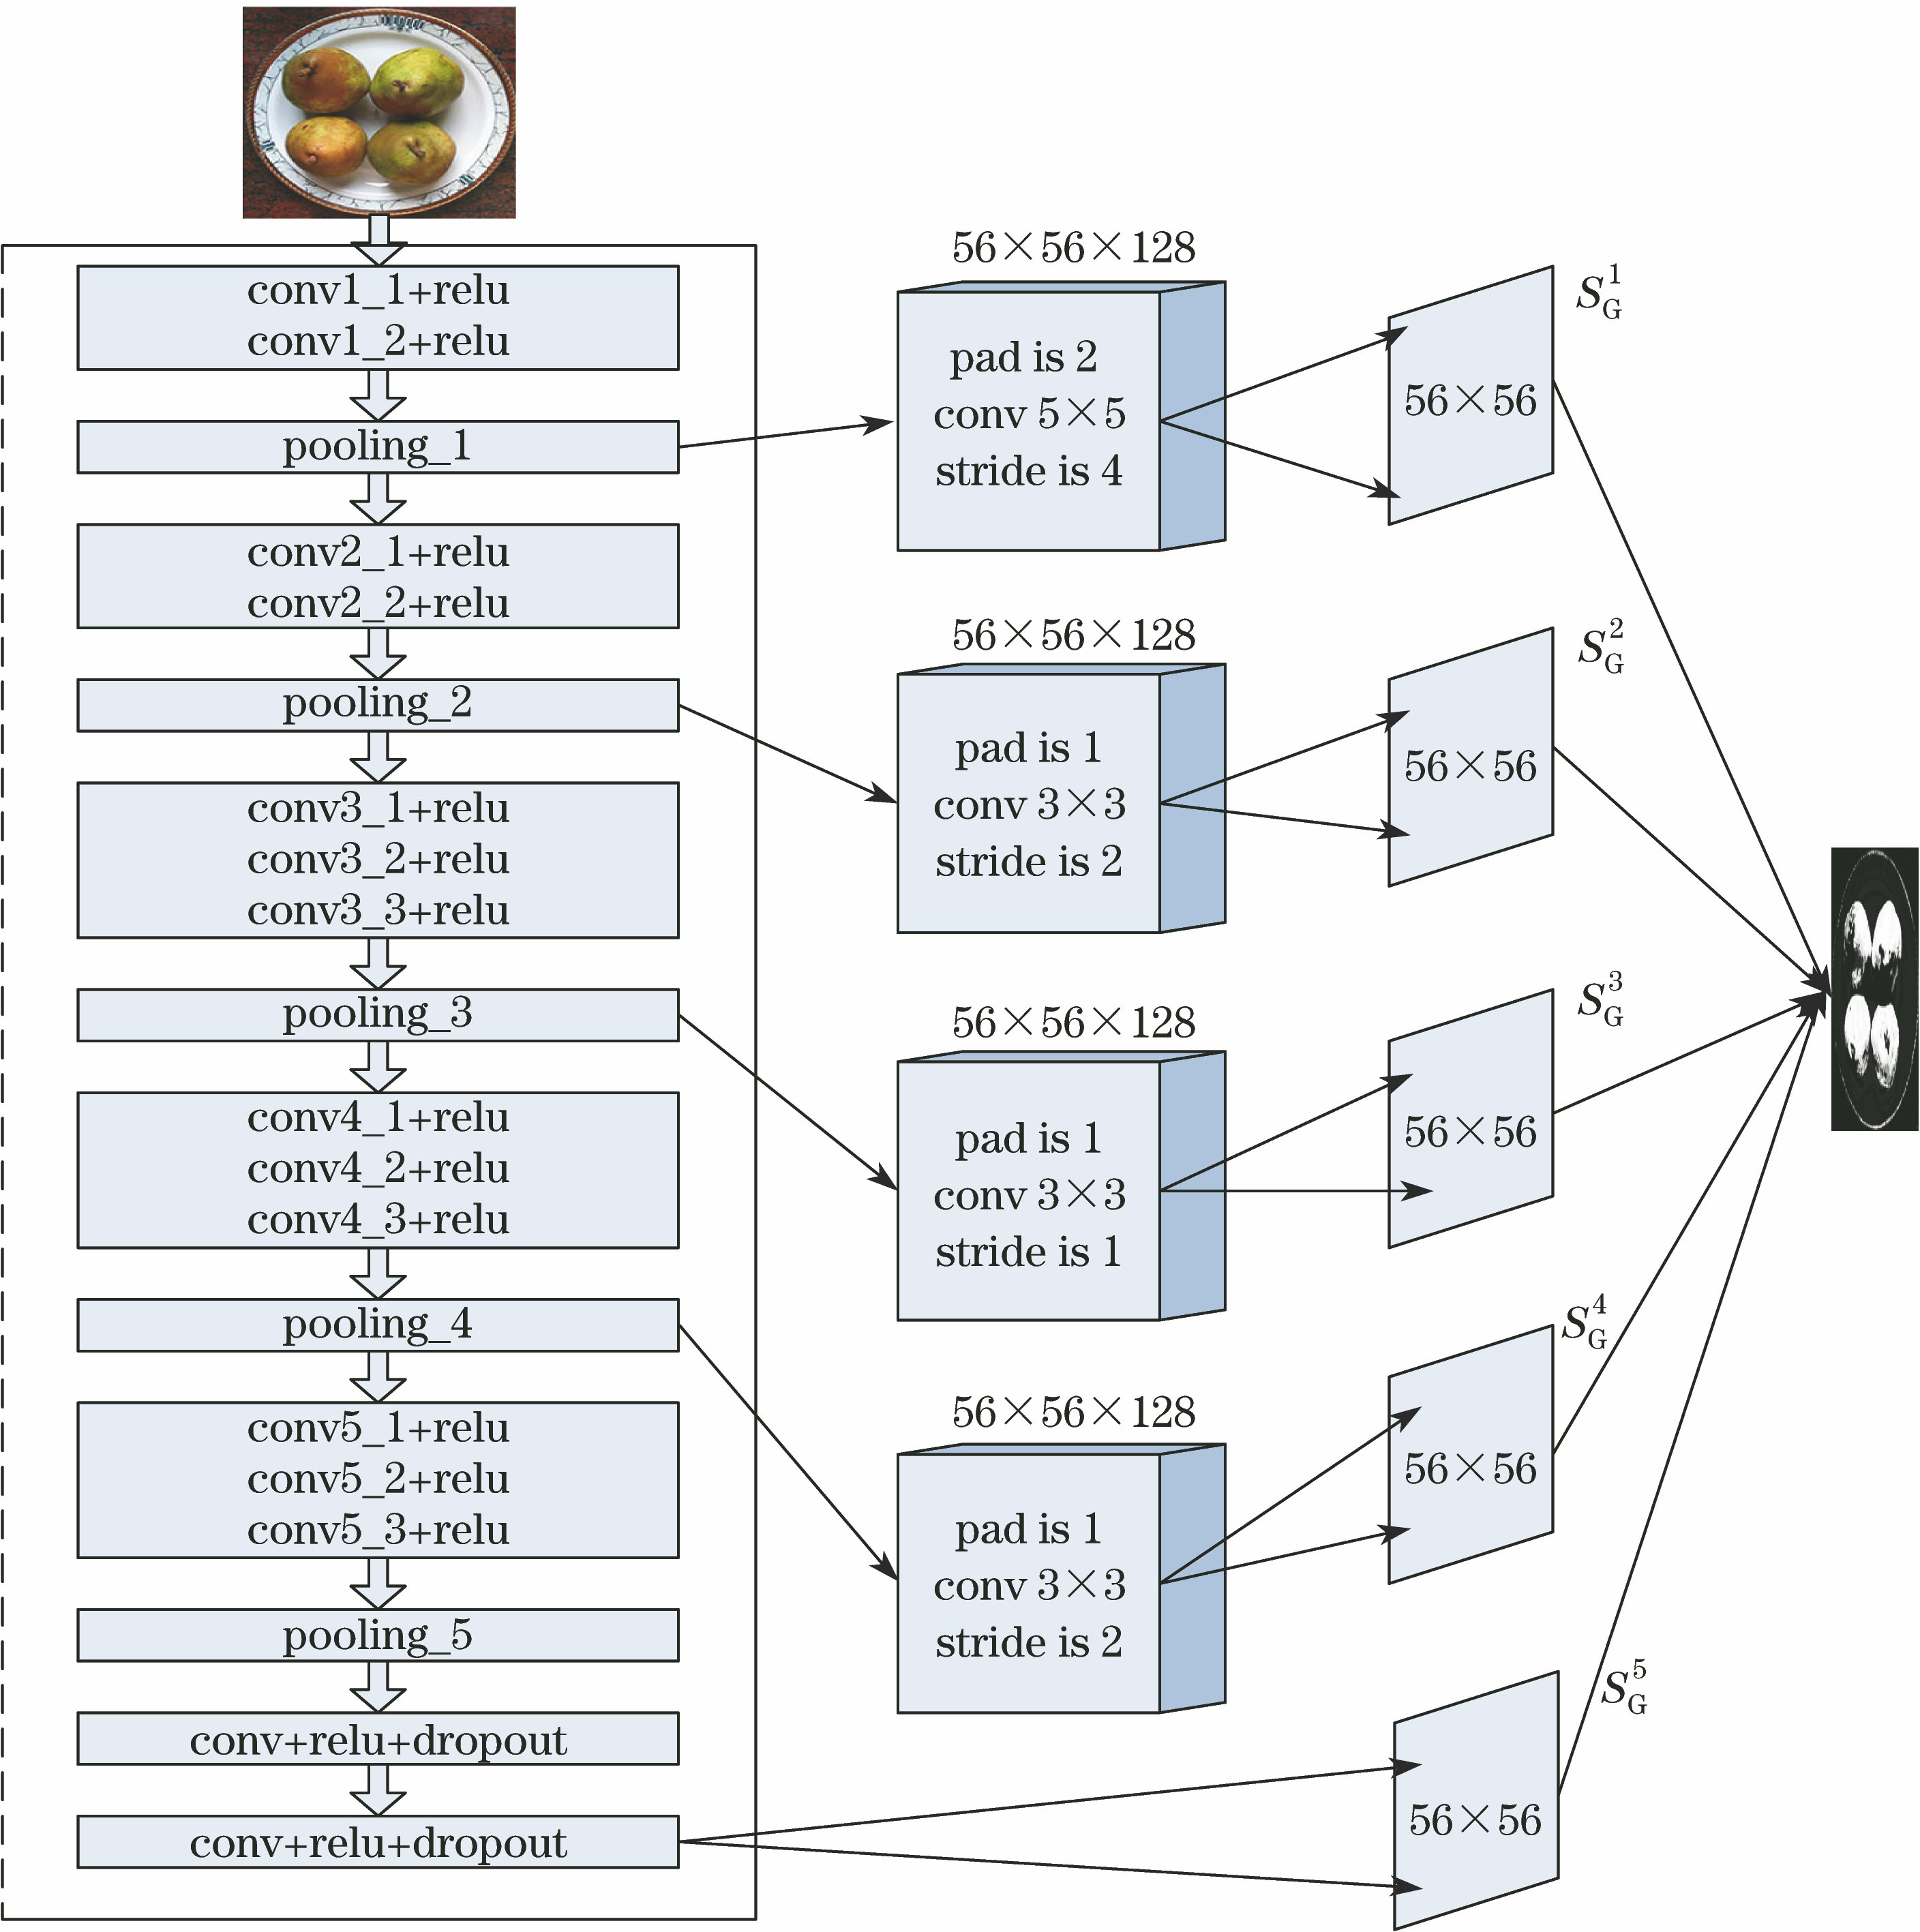
图 2. 全局模型网络结构图
Fig. 2. Network structure of global model
下载图片 查看原文
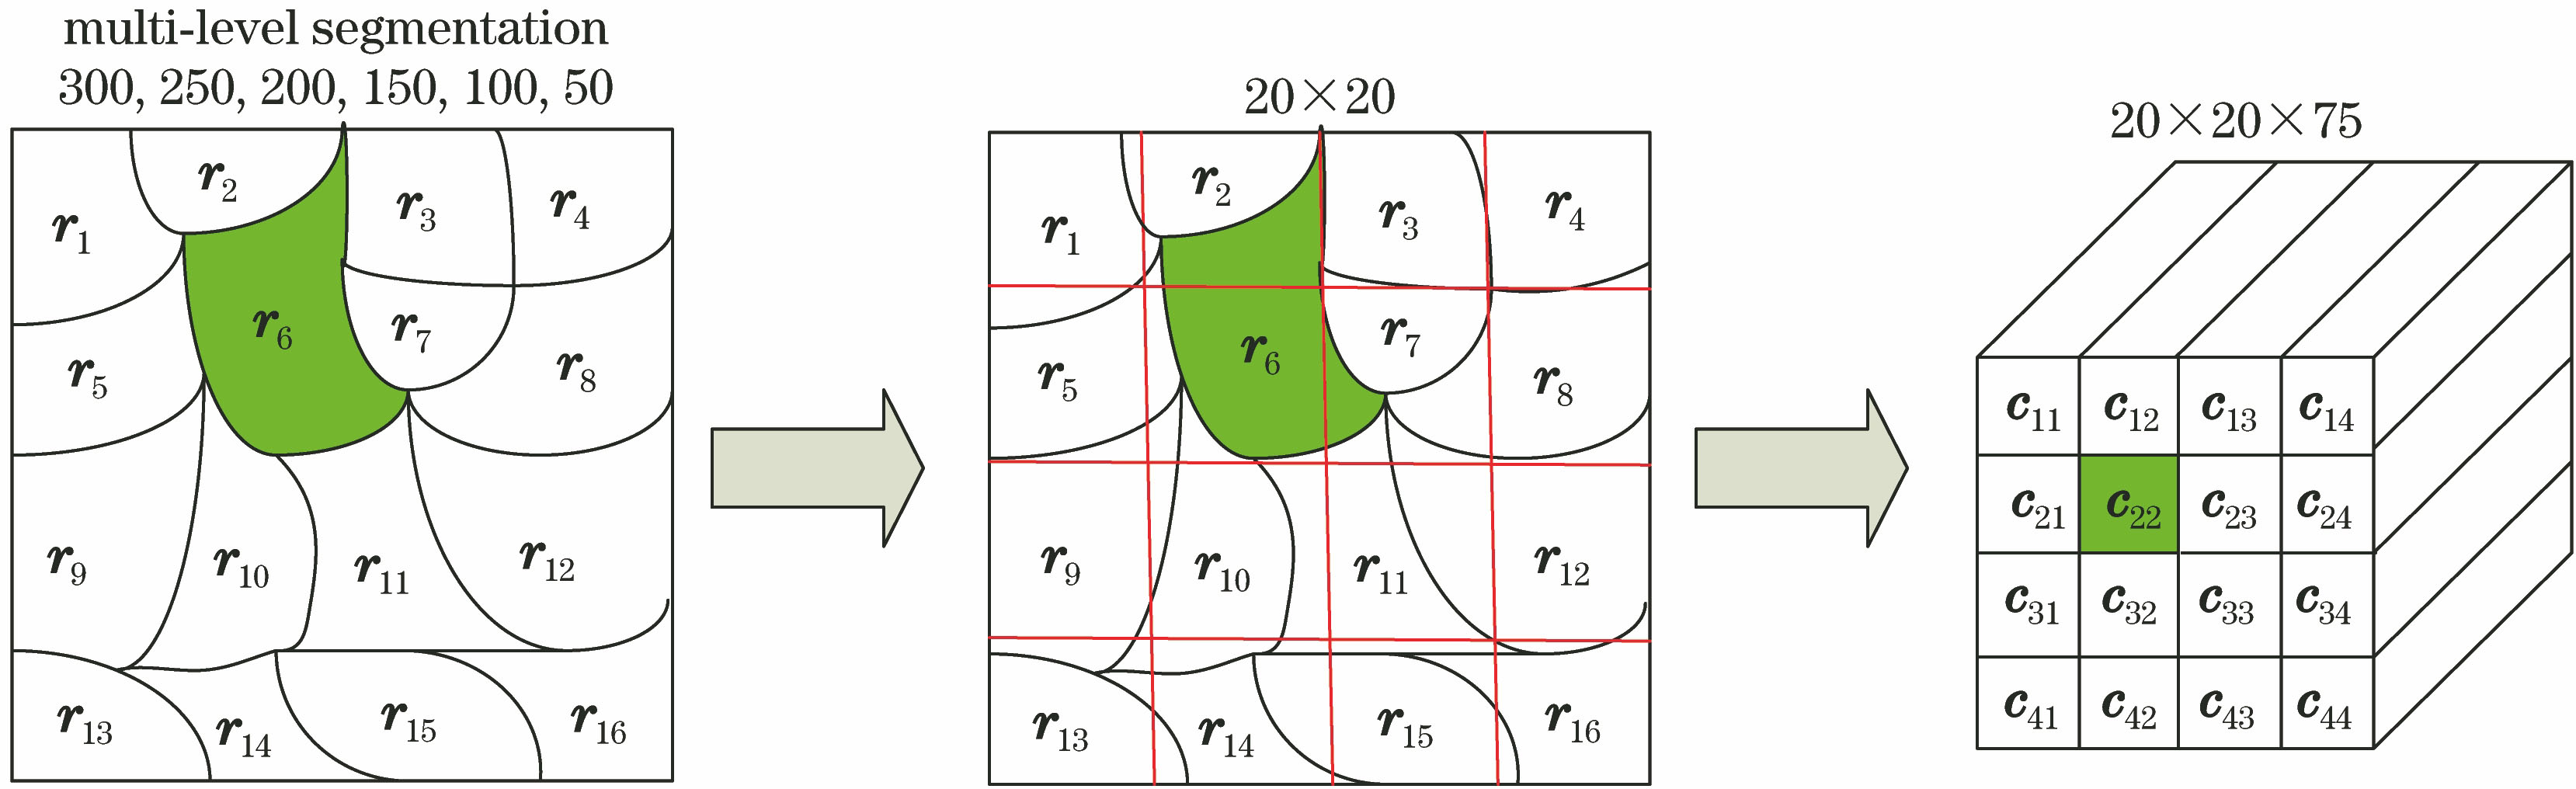
图 3. 超像素点特征向量生成过程
Fig. 3. Generation of feature vectors of super-pixel
下载图片 查看原文
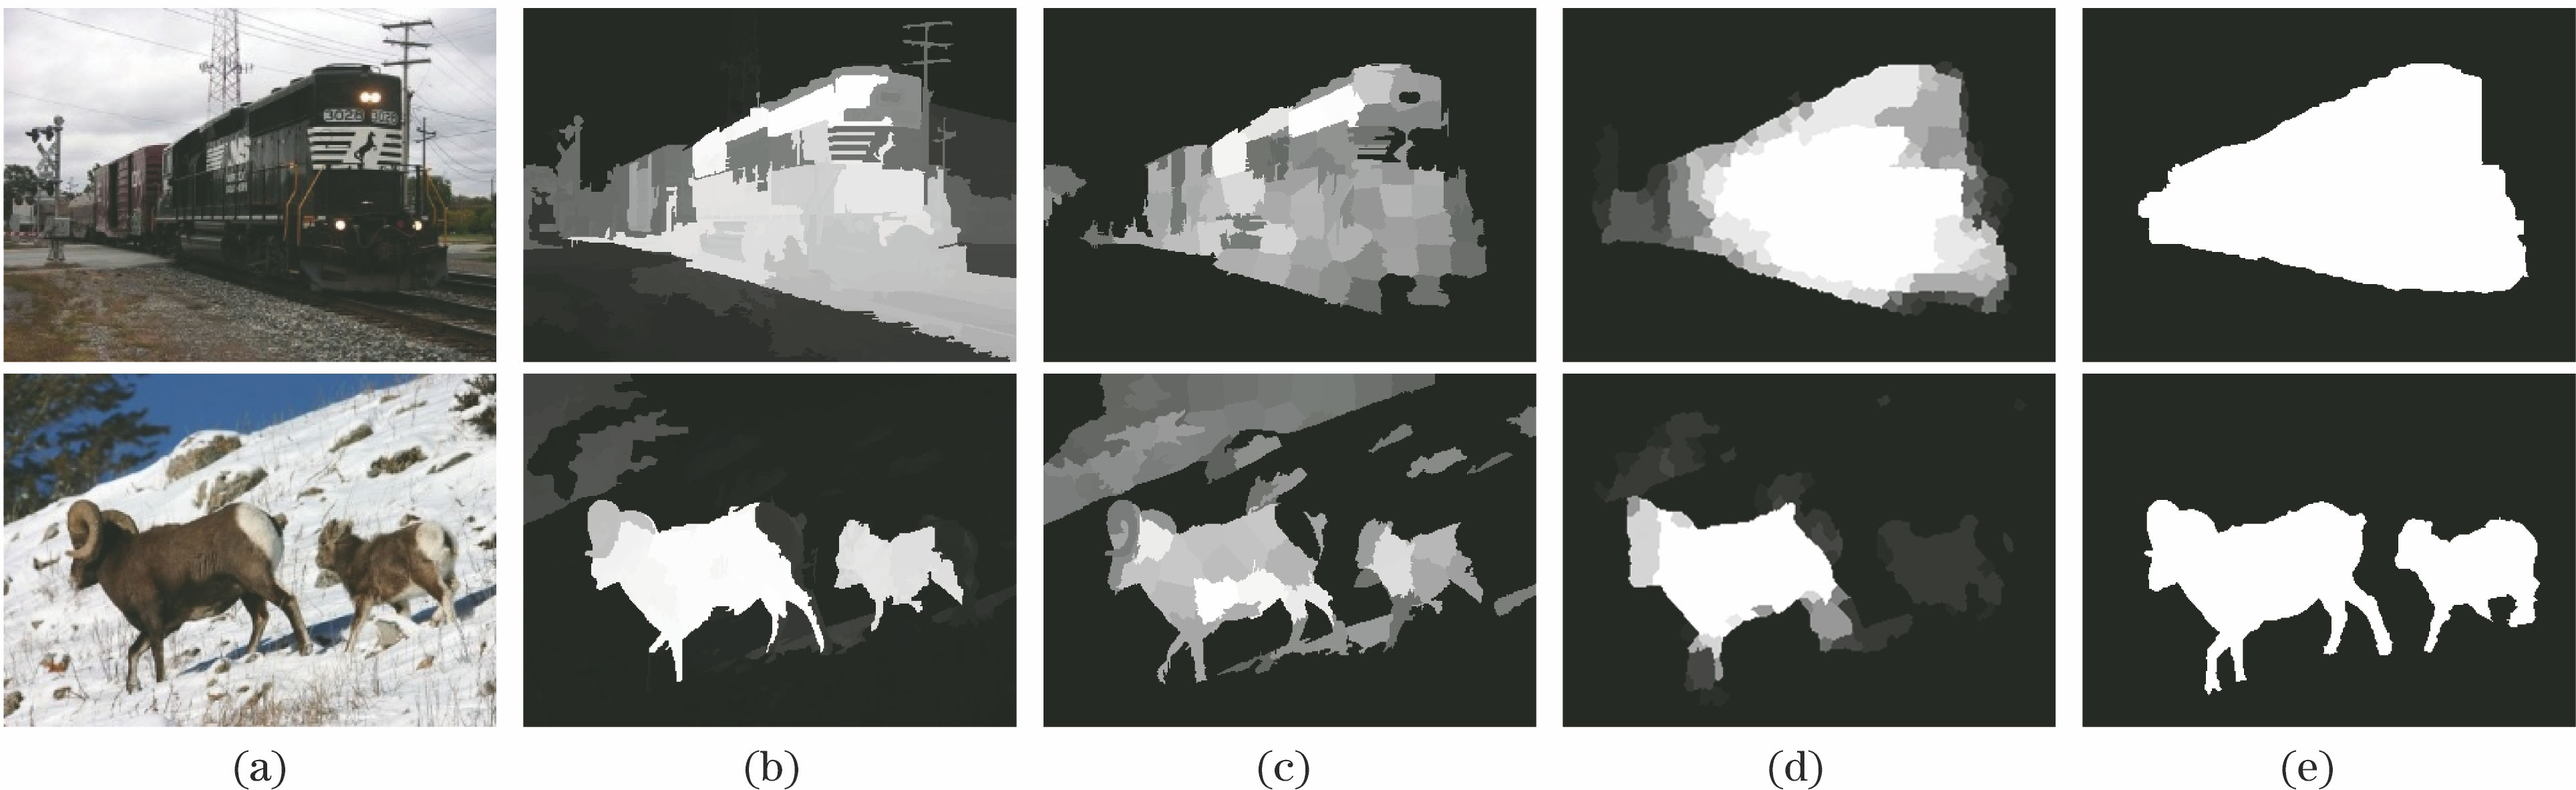
图 4. 各步骤显著图结果。(a)原图;(b)全局模型;(c)局部优化图;(d)最终显著图;(e)标准显著图
Fig. 4. Saliency maps of different steps. (a) Original images; (b) global models; (c) images of local optimization; (d) final saliency maps; (e) ground truth images
下载图片 查看原文
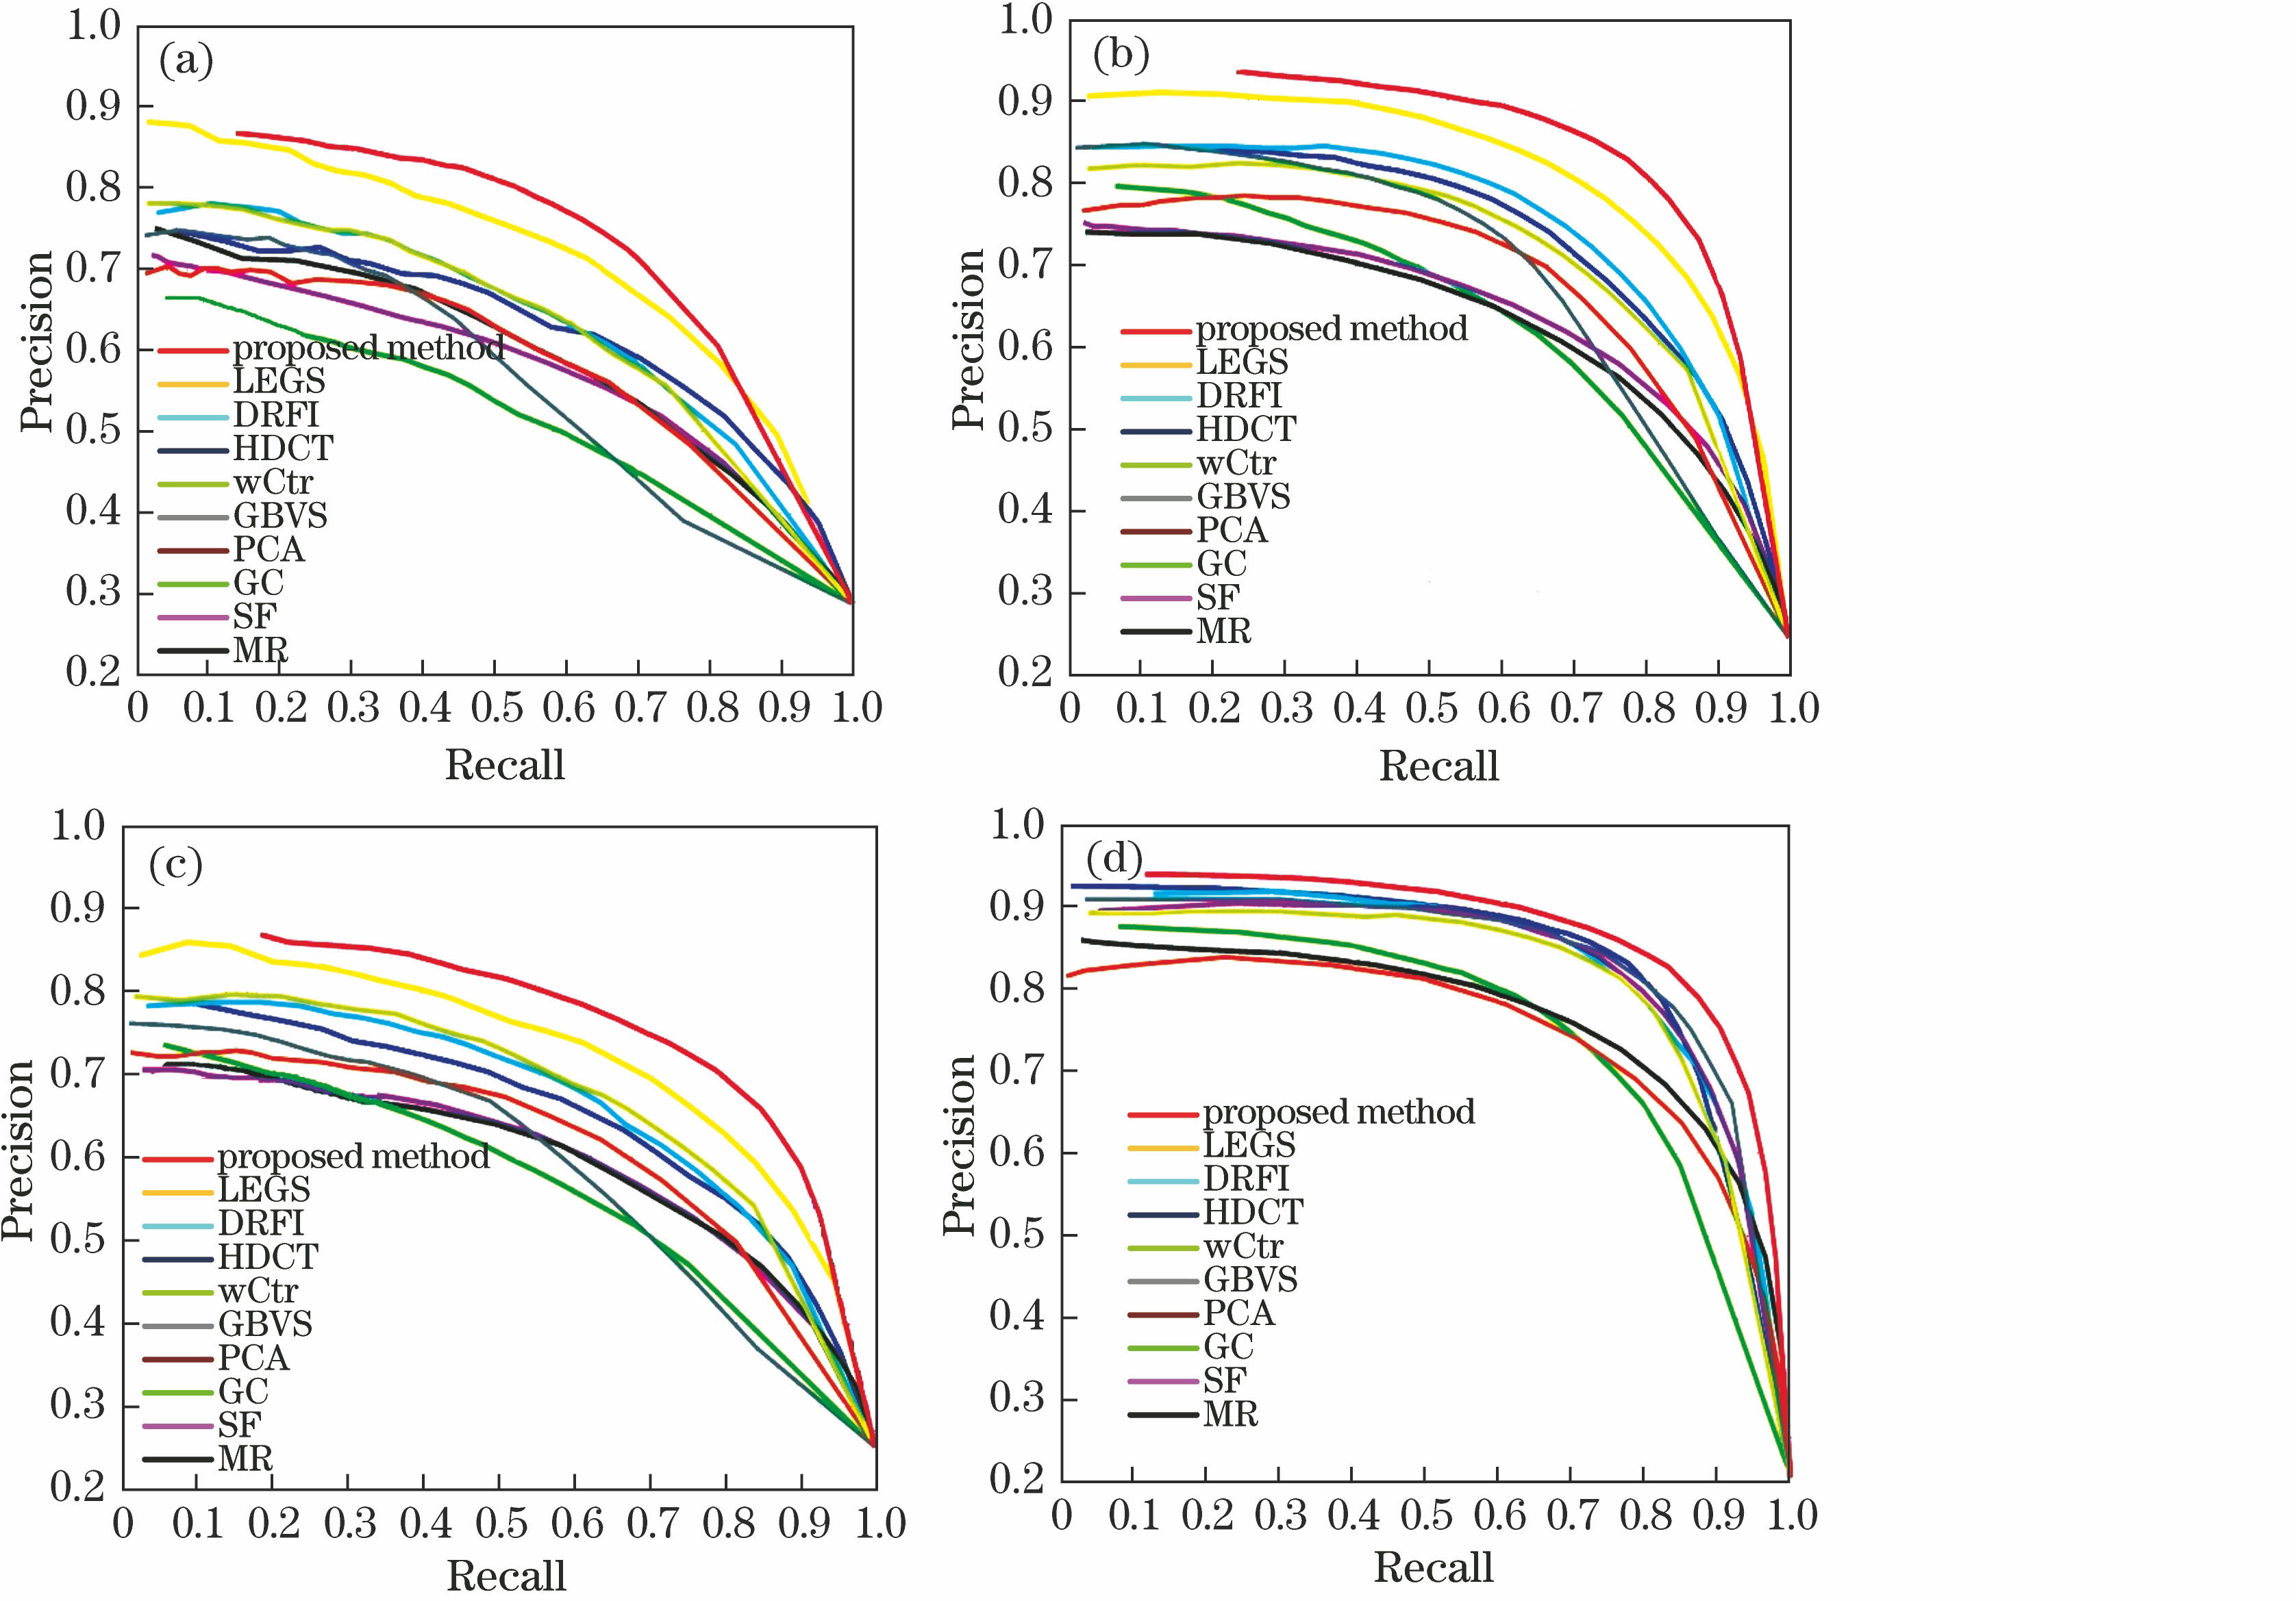
图 5. 4个数据集下不同方法的PR曲线。(a) SOD; (b) PASCAL-S; (c) CSSD; (d) MSRA
Fig. 5. PR curves of four data sets with different methods. (a) SOD; (b) PASCAL-S; (c) CSSD; (d) MSRA
下载图片 查看原文
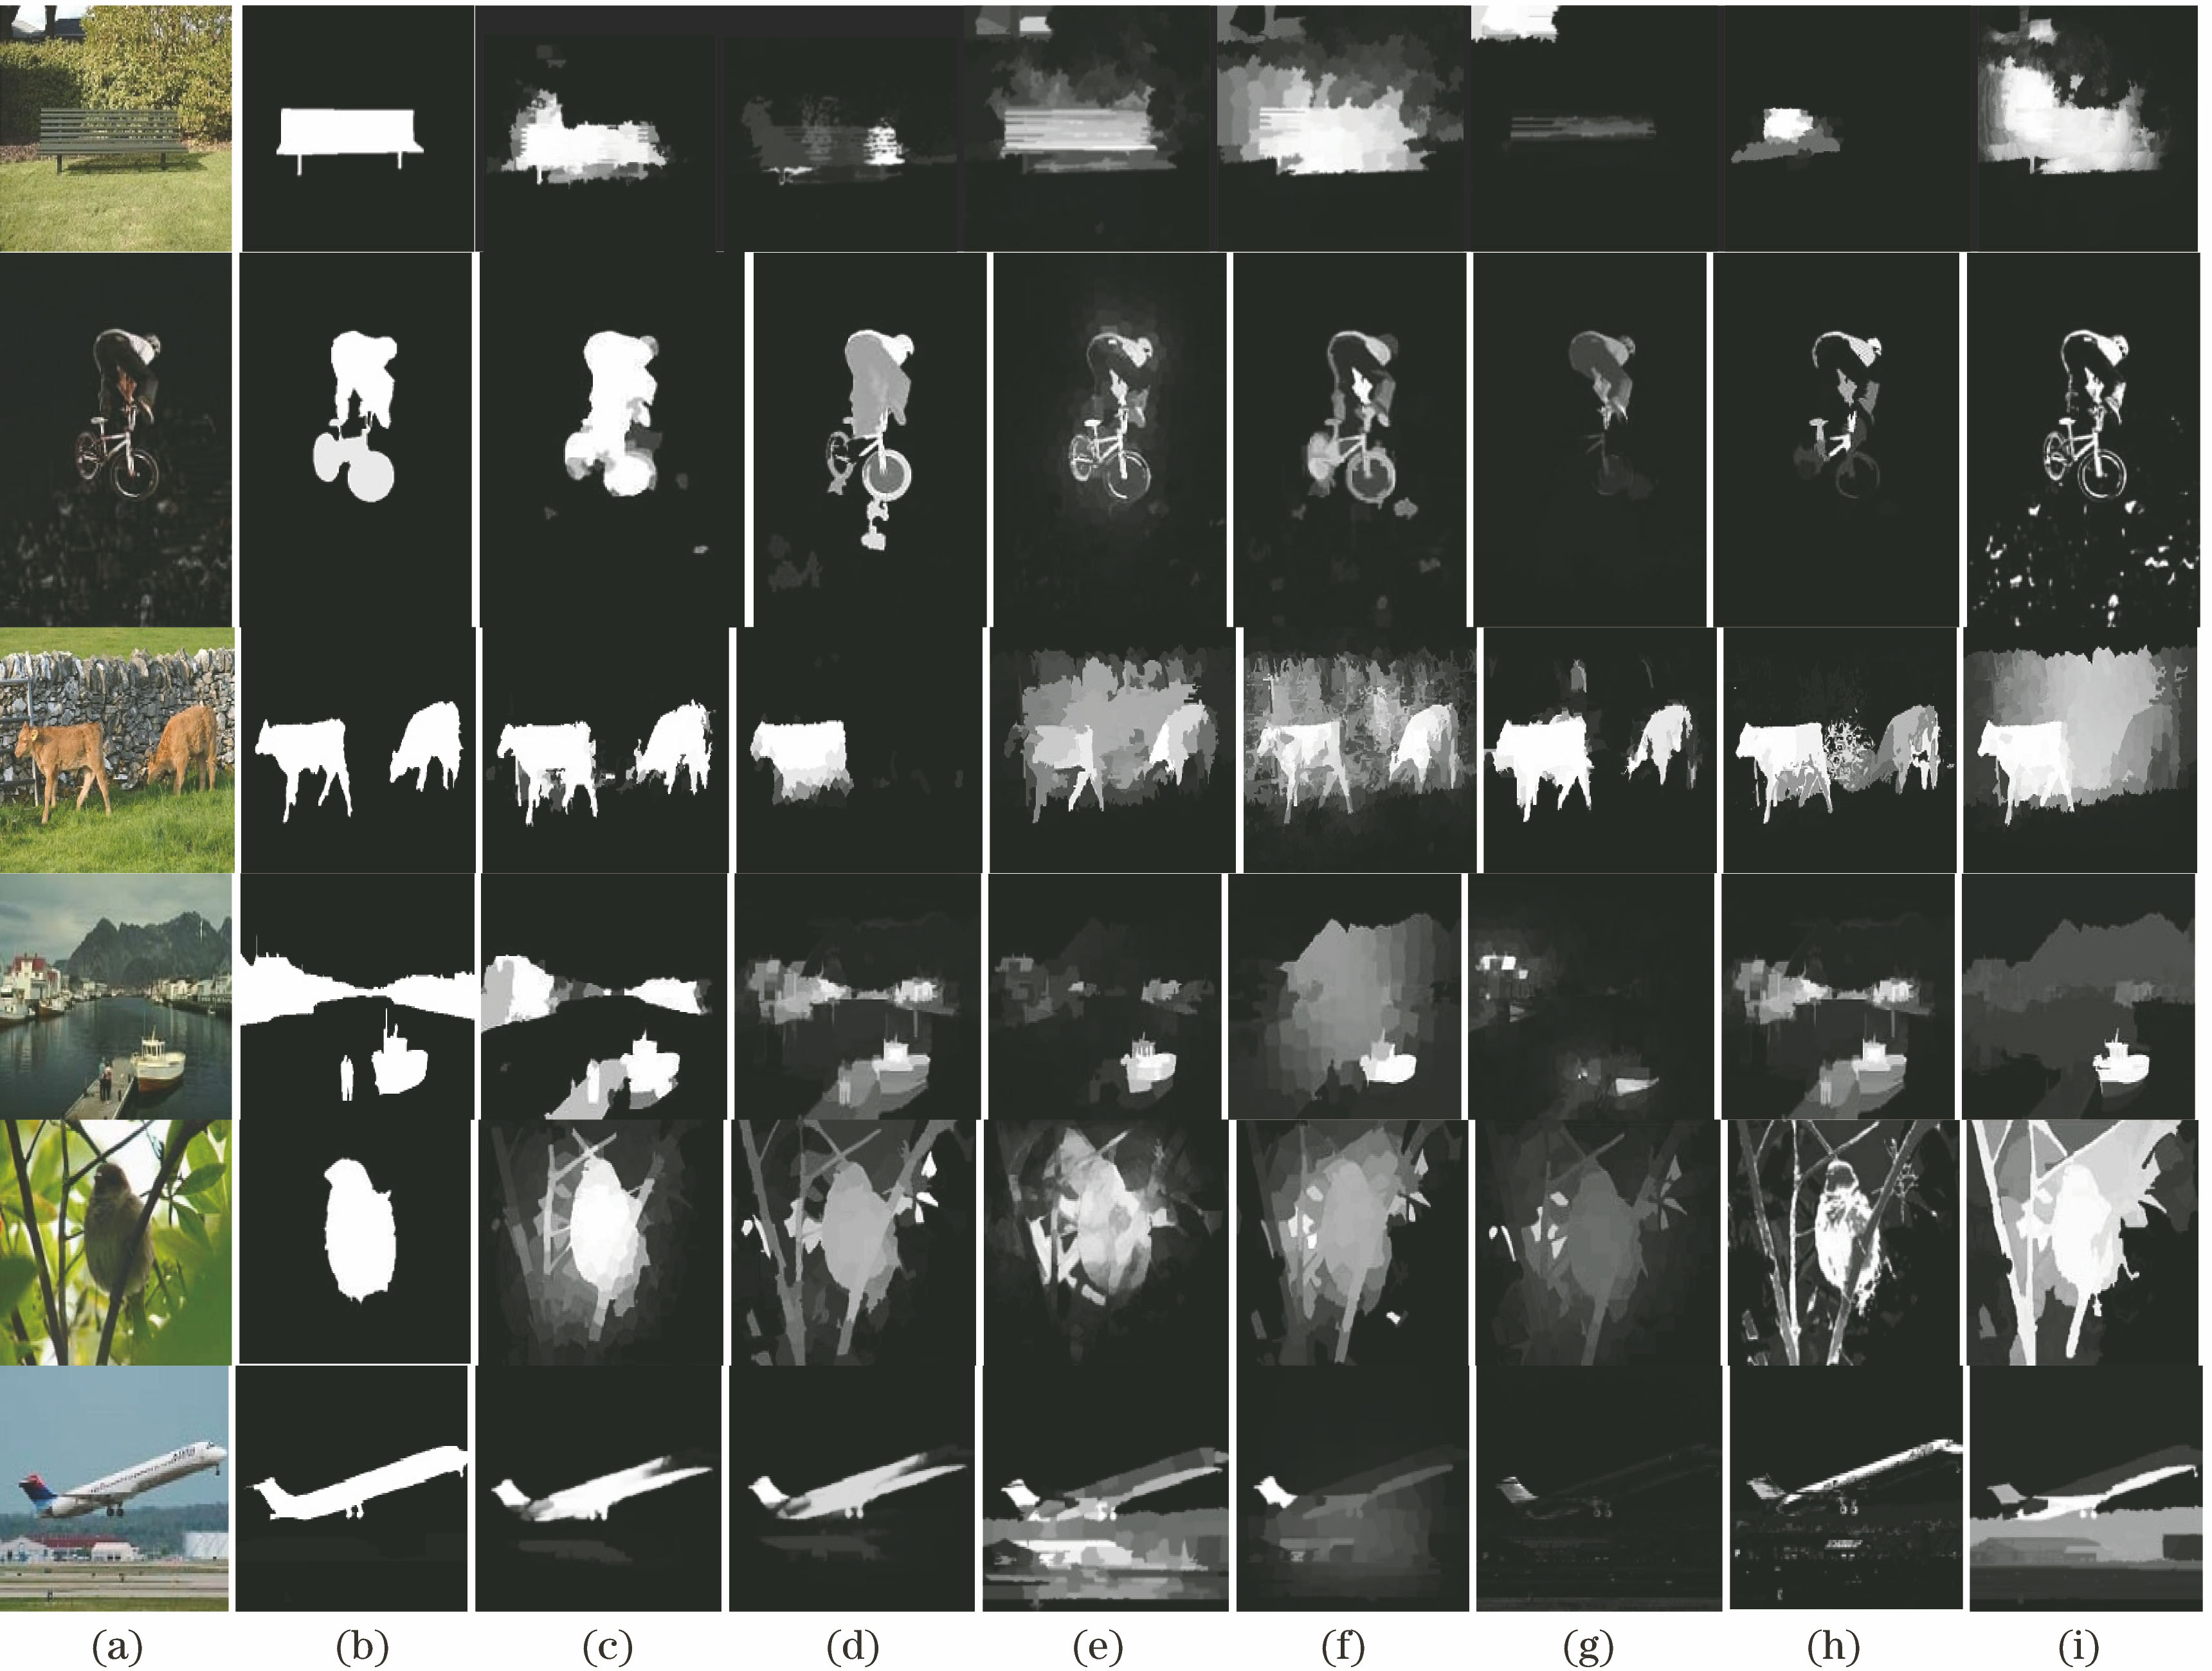
图 6. 本文方法与其他方法显著图对比。(a)原图;(b)标准显著图;(c)本文方法;(d) LEGS;(e) DRFI;(f) HDCT; (g) wCtr;(h) PCA;(i) GBVS
Fig. 6. Visual comparisons of our results and others. (a) Original images; (b) ground truth images; (c) proposed method; (d) LEGS; (e) DRFI; (f) HDCT; (g) wCtr; (h) PCA; (i) GBVS
下载图片 查看原文
表 1对比度描述子特征向量
Table1. Feature vectors of contrast descriptor
| Color texture feature | Differential feature |
|---|
| Feature | Descriptor | Dimension | | Definition | Dimension | | Average RGB value | a1 | 3 | d(,) | 3 | | Average lab value | a2 | 3 | d(,) | 3 | | Gabor filter response | r | 24 | d(rR,rI) | 24 | | Maximum Gabor response | r | 1 | d(rR,rI) | 1 | | RGB color histogram | h1 | 24 | χ2(,) | 1 | | Lab color histogram | h2 | 24 | χ2(,) | 1 | | HSV color histogram | h3 | 24 | χ2(,) | 1 |
|
查看原文
表 2区域特性描述子参数
Table2. Parameters of regional feature descriptor
| Feature | Dimension | Feature | Dimension |
|---|
| Normalized x of regional center | 1 | Regional connectivity[16] | 1 | | Normalized y of regional center | 1 | RGB color variance | 3 | | Normalized are | 1 | Lab color variance | 3 | | Aspect ratio of bounding box | 1 | HSV color variance | 3 | | Bounding box width | 1 | Gabor filter response variance | 24 | | Bounding box length | 1 | Normalized area of neighborhood | 1 |
|
查看原文
表 3不同方法下的F-measure得分对比
Table3. Comparison of F-measure scores with different methods%
| Dataset | Curve | Proposed method | LEGS method | DRFI method | HDCT method | wCtr method | GBVS method | PCA method | GC method | SF method | MR method |
|---|
| SOD | F-measure | 73.1 | 67.4 | 70.2 | 65.4 | 63.7 | 61.3 | 54.9 | 50.6 | 55.3 | 54.2 | | MAE | 20.4 | 21.2 | 24.1 | 26.6 | 24.5 | 26.9 | 25.3 | 28.8 | 26.7 | 27.4 | | CSSD | F-measure | 84.6 | 83.1 | 78.8 | 70.5 | 66.8 | 65.3 | 57.5 | 55.7 | 54.5 | 67.5 | | MAE | 12.8 | 11.9 | 17.9 | 19.9 | 18.4 | 22.7 | 25.2 | 23.4 | 20.1 | 19.0 | | PASCAL | F-measure | 75.3 | 74.9 | 69.9 | 60.4 | 61.1 | 69.3 | 53.1 | 61.6 | 57.4 | 58.3 | | MAE | 14.7 | 15.5 | 20.3 | 22.9 | 20.1 | 17.8 | 23.9 | 25.5 | 21.4 | 21.2 | | MSRA | F-measure | 91.2 | 90.5 | 91.9 | 80.5 | 78.3 | 65.9 | 70.1 | 68.2 | 62.5 | 78.3 | | MAE | 10.4 | 8.9 | 14.3 | 11.9 | 16.6 | 13.7 | 18.9 | 14.7 | 16.2 | 13.0 |
|
查看原文
刘峰, 沈同圣, 娄树理, 韩冰. 全局模型和局部优化的深度网络显著性检测[J]. 光学学报, 2017, 37(12): 1215005. Feng Liu, Tongsheng Shen, Shuli Lou, Bing Han. Deep Network Saliency Detection Based on Global Model and Local Optimization[J]. Acta Optica Sinica, 2017, 37(12): 1215005.


 PDF全文
PDF全文

