基于对流层检测仪和臭氧检测仪的我国近地面NO2浓度的估算对比与优化
Nitrogen dioxide (NO2) in the atmosphere has an important impact on air quality and climate change, and ground-level NO2 will directly affect human health. China is one of the regions with high concentrations of NO2 in the world. Long-term surface NO2 concentration data has been provided by China Environmental Monitoring Station since 2013. In addition, the satellite data can make up for the lack of coverage of ground stations. Compared with the previous ozone detector (OMI) sensor, tropospheric detector (TROPOMI) has higher data coverage and spatial resolution, but its potential for ground-level NO2 estimation needs to be proved, and the underestimation of the estimation model predicting high-value samples needs to be optimized. The purpose of this paper is to use machine learning algorithms to estimate ground-level NO2 concentration in China based on satellite observation data and obtain 0.05-degree NO2 concentration raster data from 2014 to 2021. On this basis, a systematic comparative study is carried out on the difference in the estimation results of TROPOMI and OMI sensor observations, and an optimization model is established to optimize the underestimation of the conventional machine learning model in the high-value area.
The dataset in this paper contains the observations of ground-level NO2 concentration from ground stations, the tropospheric NO2 column concentration provided by OMI and TROPOMI which come from European Space Agency and Google Earth Engine, and auxiliary data that contains meteorological data of ERA5, population data, surface elevation data, and land use data. Data preprocessing includes assigning station data to the nearest grid and resampling data with different spatial resolutions to 0.05 degrees. The dataset and the algorithm are used to build a model with the algorithm named XGBoost, which is optimized on the basis of GBDT, so as to have higher prediction accuracy. The features of the model are selected by variance inflation factor (VIF) and analyzed by shapley additive explanation (SHAP) value. By comparing the temporal and spatial coverage of TROPOMI and OMI sensor observation data and comparing satellite imagery and estimation results for a specific area, we study the difference between these two data in estimating ground-level NO2 concentration. In addition, the estimation model is optimized by establishing an ensemble model that contains a classification model and a high-value prediction model.
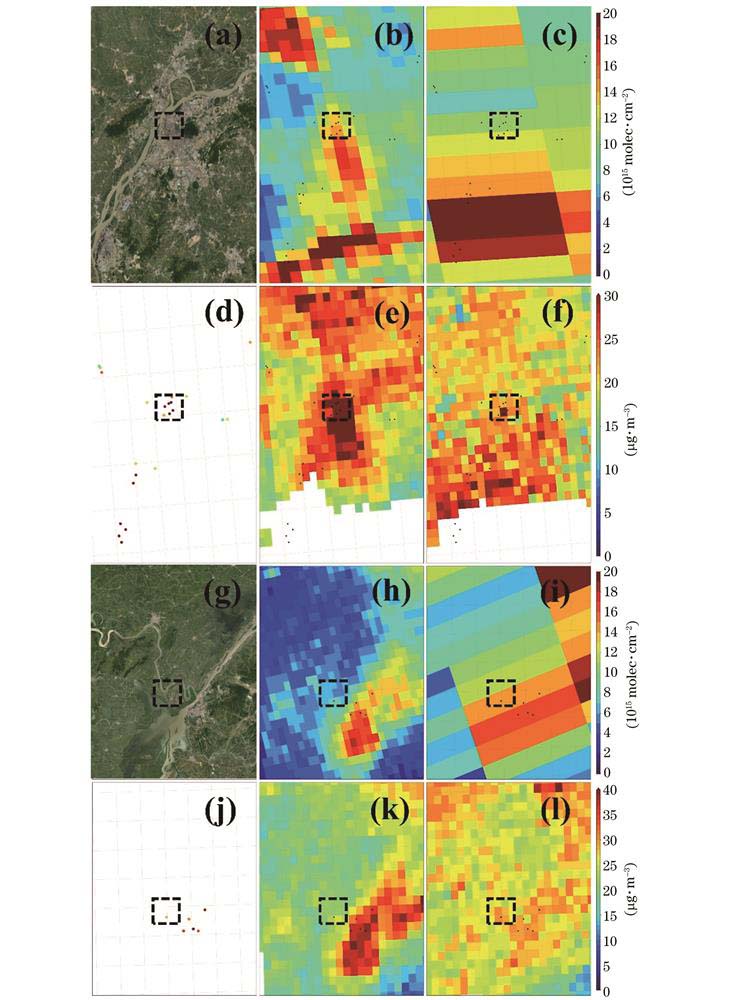
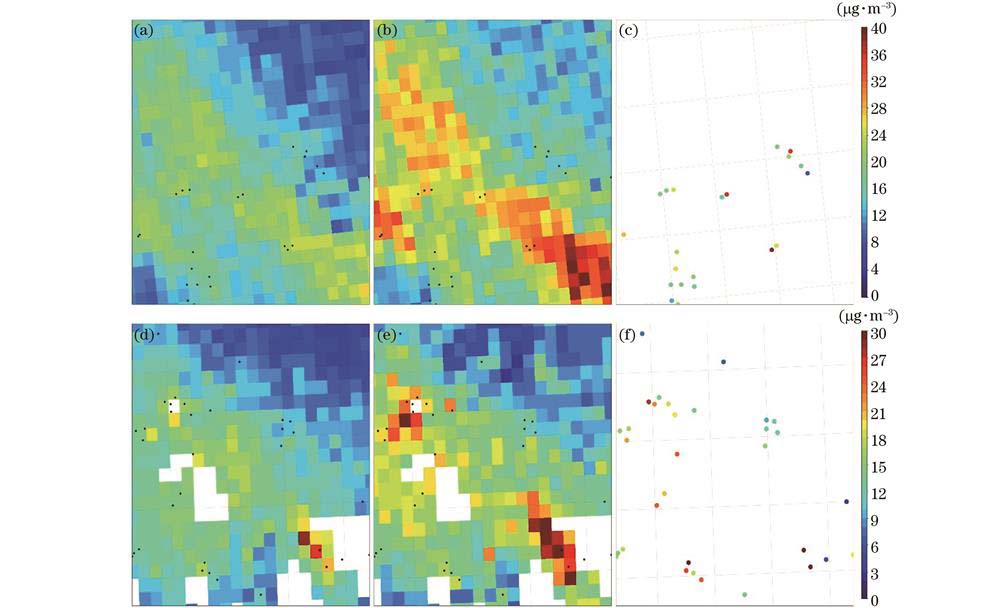
Uneven spatial distribution of ground stations will cause the estimation results to present the same value in the area with fewer ground stations, so the accuracy of estimation will be poor (Fig. 2). The VIF of features that connect with geographic information is much higher than the threshold, which is supposed to be 10, and the VIF of surface pressure and DSM is out of the threshold (Fig. 3). After comparing the correlation coefficient between the two and the surface observations and the update frequency of the two, we decide to remove the surface elevation and retain the surface pressure. Feature importance of the OMI data computed by SHAP value is 6.09, which is much more than those of others (Fig. 3). According to the Beeswarm from SHAP value of each feature, it can be found that when the observed value of OMI is higher, it will have a positive effect on the predicted value, or in other words, when the observed value of OMI is higher, it will lead to an increase in the predicted result, and when it is lower, it will make prediction results decrease (Fig. 3). The temporal and spatial resolution of TROPOMI data is higher than that of OMI (Fig. 4), and the machine learning accuracy evaluation index of the estimation result is better than that of OMI (Fig. 5). By comparing satellite observations and estimating specific regions with ground-based observations, it is found that TROPOMI data with higher spatial resolution can identify changes from spatial gradient that fails to be identified in OMI data, resulting in more accurate estimates (Fig. 6). By classifying high-value samples first and then building an additional high-value sample model for estimation, the optimized estimation model successfully increases the slope of the scatter diagram of the estimation results from 0.79 to 0.89, and the R2 increases from 0.79 to 0.85 (Fig. 7). It can also be seen from the image that the estimation results of the optimized model are closer to the ground observations (Fig. 8).
1) There is serious multicollinearity in the latitude and longitude information in the prediction model variables, which will affect the quality of model estimation; 2) The data coverage of TROPOMI is higher than that of OMI, and the estimation result is better than that of OMI, ten-fold cross-validation (R2: 0.79 VS 0.75, slope: 0.79 VS 0.74); 3) The high spatial resolution of TROPOMI can identify high or low NO2 near-surface areas that cannot be identified by OMI; 4) By establishing an integrated model and selecting high-value samples for separate processing, the prediction accuracy can be significantly improved; R2 is increased from 0.79 to 0.85, and the slope of the fitting line is increased from 0.79 to 0.89.
1 引言
大气中的二氧化氮(NO2)对空气质量和气候变化都有重要的影响,我国的NO2主要来自化石燃料的燃烧,近年来机动车排放的尾气逐渐成为其主要来源[1-3]。空气中NO2浓度过高会直接影响人类的身体健康,增加心脑血管疾病和肺癌的发生率[4-8]。我国是全球NO2浓度高值地区之一[9-10],开展近地面NO2浓度及其时空分布情况的分析对大气污染防治和流行病学研究等均有重要意义。2013—2020年,我国陆续建立了超过2000个空气质量监测站,可以对包括NO2在内的6个空气质量参数进行实时监测[11],为近地面NO2浓度研究提供了可靠的数据。但地面观测站覆盖的区域有限,且分布不均匀。因此可借助覆盖范围更广的卫星观测数据对近地面NO2浓度进行估算[12-13]。已有研究多采用卫星传感器臭氧监测仪(OMI)提供的数据估算近地面NO2浓度[14-16],但是OMI存在行异常[17]等因素导致的空间覆盖度较低和空间分辨率较低等缺陷[17-18]。近期,具有更高分辨率和空间覆盖度的对流层监测仪(TROPOMI)[19]提供的数据被应用于近地面NO2浓度估算中[20-22],已有研究对TROPOMI数据相对于OMI数据的优势进行了分析[23-24],但对于TROPOMI和OMI估算近地面NO2结果上的具体差异缺乏系统的对比研究。
目前借助遥感数据估算近地面NO2浓度的方法有化学传输模型估算(如GEOS-CHEM模型)、土地利用类型回归估算(LUR模型)等,与这些方法相比,机器学习算法可以更高效地处理变量之间复杂的非线性关系。本文使用的极限梯度提升(XGBoost)算法与其他机器算法相比具有更高的精度[25-27]。对于机器学习模型估算近地面NO2浓度中存在的误差,已有研究通过对算法模型进行优化使估算结果精度得到了提升[14,22],但对于模型估算高值样本时存在低估情况的优化,目前还缺乏针对性的研究。
为此,本文采用XGBoost算法建立模型,以地面观测站的数据为学习目标,结合卫星观测的对流层NO2柱浓度数据以及其他辅助数据,对没有地面观测数据的区域进行预测,在此基础上系统性对比了TROPOMI数据和OMI数据在近地面NO2浓度估算中的差异,并采用建立集成模型的方式针对模型估算结果低估的情况进行了优化,从而得到高覆盖率、高精度的近地面NO2浓度数据。
2 数据与方法
2.1 数据与方法
本文使用的数据包括:地面观测数据、OMI和TROPOMI卫星遥感数据、欧洲中期天气预报中心(ECMWF)气象数据以及辅助数据(人口数据、地表高程以及土地利用类型数据等),数据的时间跨度为2018年7月到2021年12月,空间范围是中国大陆。地面观测数据来自国家空气质量监测站,其数据已被用于开展大气质量研究[28-31]。卫星数据中,OMI的 NO2对流层垂直柱浓度数据使用欧洲联盟QA4ECV计划提供的L2级数据(https://www.temis.nl/ airpollution/no2.Php),星下点空间分辨率为13 km×24 km,其反演算法精度已经过验证,与MAX-DOAS的观测值偏差为-2%,均方根误差为16%[32-33];TROPOMI 的NO2对流层垂直柱浓度数据使用Google Earth Engine(GEE)提供的L3级数据(https://developers.google.com/earthengine/datasets/catalog/COPERNICUS_S5P_OFFL_L3_NO2),空间分辨率为0.05°,该数据是基于OMI的DOMINO-2产品和QA4ECV产品开发的,已有研究对精度进行了验证对比[34],结果表明,TROPOMI数据月均值与地面观测数据的相关系数达到0.9,数据质量优于OMI QA4ECV。气象数据是ECMWF提供的ERA5再分析数据,包括地表温度、湿度,风速风向,地面气压以及边界层高度,时间分辨率为1 h,空间分辨率最高为0.1°。人口数据来自WorldPop提供的年度人口栅格数据,土地利用类型数据来自MODIS传感器的产品MCD12Q1,地表高程数据来自日本ALOS卫星提供的DSM产品。
2.2 数据处理
数据预处理主要包括4个方面:1)将离散的地面站观测数据整合成标准格式的栅格数据,以0.05°为范围,将地面观测值赋给最近的栅格,如果同一个栅格内不止一个观测站则取它们的均值作为栅格的值;2)选取中国区域附近的约三轨由OMI提供的L2级轨道数据,采用面积加权法,借助HARP(http://stcorp.github.io/harp/doc/html/)工具将L2数据融合裁剪为范围内的L3栅格数据作为OMI的日均值,空间分辨率为0.05°;3)ERA5气象数据原分辨率为0.1°和0.25°,采用线性插值法将其插值到0.05°,以匹配栅格数据,时间分辨率为1 h,所以可以选取卫星过境时间附近小时的数据;4)人口数据和土地利用类型数据均为年度数据。地表高程数据采用的是2021年1月发布的再处理数据Version 3.2,插值到0.05°后复制到每一天。上述数据均使用WGS84坐标系,处理成同空间分辨率的栅格后可以整合到同一个数据集中,将其向量化后以表格形式存储,按时间和经纬度的顺序排列,每一列表示一类数据,即机器学习中的一个特征。筛选出地面观测值有数据的样本作为模型训练数据集,采用XGBoost算法建模训练预测,得到模型后输入时空匹配好的数据集进行预测,即可得到高空间分辨率的近地面NO2浓度数据。数据处理流程如
2.3 模型介绍
基于卫星数据估算近地面NO2浓度的方法主要有化学传输模型、土地利用回归模型、回归模型等。化学传输模型较早被应用于近地面NO2浓度估算[35-37],Freddy等[35]利用GEOS-CHEM模式对哥伦比亚地区的近地面NO2浓度进行了估算。在土地利用回归模型(LUR)中加入卫星数据也是常见的近地面NO2浓度估算方法[15,38-39],但以多元线性回归建模的LUR算法难以拟合预测变量和响应变量之间的非线性关系,同时也存在严重的多重共线性情况[40]。相比较上述模型,基于卫星遥感数据的机器学习模型在近地面NO2的估算中效果会更好[41-42],其中,由决策树组成的集成算法是比较常见的机器学习估算模型,即让多个决策树独立学习做出预测再将结果结合到一起,这样的结果会比单决策树的效果更好或者至少一致。集成方式主要有Bagging和Boosting两种,其经典算法分别是随机森林(RF)和梯度提升树(GBDT)[43-44],均已被用于气态污染物估算[15,45]。本文使用的XGBoost算法是在GBDT的基础上进行了优化,将后者使用的把损失函数梯度下降方向近似为残差值的方法,改为损失函数的二阶泰勒展开,更加接近损失函数的真实情况,收敛更快,且在目标函数中加入了正则化的部分来进一步防止模型过拟合,XGBoost算法与之前的机器学习算法相比,在预测精度和训练速度上都有显著提升[46-47]。目前,已有Just等[48]采用XGBoost算法对美国东北部的AOD浓度进行了估算,并与RF以及GBDT算法进行了对比。Shtein等[25]使用XGBoost算法对意大利的日均PM2.5和PM10浓度进行了估算。Li等[26]在估算高时空分辨率风速时也采用了XGBoost算法,上述研究中XGBoost算法均展现了其优越的性能。
本文在相同条件下,即输入变量和迭代次数都相同的情况下对比了XGBoost模型与其他常用的机器学习模型的预测情况,对比参数包括平均绝对误差(MAE)、均方根误差(RMSE)、决定系数(R2)和运行时间,结果如
表 1. 不同算法估算结果对比
Table 1. Comparison of estimated results of different algorithms
|
因此本文选择采用XGBoost算法建立近地面NO2估算模型,响应变量为地面站观测值,训练样本采用地面站观测值和卫星观测值均不为空值的样本,训练过程中分出5%的样本作为测试集验证模型训练情况,以2020年的OMI观测数据集为例,采用十折交叉验证的方式得到的估算模型训练集R2为0.75,验证集R2为0.71。
2.4 地面与卫星数据匹配
搭载OMI的Aura卫星和搭载TROPOMI的Sentinel5P卫星均为极地轨道卫星,过境时间为当地时间13:00-14:00之间,为了提高估算精度,选取最接近这个时间的地面站数据作为模型学习对象。而地面观测数据中的时间指的是该时刻前一个小时观测结果的均值,因此为了尽量接近卫星观测时间,选择14:00的数据,即当天13:00-14:00间的测量均值。再按照预处理第一步的方法将其匹配到栅格中。
3 结果与分析
3.1 特征筛选及重要性对比
如

图 2. 地面站分布对估算结果的影响。(a)地面站分布情况;(b)加入经纬度坐标特征的模型估算情况;(c)加入球面坐标特征的模型估算情况;(d)去掉样本地理位置信息特征的模型估算情况
Fig. 2. Influence of ground station distribution on estimation results. (a) Geographic position of ground stations; (b) estimation of model with latitude and longitude coordinate features; (c) estimation of model with spherical coordinate features; (d) estimation of model without sample geographic information features
在进行回归分析时,各个预测变量之间存在一定的相关性,这种现象称为多重共线性。当多重共线性现象严重的时候,会导致回归分析结果不稳定。此处使用方差膨胀系数(VIF)[50]对2020年参与训练的预测变量模型进行评估,一般认为VIF小于10时说明该变量的多重共线性情况在可接受范围内。
如

图 3. 预测变量对模型影响的分析。(a)估算模型各个特征的VIF;(b)OMI数据集中各特征的SHAP绝对均值;(c)OMI数据集中各特征SHAP值的Beeswarm图
Fig. 3. Analysis of influence of predictive variables on model. (a) Variance inflation factor (VIF) from each feature of estimation model; (b) absolute mean about SHAP value of each feature from OMI dataset; (c) Beeswarm image from SHAP value of each feature in OMI dataset
机器学习一般用特征重要性(feature importance)来衡量数据集中每个变量的重要性,但这样无法判断变量具体在模型中起到什么作用。因此引入shapley additive explanation(简称SHAP值)对参与构建模型的特征进行解释,将模型中的特征作为“贡献者”,对于每一个样本,SHAP值指该样本预测值中每一个特征的贡献值。
目前SHAP已被用于解释机器学习模型中的特征与响应变量之间的关系[51-52]。将所有样本中某一个变量对目标变量影响程度的绝对值作均值,可作为这个变量在模型中的重要性,从
3.2 OMI和TROPOMI数据估算结果对比
本文使用的卫星对流层NO2观测数据有TROPOMI和OMI两种,接下来对分别使用两种卫星数据构建的估算模型的训练情况进行对比。首先对比两种卫星数据的时空覆盖度。图

图 4. 卫星数据时空覆盖度。(a)OMI对流层NO2数据覆盖度的空间分布;(b)TROPOMI对流层NO2数据覆盖度的空间分布;(c)2018—2021年TROPOMI和OMI对流层NO2数据覆盖度的时间分布
Fig. 4. Spatio-temporal coverage of satellite data. (a) Spatial distribution of tropospheric NO2 data coverage by OMI; (b) spatial distribution of tropospheric NO2 data coverage by TROPOMI; (c) daily coverage of data about TROPOMI and OMI from 2018 to 2021
从两种数据的估算结果统计分析可知(

图 5. 2018—2021年TROPOMI和OMI数据集进行近地面NO2估算交叉验证结果散点图。(a)TROPOMI估算结果散点图;(b)OMI估算结果散点图
Fig. 5. Scatter plot of cross-validation from ground-level NO2 estimation by TROPOMI and OMI datasets from 2018 to 2021. (a) Scatter plot of estimation from TROPOMI; (b) scatter plot of estimation from OMI
影响近地面估算结果精度的因素有反演算法、数据空间分辨率、模型参数设置等,本文采用的两组卫星数据反演算法均为DOAS,在采用同一估算模型且设置相同参数的情况下,重点研究不同空间分辨率对估算结果的影响。
OMI的星下点分辨率为13 km×24 km,而TROPOMI目前分辨率可达到3.5 km×5.5 km,因此在相同的范围内TROPOMI可以识别更多的空间细节。利用卫星观测值估算近地面NO2浓度时,卫星像素分辨率低是导致低估的原因之一[18]。对比地面和飞机观测结果表明,低分辨率的卫星数据无法识别像素内部单个点源的排放导致的高值区,从而导致对NO2高值的低估[53-55]。因此本文选取中国东南部区域作为研究范围,如

图 6. TROPOMI和OMI观测数据空间分辨率对比分析。(a)中国东南部区域的Google Earth卫星图像;(b)TROPOMI L2级轨道数据;(c)OMI L2级轨道数据;(d)地面站观测数据;(e)TROPOMI估算结果;(f)OMI估算结果;(g)中国中部区域的Google Earth卫星图像;(h)TROPOMI L2级轨道数据;(i)OMI L2级轨道数据;(j)地面站观测数据;(k)TROPOMI估算结果;(l)OMI估算结果
Fig. 6. Comparison and analysis of spatial resolution of TROPOMI and OMI data. (a) Satellite image of Southeast China from Google Earth; (b) L2 orbit data of TROPOMI; (c) L2 orbit data of OMI; (d) ground-based data; (e) estimation of TROPOMI; (f) estimation of OMI; (g) satellite image of central China from Google Earth; (h) L2 orbit data of TROPOMI; (i) L2 orbit data of OMI; (j) ground-based data; (k) estimation of TROPOMI; (l) estimation of OMI
同时,空间分辨率过低也会导致估算结果高估,
结合
3.3 低估情况优化
由上文可知,在进行近地面估算时TROPOMI和OMI数据集的估算结果都存在低估的情况,为了缓解这种现象,本文采取构建集成模型的方式来改善低估情况。
首先划分出高值样本,按照国家大气监测标准[56],NO2的年平均浓度限值不得高于40 μg/m3,因此将大于等于40的地面观测值划定为高值,即正样本1,小于40的为负样本0。然后采用正负样本训练分类模型。分类时存在正负样本差距过大的问题,正负样本数量相差过大会影响模型的精度,因此采取了增大正样本权重的方法进行调整,把正样本权重设置为17(默认为1),使之在模型中的占比与负样本相当。分类模型采用的评价标准是精确率和召回率。
表 2. 2019年TROPOMI数据集分类情况
Table 2. Results of classification from TROPOMI dataset in 2019
|
在分类模型的基础上,用于估算高值样本的高值模型采用大于40的地面站观测值数据作为训练集的响应变量训练得到,在进行估算时先采用分类模型分类出高值样本,再采用高值模型对这部分样本进行估算,得到优化后的估算结果。

图 7. 2018—2021年数据原模型和优化模型散点图的比较。(a)优化后模型估算结果;(b)原模型估算结果
Fig. 7. Comparison of scatter plots between previous and optimized models from 2018 to 2021. (a) Estimation of optimized model; (b) estimation of previous model

图 8. 高值模型优化结果对比。2019年6月5日:(a)长江三角洲附近区域原模型估算结果;(b)高值模型优化结果;(c)地面观测结果;2019年8月8日:(d)珠江三角洲附近区域原模型估算结果;(e)高值模型优化结果;(f)地面观测结果
Fig. 8. Comparison of optimization results of high-value models. June 5, 2019: (a) estimation of previous model around Yangtze River Delta; (b) estimation of optimized models; (c) ground-based data; August 8, 2019: (d) estimation results of original model in area around Pearl River Delta; (e) estimation of optimized models; (f) ground-based data
4 结论
本文利用地面站观测值和OMI/TROPOMI卫星观测值等数据,采用机器学习算法建立模型,在对模型特征进行筛选和重要性分析的基础上,对我国近地面NO2浓度进行估算。针对目前近地面NO2估算研究中相对不足的方面,系统性对比分析了空间分辨率和覆盖度更高的TROPOMI数据较OMI数据在近地面NO2估算中的优势,并在此基础上对估算模型进行优化,缓解了模型在估算高值时低估的现象,提高了估算结果的精度。
主要结论包括:1)预测模型变量中的经纬度信息存在严重的多重共线性,会对模型估算质量造成影响;2)TROPOMI的数据覆盖度高于OMI,估算结果优于OMI,十折交叉验证(R2:0.79 VS 0.75,斜率0.79 VS 0.74);3)具有高空间分辨率的TROPOMI数据可以识别出OMI无法识别的近地面NO2高值区或者低值区;4)通过建立集成模型,将高值样本筛选出来单独处理,可显著提升预测精度,将R2从原来的0.79提升至0.85,拟合线斜率从0.79提升至0.89。
[1] Miyazaki K, Eskes H J, Sudo K. Global NOx emission estimates derived from an assimilation of OMI tropospheric NO2 columns[J]. Atmospheric Chemistry and Physics, 2012, 12(5): 2263-2288.
[2] Ryerson T B. Effect of petrochemical industrial emissions of reactive alkenes and NOx on tropospheric ozone formation in Houston, Texas[J]. Journal of Geophysical Research, 2003, 108(D8): 4249.
[3] Shi Y, Xia Y F, Lu B H, et al. Emission inventory and trends of NOx for China, 2000-2020[J]. Journal of Zhejiang University SCIENCE A, 2014, 15(6): 454-464.
[4] Hoseinzadeh E, Taha P, Wei C A, et al. The impact of air pollutants, UV exposure and geographic location on vitamin D deficiency[J]. Food and Chemical Toxicology, 2018, 113: 241-254.
[5] Shin H H, Stieb D, Burnett R, et al. Tracking national and regional spatial-temporal mortality risk associated with NO2 concentrations in Canada: a Bayesian hierarchical two-level model[J]. Risk Analysis, 2012, 32(3): 513-530.
[6] Smith B J, Nitschke M, Pilotto L S, et al. Health effects of daily indoor nitrogen dioxide exposure in people with asthma[J]. The European Respiratory Journal, 2000, 16(5): 879-885.
[7] Thompson A M. The oxidizing capacity of the earth′s atmosphere: probable past and future changes[J]. Science, 1992, 256(5060): 1157-1165.
[8] 石琴, 郑山, 朱文芝, 等. NO2对高血压患者血压和脉压的短期影响[J]. 中国环境科学, 2020, 40(8): 3627-3635.
Shi Q, Zheng S, Zhu W Z, et al. The short-term effects of NO2 on blood pressure and pulse pressure in patients with hypertension[J]. China Environmental Science, 2020, 40(8): 3627-3635.
[9] Richter A, Burrows J P, Nüß H, et al. Increase in tropospheric nitrogen dioxide over China observed from space[J]. Nature, 2005, 437(7055): 129-132.
[10] van der A R J, Eskes H J, Boersma K F, et al. Trends, seasonal variability and dominant NOx source derived from a ten year record of NO2 measured from space[J]. Journal of Geophysical Research, 2008, 113(D4): D04302.
[11] 董佳丹, 陈晓玲, 蔡晓斌, 等. 基于中国大气环境监测站点的2015—2019年大气质量状况时空变化分析[J]. 地球信息科学学报, 2020, 22(10): 1983-1995.
Dong J D, Chen X L, Cai X B, et al. Analysis of the temporal and spatial variation of atmospheric quality from 2015 to 2019 based on China atmospheric environment monitoring station[J]. Journal of Geo-Information Science, 2020, 22(10): 1983-1995.
[12] 周妹, 常建华, 陈思成, 等. 一种基于朴素贝叶斯分类器的气溶胶类型识别模型[J]. 光学学报, 2022, 42(18): 1801006.
[13] 吴时超, 王先华, 叶函函, 等. 应用于GF-5卫星的大气CO2协同反演算法[J]. 光学学报, 2021, 41(15): 1501002.
[14] Zhan Y, Luo Y Z, Deng X F, et al. Satellite-based estimates of daily NO2 exposure in China using hybrid random forest and spatiotemporal kriging model[J]. Environmental Science & Technology, 2018, 52(7): 4180-4189.
[15] 游介文, 邹滨, 赵秀阁, 等. 基于随机森林模型的中国近地面NO2浓度估算[J]. 中国环境科学, 2019, 39(3): 969-979.
You J W, Zou B, Zhao X G, et al. Estimating ground-level NO2 concentrations across China using random forests regression modeling[J]. China Environmental Science, 2019, 39(3): 969-979.
[16] Li L F, Wu J J. Spatiotemporal estimation of satellite-borne and ground-level NO2 using full residual deep networks[J]. Remote Sensing of Environment, 2021, 254: 112257.
[17] He Q, Qin K, Cohen J B, et al. Spatially and temporally coherent reconstruction of tropospheric NO2 over China combining OMI and GOME-2B measurements[J]. Environmental Research Letters, 2020, 15(12): 125011.
[18] Wang C J, Wang T, Wang P C, et al. Comparison and validation of TROPOMI and OMI NO2 observations over China[J]. Atmosphere, 2020, 11(6): 636.
[19] 汤付颖, 周海金, 王维和, 等. TROPOMI吸收性气溶胶指数反演算法及其应用[J]. 光学学报, 2021, 41(16): 1601001.
[20] Cooper M J, Martin R V, McLinden C A, et al. Inferring ground-level nitrogen dioxide concentrations at fine spatial resolution applied to the TROPOMI satellite instrument[J]. Environmental Research Letters, 2020, 15(10): 104013.
[21] Chi Y L, Fan M, Zhao C F, et al. Machine learning-based estimation of ground-level NO2 concentrations over China[J]. Science of the Total Environment, 2022, 807: 150721.
[22] Wei J, Liu S, Li Z Q, et al. Ground-level NO2 surveillance from space across China for high resolution using interpretable spatiotemporally weighted artificial intelligence[J]. Environmental Science & Technology, 2022, 56(14): 9988-9998.
[23] Müller I, Erbertseder T, Taubenböck H. Tropospheric NO2: Explorative analyses of spatial variability and impact factors[J]. Remote Sensing of Environment, 2022, 270: 112839.
[24] Sekiya T, Miyazaki K, Eskes H, et al. A comparison of the impact of TROPOMI and OMI tropospheric NO2 on global chemical data assimilation[J]. Atmospheric Measurement Techniques, 2022, 15(6): 1703-1728.
[25] Shtein A, Kloog I, Schwartz J, et al. Estimating daily PM2.5 and PM10 over Italy using an ensemble model[J]. Environmental Science & Technology, 2019, 54(1): 120-128.
[26] Li L F. Geographically weighted machine learning and downscaling for high-resolution spatiotemporal estimations of wind speed[J]. Remote Sensing, 2019, 11(11): 1378.
[27] 孟昭亮, 张泽涛, 杨媛, 等. 改进的XGBoost杂散电流预测及可解释模型[J]. 激光与光电子学进展, 2022, 59(12): 1215011.
[28] Song Y, Li Z R, Yang T T, et al. Does the expansion of the joint prevention and control area improve the air quality? —evidence from China′s Jing-Jin-Ji region and surrounding areas[J]. Science of the Total Environment, 2020, 706: 136034.
[29] Wen X, Chen W W, Chen B, et al. Does the prohibition on open burning of straw mitigate air pollution? An empirical study in Jilin Province of China in the post-harvest season[J]. Journal of Environmental Management, 2020, 264: 110451.
[30] Zhang F Y, Shi Y, Fang D K, et al. Monitoring history and change trends of ambient air quality in China during the past four decades[J]. Journal of Environmental Management, 2020, 260: 110031.
[31] 郑子豪, 吴志峰, 陈颖彪, 等. 基于Sentinel-5P的粤港澳大湾区NO2污染物时空变化分析[J]. 中国环境科学, 2021, 41(1): 63-72.
Zheng Z H, Wu Z F, Chen Y B, et al. Analysis of temporal and spatial variation characteristics of NO2 pollutants in Guangdong-Hong Kong-Macao Greater Bay Area based on Sentinel-5P satellite data[J]. China Environmental Science, 2021, 41(1): 63-72.
[32] Boersma K F, Eskes H J, Richter A, et al. Improving algorithms and uncertainty estimates for satellite NO2 retrievals: results from the quality assurance for the essential climate variables (QA4ECV) project[J]. Atmospheric Measurement Techniques, 2018, 11(12): 6651-6678.
[33] Compernolle S, Verhoelst T, Pinardi G, et al. Validation of aura-OMI QA4ECV NO2; climate data records with ground-based DOAS networks: the role of measurement and comparison uncertainties[J]. Atmospheric Chemistry and Physics, 2020, 20(13): 8017-8045.
[34] van Geffen J, Boersma K F, Eskes H, et al. S5P TROPOMI NO2 slant column retrieval: method, stability, uncertainties and comparisons with OMI[J]. Atmospheric Measurement Techniques, 2020, 13(3): 1315-1335.
[35] Freddy Grajales J, Baquero-Bernal A. Inference of surface concentrations of nitrogen dioxide (NO2) in Colombia from tropospheric columns of the ozone measurement instrument (OMI)[J]. Atmósfera, 2014, 27(2): 193-214.
[36] Gu J B, Chen L F, Yu C, et al. Ground-level NO2 concentrations over China inferred from the satellite OMI and CMAQ model simulations[J]. Remote Sensing, 2017, 9(6): 519.
[37] Lamsal L N, Martin R V, van Donkelaar A, et al. Ground-level nitrogen dioxide concentrations inferred from the satellite-borne Ozone Monitoring Instrument[J]. Journal of Geophysical Research, 2008, 113(D16): D16308.
[38] Larkin A, Geddes J A, Martin R V, et al. Global land use regression model for nitrogen dioxide air pollution[J]. Environmental Science & Technology, 2017, 51(12): 6957-6964.
[39] Young M T, Bechle M J, Sampson P D, et al. Satellite-based NO2 and model validation in a national prediction model based on universal kriging and land-use regression[J]. Environmental Science & Technology, 2016, 50(7): 3686-3694.
[40] 赵佳楠, 徐建华, 卢德彬, 等. 基于RF-LUR模型的PM2.5空间分布模拟: 以长江三角洲地区为例[J]. 地理与地理信息科学, 2018, 34(1): 18-23.
Zhao J N, Xu J H, Lu D B, et al. The spatial distribution simulation of PM2.5 concentration based on RF-LUR model: a case study of Yangtze River Delta[J]. Geography and Geo-Information Science, 2018, 34(1): 18-23.
[41] Araki S, Shima M, Yamamoto K. Spatiotemporal land use random forest model for estimating metropolitan NO2 exposure in Japan[J]. Science of the Total Environment, 2018, 634: 1269-1277.
[42] Kamińska J A. A random forest partition model for predicting NO2 concentrations from traffic flow and meteorological conditions[J]. Science of the Total Environment, 2019, 651: 475-483.
[43] Breiman L. Random forests[J]. Machine Language, 2001, 45(1): 5-32.
[44] Friedman J H. Greedy function approximation: a gradient boosting machine[J]. The Annals of Statistics, 2001, 29(5): 1189-1232.
[45] 李一蜚, 秦凯, 李丁, 等. 基于梯度提升回归树算法的地面臭氧浓度估算[J]. 中国环境科学, 2020, 40(3): 997-1007.
Li Y F, Qin K, Li D, et al. Estimation of ground-level ozone concentration based on GBRT[J]. China Environmental Science, 2020, 40(3): 997-1007.
[47] Zamani Joharestani M, Cao C X, Ni X L, et al. PM2.5 prediction based on random forest, XGBoost, and deep learning using multisource remote sensing data[J]. Atmosphere, 2019, 10(7): 373.
[48] Just A C, de Carli M M, Shtein A, et al. Correcting measurement error in satellite aerosol optical depth with machine learning for modeling PM2.5 in the Northeastern USA[J]. Remote Sensing, 2018, 10(5): 803.
[49] Zamani J M, Cao C X, Ni X L, et al. PM2.5 prediction based on random forest, XGBoost, and deep learning using multisource remote sensing data[J]. Atmosphere, 2019, 10(7): 373.
[50] Liu J J. Mapping high resolution national daily NO2 exposure across the mainland of China using an ensemble algorithm[J]. Environmental Pollution, 2021, 279: 116932.
[51] Ballester P L, de A Cardoso T, Moreira F P, et al. 5-year incidence of suicide-risk in youth: a gradient tree boosting and SHAP study[J]. Journal of Affective Disorders, 2021, 295: 1049-1056.
[52] Jabeur S B, Mefteh-Wali S, Viviani J L. Forecasting gold price with the XGBoost algorithm and SHAP interaction values[J]. Annals of Operations Research, 2021: 1-21.
[53] Broccardo S, Heue K P, Walter D, et al. Intra-pixel variability in satellite tropospheric NO2 column densities derived from simultaneous space-borne and airborne observations over the South African Highveld[J]. Atmospheric Measurement Techniques, 2018, 11(5): 2797-2819.
[54] Judd L M, Al-Saadi J A, Janz S J, et al. Evaluating the impact of spatial resolution on tropospheric NO2 column comparisons within urban areas using high-resolution airborne data[J]. Atmospheric Measurement Techniques, 2019, 12(11): 6091-6111.
[55] Lamsal L N, Janz S J, Krotkov N A, et al. High-resolution NO2 observations from the Airborne Compact Atmospheric Mapper: retrieval and validation[J]. Journal of Geophysical Research: Atmospheres, 2017, 122(3): 1953-1970.
[56] General Administration of Quality Supervision, Inspection and Quarantine of the People's Republic of China, Standardization Administration of the People's Republic of China. Ambient air quality standard: GB 3095—2012[S]. Beijing: China Environmental Science Press, 2016.
国家质量监督检验检疫总局, 中国国家标准化管理委员会. 环境空气质量标准: GB 3095—2012[S]. 北京: 中国环境科学出版社, 2016.
Article Outline
周文远, 秦凯, 何秦, 王璐瑶, 罗锦洪, 谢卧龙. 基于对流层检测仪和臭氧检测仪的我国近地面NO2浓度的估算对比与优化[J]. 光学学报, 2024, 44(6): 0601010. Wenyuan Zhou, Kai Qin, Qin He, Luyao Wang, Jinhong Luo, Wolong Xie. Comparison and Optimization of Ground-Level NO2 Concentration Estimation in China Based on TROPOMI and OMI[J]. Acta Optica Sinica, 2024, 44(6): 0601010.


