Photonics Research, 2020, 8 (7): 07001079, Published Online: Jun. 3, 2020  

Great enhancement of image details with high fidelity in a scintillator imager using an optical coding method Download: 634次

Huijuan Xia 1,2†Yanqing Wu 1,3,4,*†Lei Zhang 1,2†Yuanhe Sun 1,2†Zhongyang Wang 3†Renzhong Tai 1,3,5,*†
Author Affiliations
1 Shanghai Institute of Applied Physics, Chinese Academy of Sciences, Shanghai 201800, China
2 University of Chinese Academy of Sciences, Beijing 100049, China
3 Shanghai Advanced Research Institute, Chinese Academy of Sciences, Shanghai 201204, China
4 e-mail: wuyanqing@zjlab.org.cn
5 e-mail: tairenzhong@zjlab.org.cn
Abstract
High-resolution lens-coupled indirect X-ray scintillator imagers are required by many imaging applications. However, the severe weakening of image details prevents its further performance improvement. Through our research, this image degradation is attributed to the broadband loss of the high-spatial-frequency information caused by the high refractive index. A technique known as high-spatial-frequency spectrum enhanced reconstruction is thus proposed to retrieve this information. A two-dimensional high-density array is covered on the scintillator’s exit surface and operates as an encoder based on which high-frequency information can be shifted to the low-frequency region to improve the signal-to-noise ratio. The experimental results show that the middle-high-frequency signal intensities can be increased by an order of magnitude or more, up to 50 times. Therefore, the image details can be effectively enhanced to break through the performance bottleneck of such widely used X-ray imagers for synchrotron radiation facilities or tabletop X-ray tubes.

1. INTRODUCTION

In indirect X-ray imaging technology, scintillators are employed to convert X rays to visible light and are extensively used in medicine, materials, life sciences, nondestructive testing, and for industrial inspections. The scintillator imagers coupled with microscope lenses [1,2] possess high-resolution and strong radiation-resistance characteristics. They are extensively used in various high-performance imaging experiments based on high-brightness synchrotron radiation sources, especially in biomedical research. A micrometer-level resolution can be achieved by this system. However, the images are often not as clear as expected in the lens-coupled scintillator imagers. The image details are often mixed with high-frequency noise. Increasing the X-ray luminous flux is costly and hardly helps to solve the problem. At present, the research and development efforts on new scintillators are still focused on the improvement of the fluorescence conversion efficiency. It has also been noticed that the scintillator has a high refractive index in the range of 1.8 to 2.5 [3] for its visible fluorescence, which thus causes nearly 92% of the stimulated visible photons to be lost on the exit surface. A seemingly possible solution to this problem may involve the extraction of the maximum number of photons [4,5]. However, even this approach does not help improve the quality of the image [6].

We found that a high refractive index of the scintillator significantly degrades the pupil function and thus weakens the extensive broadband high-frequency information, which has a major impact on the image quality. Therefore, we intend to use optical image coding methods to enhance this information that is critical to the image characteristics.

The optical encoding method has been applied to convert evanescent waves that carry high-frequency information into transmission waves in far-field, super-resolution imaging systems with coherent illuminations. For example, Gustafsson [7] developed structured light illumination microscopy to shift the spatial frequencies of the image. A multiple-illumination field structure was then constructed to provide sufficient phase information for image decoding. However, it is difficult to apply this technique in our incoherent imaging system in which (i) the source’s phase information is lost, which is necessary for decoding, and (ii) a nanostructure with a very high aspect ratio is required to block hard X rays. This nanostructure is difficult to fabricate. Zhang et al. [8] introduced a far-field optical superlens to considerably enhance the evanescent waves from an object and convert them into propagating waves in the far field. The surface plasmon polariton (SPP) employed in this scheme [9] mainly responded to infrared and visible lights in the red part of the spectrum, while the cerium-doped yttrium aluminum garnet (YAG:Ce) used in our system emitted light with wavelengths in the range of 500–600 nm. More importantly, compared with the above super-resolution techniques, our research was focused on the quantity of high-frequency and medium-high-frequency signals to improve the imaging quality in high-fidelity applications instead of extending the upper frequency limit.

Unlike the above applications on super-resoution, a new optical image encoding–decoding technique is now proposed to enhance the middle-high-frequency and high-frequency broadband information, to break through the bottleneck of the high-resolution lens-coupled X-ray scintillator imager. In this technique, a two-dimensional (2D) high-density array is used as an encoder to extract broadband high-frequency information instead of photons. The high-density SiNx array with periods of 300 nm was designed and covered on a (YAG:Ce) scintillator film by electron beam lithography (EBL). The image obtained by a scientific complementary metal-oxide semiconductor (sCMOS) camera was finally decoded with an iterative algorithm. We refer to this technique as the high-spatial-frequency spectrum enhanced reconstruction (HSFER) method. It will be shown that upon use of this technique, the signal-to-noise ratio (SNR) in the middle-high-frequency region of an incoherent image can be increased by 1 order or more. Fidelity was maintained during the imaging process. Another possible application might be expected to lie in low-dose medical diagnostics [10,11]. With a synchrotron-radiation X-ray source [12,13], the fast imaging capability of this technique can also provide a good opportunity to study the dynamics of various samples [14,15].

2. THEORY

2.1 A. Principle

A new encoding–decoding imaging method, commonly referred to as HSFER, is proposed herein (Fig. 1). The method includes two steps: (i) extraction of the middle-high-frequency and high-frequency incoherent image information by a 2D encoder and (ii) decoding of the image recorded by an sCMOS camera with an iteration method. In practice, a subwavelength periodic 2D array of SiNx was selected as the encoding element to allow use of only the 1st-order diffraction of the working spectrum. High-frequency information was selectively translated to low-frequency components. Most of the useful information was converted into transmitted waves and passed to the succeeding optical system. To achieve high image fidelity, the nonmetallic structure was selected as the 2D encoder to avoid the image distortion caused by the SPPs on the metal surfaces.

Fig. 1. Schematic of an X-ray scintillator imager based on the use of the proposed high-spatial-frequency spectrum enhanced reconstruction (HSFER) method. A two-dimensional (2D) encoder is used to extract the middle-high-frequency and high-frequency components of the image generated in the scintillator. The image is decoded by a PSF/OTF of the encoder.

下载图片 查看所有图片

The high-frequency information in an image determines the image characteristics. In the case of the YAG:Ce scintillator imager, the refractive index is as high as 1.8 at a wavelength of 550 nm. The reflectivity increases abruptly as a function of the angle. The diffraction limitation has profound effects. Therefore, severe loss of high-frequency information occurs, and the image quality is degraded. Most of the useful information carried by the waves with large emission angles, especially the waves that are totally reflected, is absent in a far-field imaging system [16].

The starting point of our encoding–decoding imaging theory is the simple coherent imaging case. We assume the existence of an object field produced by illumination in the presence of coherent waves. In a practical imaging system, the system’s point spread function (PSF) accounts for the image degradation factors. Therefore, the object function ws can be recovered as follows: where w0 denotes a degraded image, represents the convolution operation, and h is the system’s PSF. The corresponding incoherent imaging process can be described as To improve imaging quality, an optical encoding function can be integrated into the system described by Eq. (1). We define g as the transmittance of an encoding element that covers the exit surface of the scintillator film. Accordingly, ws is modified to ws·g, and the image obtained is expressed as The object field is composed of many luminescent centers. Each object point and its corresponding virtual object point constitute a group of related object points. These object point groups are irrelevant to each other. Therefore, the image from the incoherent process is Assume that where kgx=kgy=2π/p,p is the grating period, η0 represents the chosen 1st-order diffraction efficiency, and η01. The reasons for choosing only the 1st-order in Eq. (5) will be explained in next subsection. Thus, The corresponding incoherent imaging process can be described by where η=η0ei(Øx+Øx). In the Fourier domain, this equation can be written as where k is the spatial frequency vector of the image, WI˜(k), Ws˜(k), and H˜(k,λ) are the Fourier transforms of wI, |ws|2, and |h|2, respectively, and kg=(kgx,kgy). The 1st-order diffraction efficiency η=η(k,λ), increases with k, whereby λ is the fluorescence wavelength. W˜I(k) is similar to an exponential function and decreases rapidly as a function of k. The upshifted frequency part W˜s(k+kg) cannot be captured or resolved by the camera and becomes a small and negligible quantity.

Assuming that the camera noise is negligible and only image noise |ns|2 is considered, |ws|2 could be replaced by |ws|2+|ns|2. The corresponding Fourier transformed quantities W˜s(kkg) and N˜s(kkg) can be obtained with the use of Eq. (8). W˜s(kkg) is much higher than W˜s(k), while N˜s(k) does not change much in the entire frequency range. Therefore, the SNR of the frequency-downshifted signal is quite high. In the subsequent deconvolution iterative calculations, these high-SNR signals will be gradually shifted back to the high-frequency region.

Many scintillators have a broad fluorescence spectrum. Correspondingly, the case of multiple wavelengths is considered in this case. The aforementioned object field W˜s and image field W˜I are independent of the fluorescence wavelength, and the optical imaging results with different wavelengths can be accumulated directly. Owing to the different diffraction angles, the pupil functions that correspond to different wavelengths are also different from each other, i.e., H˜=H˜(k,λ). The information delivered by different wavelengths of light can complement each other, and it can thereby expand the spatial frequency spectrum of the image. The imaging process with a light source having a continuous spectrum is described by where Δλ is the bandwidth of the wavelength spectrum. If we define H˜(k)¯=(1/Δλ)·H(k,λ)dλ and η(k,λ)·H˜(k)¯=(1/Δλ)·η(k,λ)H(k,λ)dλ, Eq. (9) can be simplified to The YAG:Ce emits fluorescence with a very wide spectrum for wavelengths in the range of 400 to 700 nm, which can maintain the continuity of the image spatial frequency spectrum and is significant for image fidelity. It suggests that the signal SNR in a broad spatial frequency range could benefit from this technique.

For the image decoding process, it is easy to know that the overall difference between the image with and without HSFER is not large. The second term on the right side of Eq. (10) can be regarded as a correction term. And it can be seen that the correction term is related to the encoder ability to convert frequencies, rather than the specific image. Therefore, it can be expected to use a PSF or optical transmission function (OTF) to approximate the role of the encoder without significant errors, if the minor contribution from the specific image in Eq. (11) could be effectively eliminated. Decoding an image by PSF or OTF, one can realize one-step exposure, which is necessary for dynamic imaging and computerized tomography. Certainly, this method requires experimental verifications.

A 20 μm pinhole was employed to obtain this “encoder OTF” H˜(k). The imaging experiment was carried out on the beam line BL09B of the Shanghai Synchrotron Radiation Facility (SSRF). The results were summed up to achieve a high SNR. Then H˜(k) was calculated by an iteration version of Eq. (10). At each iteration step, there is some empirical criteria to eliminate the contribution from the specific image. Thus, the evolution direction can be well controlled. The Fourier transform of H˜(k), the PSF of the encoder was obtained, shown in Fig. 1 in logarithm scale. The effectiveness of this method has been verified in the imaging experiments shown below. The effect of residual error will be carefully analyzed in further study.

2.2 B. Key Parameters of the 2D Encoder

We still begin this subsection from the simple coherent imaging case. The 2D encoder lattice structure will affect the diffraction in the same lattice orientation. For simplicity, a one-dimensional imager is analyzed here. The spatial frequency spectrum of an image can be filtered by the system’s pupil function. There are several factors that may affect this pupil function, including (i) numerical aperture (N.A.,=sinγ), which is set to 0.4 in our optical system, i.e., acceptance angle γ is 12.8° in the scintillator, (ii) total reflection angle of the scintillator, which is equal to 33.7° in the case of the YAG:Ce scintillator, and (iii) the nanostructure of the 2D encoder on the exit surface of the scintillator. The upper limit of the spatial frequency is still determined by the N.A. of the system. However, due to the high refractive index of the scintillator, the reflectivity is increased rapidly as the incident angle increased. And the middle-high-frequency and high-frequency information decays quickly.

The forward diffracted waves from the object are first incident on the exit surface of the scintillator and are then diffracted again by this 2D encoder. This process can be described by the grating equation as follows: where G0=2π/p is the reciprocal lattice vector of the photonic crystal, p is the grating period, m is the diffraction order, λ is the fluorescence wavelength in vacuum, nsc is the refractive index of the scintillator, and θm is the incident angle on the 2D encoder surface.

Even though the period of the structure is smaller than the wavelength, the grating equation [Eq. (12)] is employed to provide physical images and preliminary estimates for the encoder parameters [6]. Further consideration of the acceptance angle γ of the optical system modifies Eq. (12) to Accurate parameter calculation outcomes are obtained based on the vector diffraction theory as shown in Fig. 2. In practice, the cutoff frequency fc is determined by the equivalent camera pixel size, which is estimated to be (1.3  μm)1 in our experimental setup.

Fig. 2. (a) Areas below the dashed, dotted, and solid curves represent the parameter zones that allow the +1st-order diffraction to occur for the two-dimensional (2D) encoder periods of 600, 450, and 300 nm, respectively. This shows that the encoder with a 300 nm period can yield a maximum suppression of the +1-order diffraction compared with the other two encoders. In fact, no +1st-order diffraction occurs with a 300 nm period in FDTD simulations. (b) The green area shows the parameter zone that allows the 1st-order diffracted waves to be accepted by the optical system, whereby the encoder with the 300 nm period is selected. The angle 33.0° represents the total reflection angle. The FDTD simulation results of the transverse electric (TE) and transverse magnetic (TM) modes are also shown here. (c) MTFs are used for the evaluation of the performance of this system. The thick curve represents the MTF of the case with the 2D encoder, while the thin one represents the case without the 2D encoder. Obviously, the spectrum is extended considerably by the encoder. The fc value is the cutoff frequency determined by the equivalent camera pixel size, which is equal to (1.3  μm)1 in our experiment. The green area indicates the extra high-frequency information received from the encoder.

下载图片 查看所有图片

The 1st-order diffracted wave from a grating with a subwavelength period can preferentially carry high-frequency image information because the incident waves of the large angles carrying high-frequency information are more likely to satisfy the diffraction conditions and thus can be transformed into transmission waves. Meanwhile, the positive-order diffractions might be suppressed by this grating. Figures 2(a) and 2(b) were estimated based on Eq. (13) and finite-difference time-domain (FDTD) simulations. Figure 2(a) clearly shows that the +1st-order and the higher-order diffraction (not shown) information is decreased substantially in the YAG:Ce emission spectrum (500–700 nm) in the case at which the grating period is reduced to 300 nm. Therefore, the period was finally selected to be 300 nm. As a result, only negative-order diffractions can occur in the 1st-order. The waves can be transferred to the 1st-order diffraction waves for a broad range of incident angles (not shown in the figure). Figure 2(b) shows the parameter zone for the 1st-order diffracted waves accepted by the aperture with N.A. = 0.4, as the green area shows. The results are obtained from the grating equation and modified by the FDTD calculations. It should be emphasized that a considerable number of photons that were originally totally reflected are now effectively accepted by the 2D encoder system. It should also be noted that it is necessary to maintain the continuity of the modulation transfer function (MTF) that is dependent on the encoder period. Otherwise, unrepairable distortions would occur in the final image.

The above analysis is based on the coherent imaging case in which one can calculate the simplified coherent transfer function (CTF) of the system based on the well-known coherent imaging theory [17]. However, in our system, the lights were emitted by incoherent luminescence centers within the scintillator. The OTF, which is the autocorrelation function of the aforementioned CTF, is calculated and shown in Fig. 2(c) to evaluate the spatial frequency domain characteristics of the accepted transmitted waves. The OTF spectral width is significantly enlarged owing to the 1st-order diffraction that carries most of the important high-frequency information. As Fig. 2(c) shows, the amount of medium- and high-frequency information below fc is improved. More importantly, the theoretical maximum for the spatial frequency is increased to (0.12  μm)1. This suggests that the new technology might have the potential to overcome the diffraction limit of the scintillator optical system and obtain super-resolution until 100  nm, not only increase the SNR of medium-high-frequency and high-frequency information. The continuity of the MTF(=|OTF|) in Fig. 1(c) indicates that the grating (encoder) design is reasonable and can be used to maintain the fidelity of the image.

3. EXPERIMENTAL SETUP

A 2D encoder with a 300 nm period and a duty cycle of 60% in a square lattice was fabricated by electron beam lithography (EBL) [18,19] and inductively coupled plasma (ICP) etching [20]. Figure 3 shows the experimental setup with the HSFER imager. The experimental data were obtained at the SSRF-BL09B and BL13W1 end stations with photon energy of 20 keV. The synchrotron radiation was collimated and transmitted through the samples to form the fluorescence pattern within the YAG:Ce scintillator with or without the 2D encoder that covered the YAG. Experiments were conducted in both cases for comparison purposes. A power spectral density (PSD) analysis was used to (i) evaluate the obtained images [21] and (ii) analyze the imaging mechanism. The normalized PSD with respect to the PSD of the encoder indicated the improvement of SNR for high-spatial-frequency components.
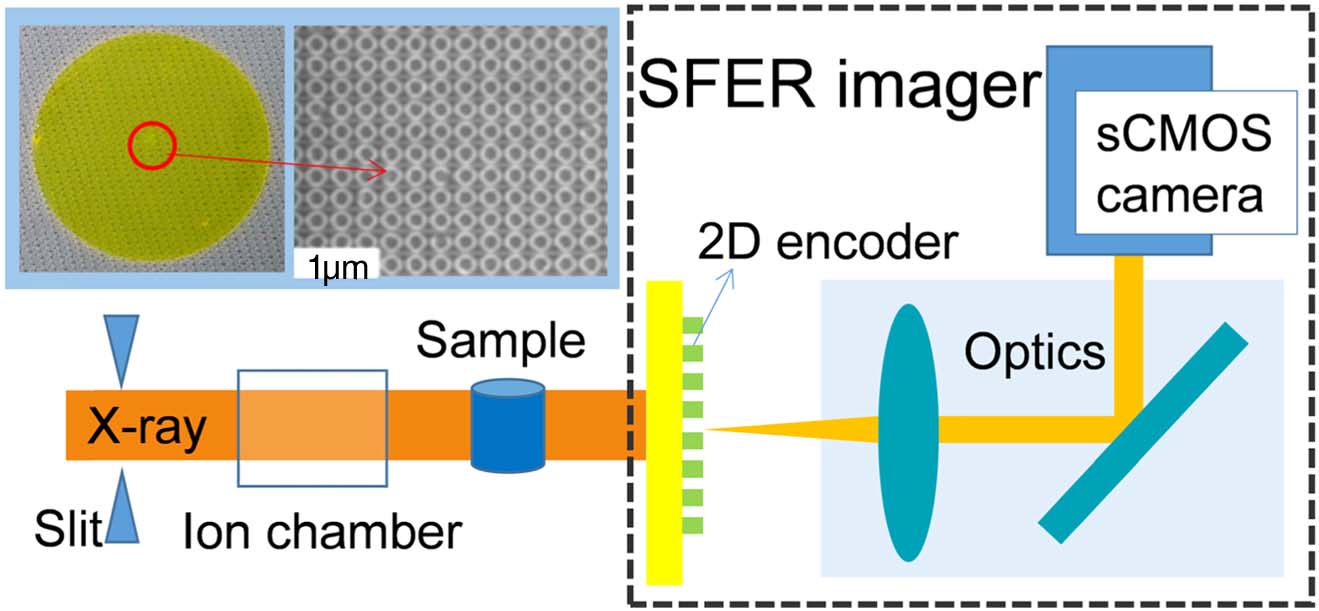
Fig. 3. Experimental setup with the HSFER imager. The fluorescent pattern produced by the X rays through the sample was first encoded by a 2D encoder, then imaged by the camera, and finally decoded by an iteration method. The inset upper-left subfigure shows the scanning electron micrograph of the 2D encoder: a YAG:Ce film covered with a 2D SiNx array.

下载图片 查看所有图片

The Richardson–Lucy deconvolution algorithm was employed in image decoding. The calculation parameters were carefully adjusted to avoid the overshoot phenomenon. Otherwise, false high-frequency information could be introduced.

4. EXPERIMENTAL RESULTS

Figure 4 shows resolution chart images reconstructed with a 3 s exposure. To investigate the improvement on the image SNR owing to the new method compared with the conventional imager, the contrast and brightness values of all the images were normalized for comparison purposes. It is evident that the HSFER image provides more details. The PSD shown in Fig. 4(e) is used to evaluate the images quantitatively and in more detail. The total photon flux with HSFER is approximately 1.4 times that without HSFER, while the SNR in the middle-high-frequency part is increased by 6.6 times (at most). Considering the presence of noise, the increase of the high-frequency SNR not only makes the image details clearer, but also reproduces the low-intensity high-frequency signals that were originally submerged in noise. As a result, in Fig. 4(f), the noise equivalent resolution was improved from 4.9 to 3.0 μm. In the spatial-frequency region in which fn>(15μm)1, the noise was suppressed to a certain degree in the deconvolution calculation. Specifically, the high-frequency noise was significantly suppressed (by 3.9 times at fc1). The denoising effect, shown by the dashed line in Fig. 4(f), is described by N=N0/(A·f) or log(N/N0)=(1/2)·log(A)log(f), where N0 is the original and N is the suppressed noise intensity, A is the area of the deconvolution function in the iteration calculation, and f is the spatial frequency. In conclusion, the medium-high-frequency signals can be well recognized and extracted, while the noise can be suppressed.
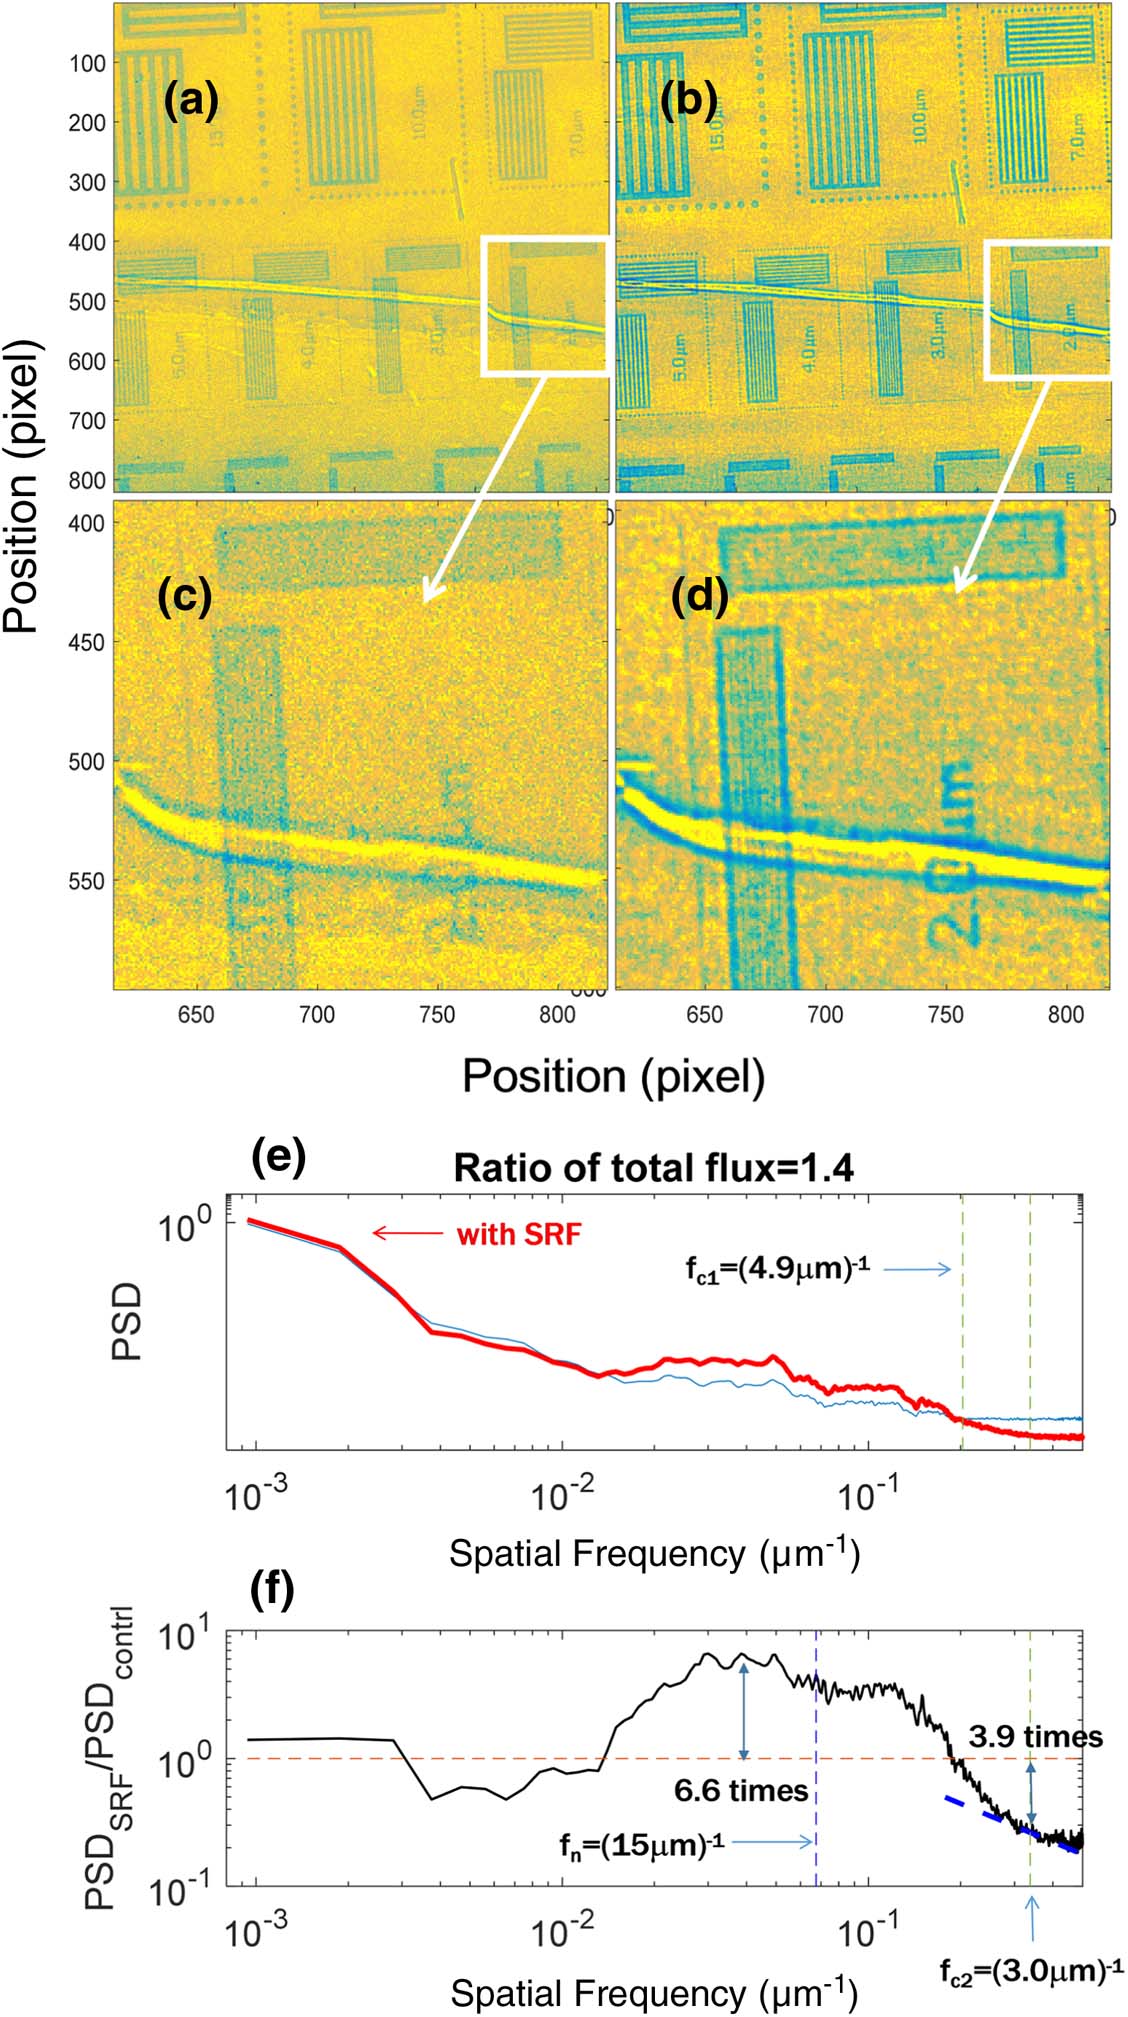
Fig. 4. Radiographs of the resolution chart obtained with a 3 s exposure (the dose is 4×10⁸  phs/mm2). (a), (b) Imaging results for a resolution chart without and with the HSFER method, respectively. (c), (d) Magnified views of the regions of interest in (a) and (b), respectively. (e) PSDs of the images in (a) and (b), whereby the red and the blue curves represent the cases with and without the HSFER, respectively, and fc2 is the cutoff frequency for the thin curve. (f) Normalized PSD with respect to the one without HSFER, thus showing that the cutoff frequency is extended to fc1. The fn is the spatial frequency at which the average effect of the deconvolution algorithm begins to work. The dashed line describes the denoising effect for frequencies much higher than fn.

下载图片 查看所有图片

To investigate the imaging at low-exposure doses with the HSFER method, the resolution chart was imaged with a 0.5 s exposure. Obviously, the HSFER results can visualize an extensive number of sample details that are almost indistinguishable in the non-HSFER images. The quality of the middle-high-frequency part is outstanding, and the SNR is improved by approximately 52 times, as shown in Fig. 5(f), although the total photon flux in the case at which HSFER was used is only 1.5 times compared with the case at which the HSFER was not used. This significant increase in SNR may be attributed to the noise level by a simple SNR analysis (not shown). The weak trivial periodic-like structures that appear in Figs. 5(b) and 5(d) probably arise from the periodic noise of the beam-line optics during the experiment.
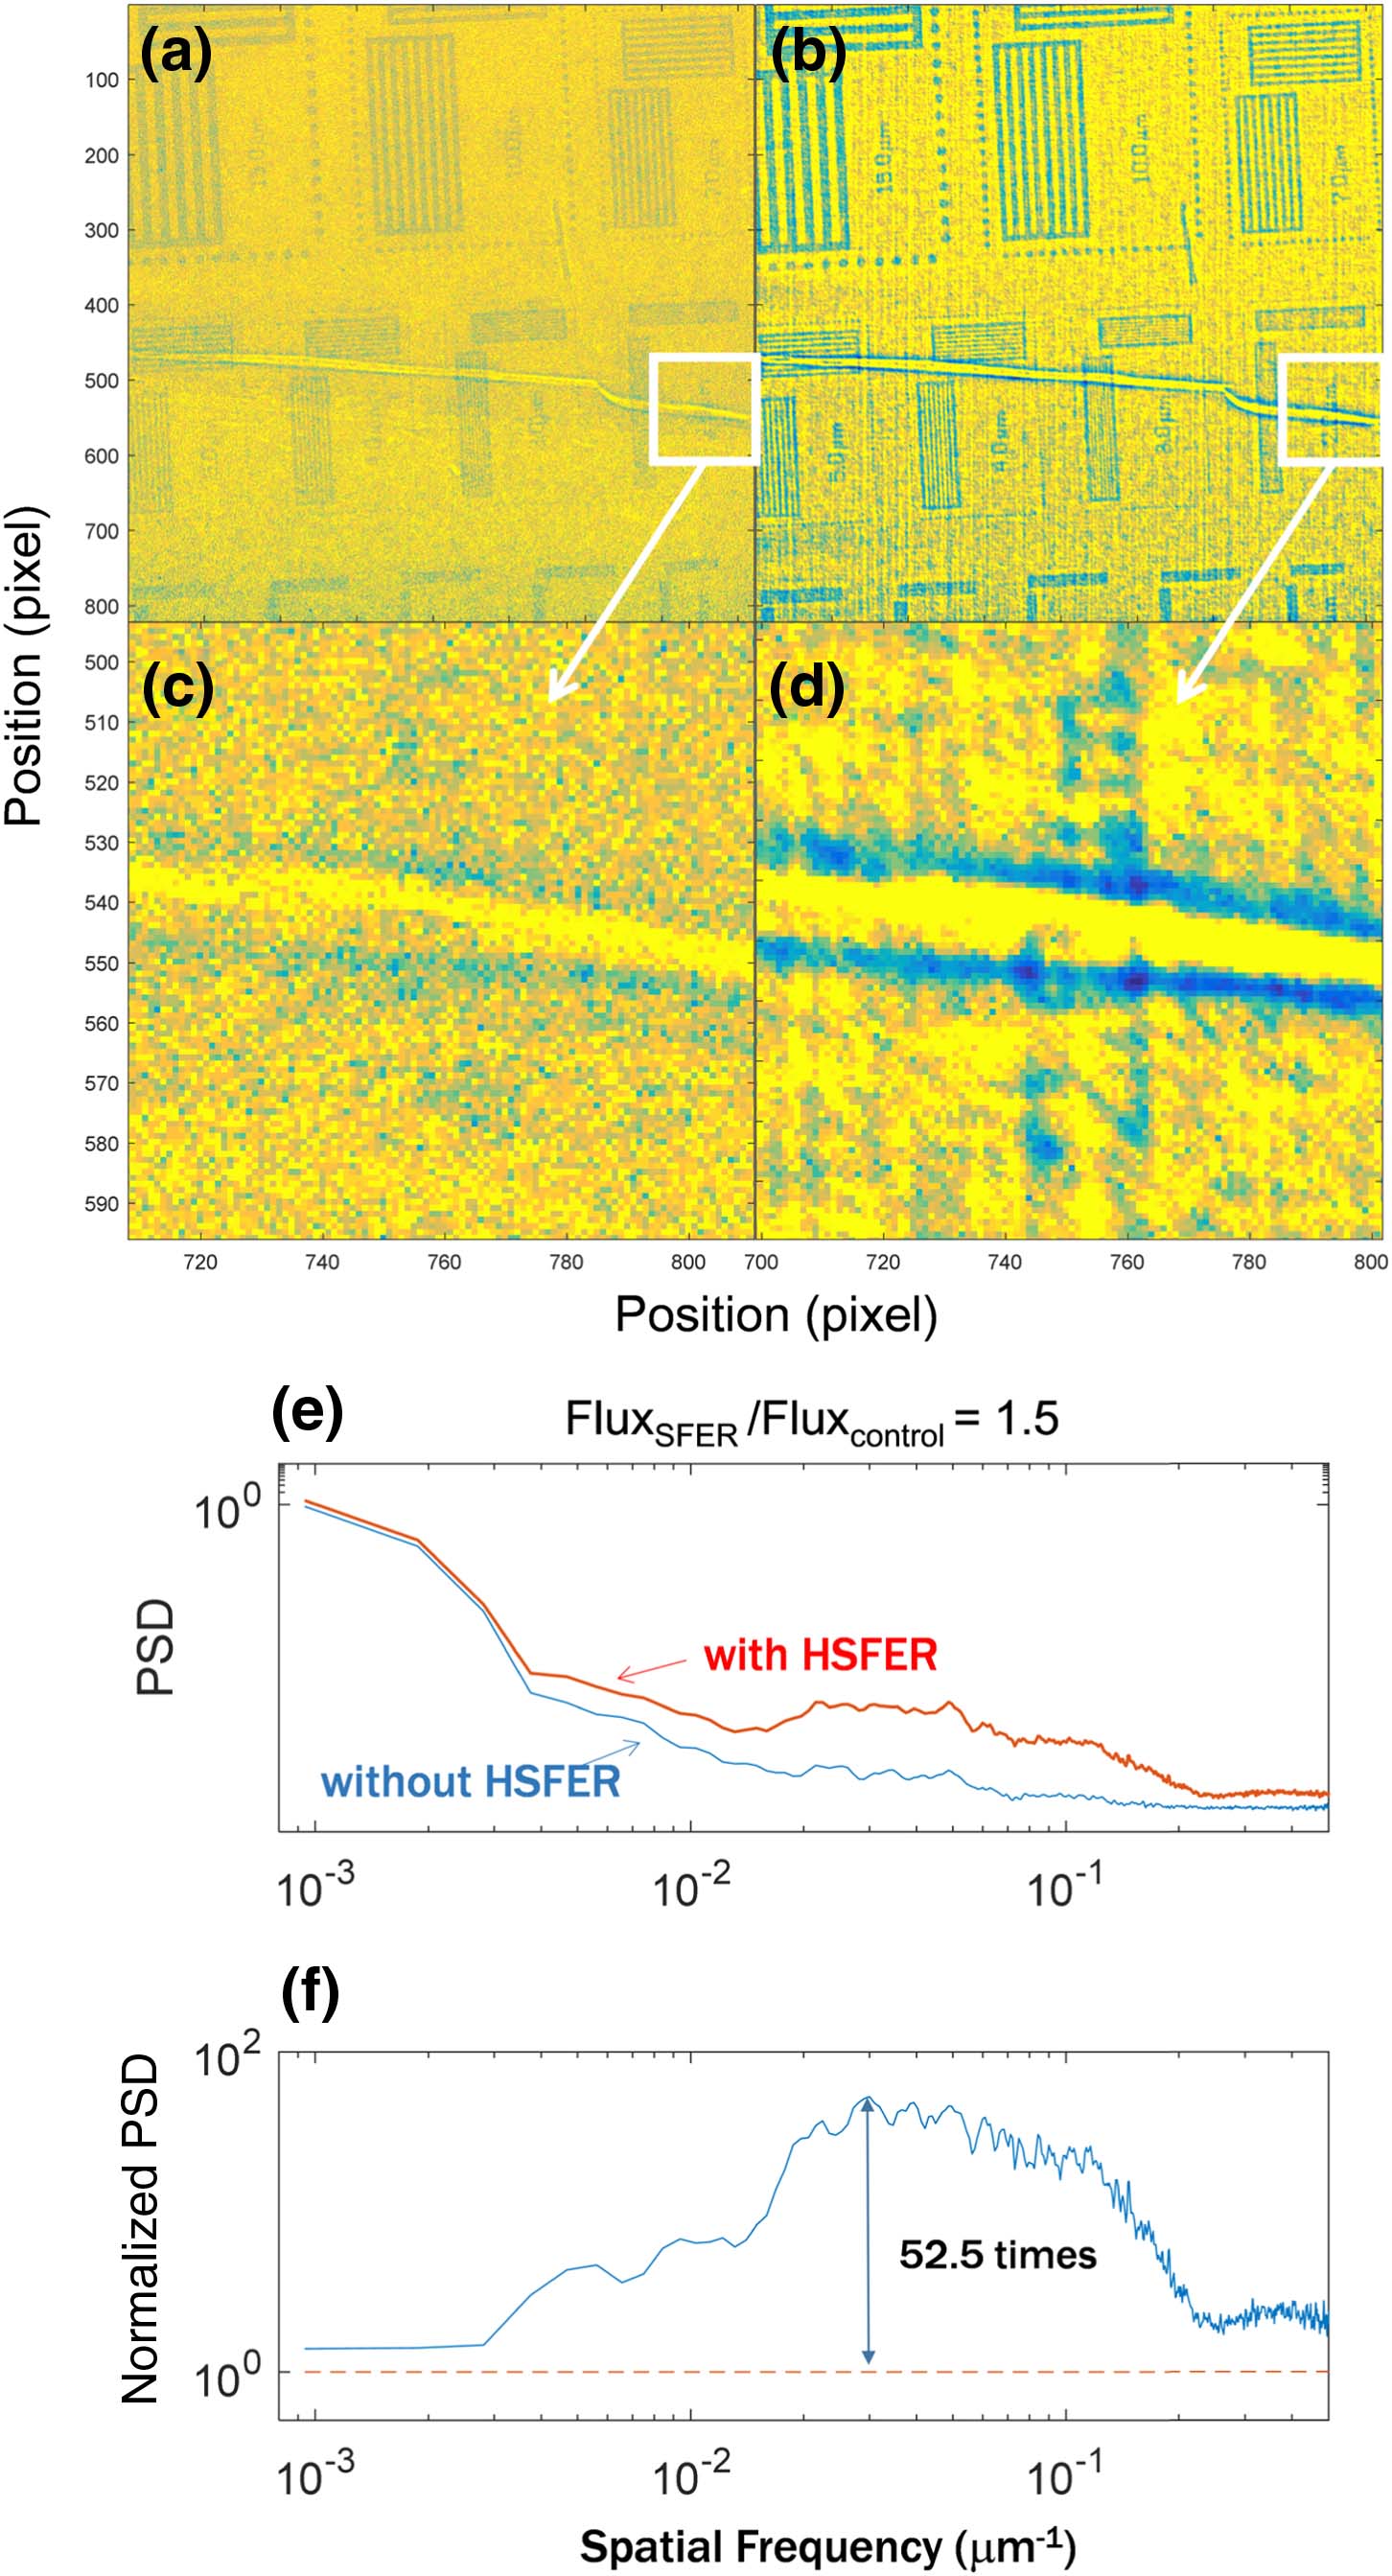
Fig. 5. Radiographs of the resolution chart obtained with a 0.5 s exposure (the dose is 6×10⁷  phs/mm2). (a), (b) Imaging results without and with the HSFER method, respectively. (c), (d) Magnified views of the regions of interest in (a) and (b), respectively. (e) PSDs of the images in (a) and (b), whereby the red and blue curves represent the cases with and without the HSFER, respectively. (f) PSDs with respect to the case at which the HSFER was not used.

下载图片 查看所有图片

We applied the HSFER technique to image a practical biological sample, i.e., the gill region in a dehydrated zebrafish. The parallel secondary lamellae on both sides of each gill filament denote the respiratory sites of gas exchange [22]. These can be observed from the ambiguous signals in the radiograph [Fig. 6(a)] (indicated by the white circles). In contrast, the same lamellae are more evident in the HSFER image [Fig. 6(b)]. Furthermore, the previously unrecognized features are also clearly displayed in the HSFER-based radiography [marked by the red circles in Figs. 6(a) and 6(b)]. By the same analysis as Fig. 4, it can be concluded that the noise equivalent resolution is improved from 4.8 to 3.0 μm. The SNR is increased by up to 7.7 times at (26  μm)1. In addition, the much more apparent details in the low-X-ray-dose area shown in the rectangular region of Fig. 6(b) than those in Fig. 6(a) suggest the occurrence of other biological implications and deserve further study.
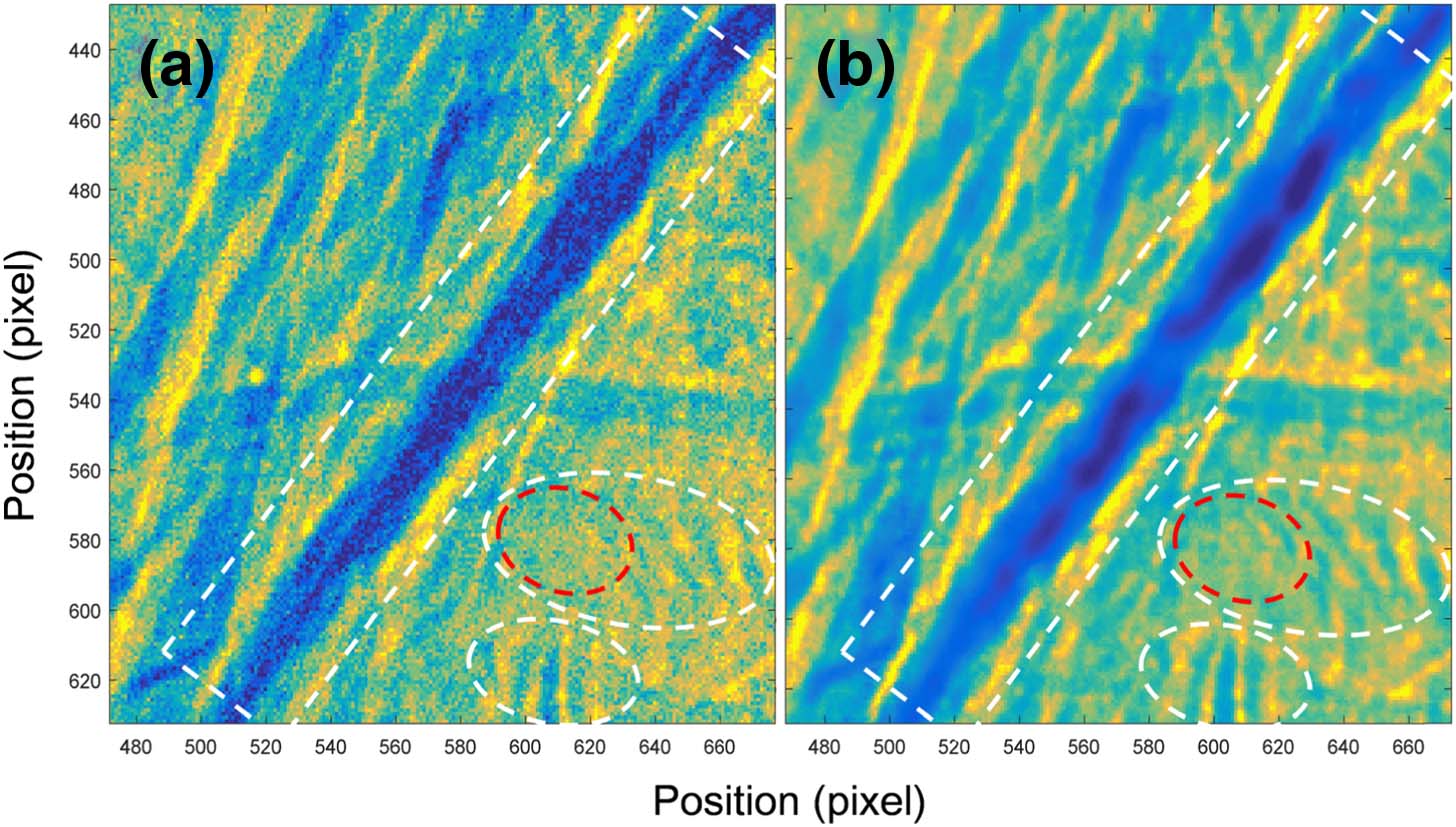
Fig. 6. Radiographs of the gill of a dehydrated zebrafish following an exposure of 1 s (the dose is 1.2×10⁸  phs/mm2). More detailed structures in the regions of interest can be found in (b) the HSFER image compared with that in (a) the conventional image.

下载图片 查看所有图片

5. CONCLUSIONS

In summary, a new X-ray indirect imaging technology, known as the HSFER method, was proposed to retain the image details in lens-coupled scintillator imagers. This method was demonstrated successfully based on (i) resolution chart imaging tests and (ii) a practical biological specimen imaging experiment. This method is essentially applicable to spatial incoherent imaging with broadband sources. In a scintillator imager using the HSFER method, the optical information was encoded by a 2D high-density grating and decoded with an iteration method. During this process, the middle-high-frequency and high-frequency information was exploited and led to high-SNR images with high fidelity, even in the case of low-dose X-ray irradiation. Furthermore, the noise equivalent resolution was improved. This method is expected to be applicable with various X-ray sources, such as large synchrotron radiation devices and desktop X-ray tubes, and is expected to enable low-dose and high-quality imaging.

6 Acknowledgment

Acknowledgment. The authors are grateful for the support of SSRF-BL08U1B beamline for sample preparation and the help from SSRF-BL08U1A. Special thanks are attributed to Wencong Zhao, Mei Chen, and Huaina Yu for their preliminary work related to this research. Thanks are also extended to You He and Zijian Xu for their help.

References

[1] P. A. Douissard, A. Cecilia, X. Rochet, X. Chapel, T. Martin, T. van de Kamp, L. Helfen, T. Baumbach, L. Luquot, X. Xiao. A versatile indirect detector design for hard X-ray microimaging. J. Instrum., 2012, 7: P09016.

[2] H. M. Thirimanne, K. D. G. I. Jayawardena, A. J. Parnell, R. M. I. Bandara, A. Karalasingam, S. Pani, J. E. Huerdler, D. G. Lidzey, S. F. Tedde, S. R. P. Silva. High sensitivity organic inorganic hybrid X-ray detectors with direct transduction and broadband response. Nat. Commun., 2018, 9: 2926.

[3] M. Moszynski, M. Kapusta, M. Mayhugh, D. Wolski. Absolute light output of scintillators. IEEE Trans. Nucl. Sci., 1997, 44: 1052-1061.

[4] M. Kronberger, E. Auffray, P. Lecoq. Probing the concepts of photonic crystals on scintillating materials. IEEE Trans. Nucl. Sci., 2008, 55: 1102-1106.

[5] Z. Zhu, S. Wu, C. Xue, J. Zhao, L. Wang, Y. Wu, R. Tai. Enhanced light extraction of scintillator using large-area photonic crystal structures fabricated by soft-X-ray interference lithography. Appl. Phys. Lett., 2015, 106: 241901.

[6] M. Chen, H. Yu, J. Zhao, L. Wang, H. Xie, Y. Wu, R. Tai. Effect of photonic crystal preparation methods on imaging resolution of synchrotron radiation scintillation detector. Nucl. Technol., 2015, 38: 5-10.

[7] M. G. L. Gustafsson. Nonlinear structured-illumination microscopy: wide-field fluorescence imaging with theoretically unlimited resolution. Proc. Natl. Acad. Sci. USA, 2005, 102: 13081-13086.

[8] Z. Liu, S. Durant, H. Lee, Y. Pikus, N. Fang, Y. Xiong, X. Zhang. Far-field optical superlens. Nano Lett., 2007, 7: 403-408.

[9] P. C. Chaumet, K. Belkebir, A. Sentenac. Superresolution of three-dimensional optical imaging by use of evanescent waves. Opt. Lett., 2004, 29: 2740-2742.

[10] M. J. Kitchen, G. A. Buckley, T. E. Gureyev, M. J. Wallace, N. Andres-Thio, K. Uesugi. CT dose reduction factors in the thousands using X-ray phase contrast. Sci. Rep., 2007, 7: 15953.

[11] Y. C. Kim, K. H. Kim, D. Y. Son, D. N. Jeong, J. Y. Seo, Y. S. Choi, N. G. Park. Printable organometallic perovskite enables large-area, low-dose X-ray imaging. Nature, 2017, 550: 87-91.

[12] S. Ohtsuka, Y. Sugishita, T. Takeda, Y. Itai, K. Hyodo, M. Ando. Dynamic intravenous coronary arteriography using synchrotron radiation and its application to the measurement of coronary blood flow. Jpn. Circ. J., 1997, 61: 432-440.

[13] C. Tötzke, N. Kardjilov, I. Manke, S. E. Oswald. Capturing 3D water flow in rooted soil by ultra-fast neutron tomography. Sci. Rep., 2017, 7: 6192.

[14] P. Cloetens, R. Barrett, J. Baruchel, J. P. Guigay, M. Schlenker. Phase objects in synchrotron radiation hard X-ray imaging. J. Phys. D, 2016, 9: 133-146.

[15] M. W. Westneat, J. J. Socha, W. K. Lee. Advances in biological structure, function, and physiology using synchrotron X-ray imaging. Annu. Rev. Physiol., 2008, 70: 119-142.

[16] Y. Ben-Aryeh. Transmission enhancement by conversion of evanescent waves into propagating waves. Appl. Phys. B, 2008, 91: 157-165.

[17] CristóbalG.JavidiB.VallmitjanaS., Information Optics (Springer, 2009).

[18] Z. Zhu, B. Liu, C. Cheng, H. Zhang, H. Chen, M. Gu, Y. Wu. Enhancement of directional broadband luminescence from a scintillation film via guided-mode resonance in a photonic crystal structure. Appl. Phys. Lett., 2017, 110: 051901.

[19] S. Yang, J. Zhao, L. Wang, F. Zhu, C. Xue, H. Liu, R. Tai. The influence of symmetry and duty cycle on the pattern generation in achromatic Talbot lithography. J. Vac. Sci. Technol. B, 2017, 35: 021601.

[20] S. Yang, J. Zhao, L. Wang, F. Zhu, C. Xue, H. Liu, R. Tai. Developments at SSRF in soft X-ray interference lithography. Nucl. Sci. Tech., 2015, 26: 010101.

[21] GonzalezR. C.WoodsR. E., Digital Image Processing (Prentice Hall, 2002).

[22] MengQ.SuJ.LiW., Comparative Anatomy of Fishes (Science Press, 1987).

Huijuan Xia, Yanqing Wu, Lei Zhang, Yuanhe Sun, Zhongyang Wang, Renzhong Tai. Great enhancement of image details with high fidelity in a scintillator imager using an optical coding method[J]. Photonics Research, 2020, 8(7): 07001079.


引用该论文: TXT   |   EndNote

相关论文

加载中...

关于本站 Cookie 的使用提示

中国光学期刊网使用基于 cookie 的技术来更好地为您提供各项服务,点击此处了解我们的隐私策略。 如您需继续使用本网站,请您授权我们使用本地 cookie 来保存部分信息。
全站搜索
您最值得信赖的光电行业旗舰网络服务平台!