基于神经网络反演中国南海海域透明卷云参数
Cirrus clouds are located in the upper troposphere and lower stratosphere and are mostly composed of ice crystal particles with a cloud top pressure of less than 440 hPa. Meanwhile, they are widely distributed, covering an area of approximately 20%-35% of the earth. In tropical regions, the coverage area of cirrus clouds reaches 70%. Cirrus clouds play a very important role in the earth atmosphere system by reflecting solar shortwave radiation and absorbing surface thermal radiation. Passive remote sensing features wide spatial coverage and high temporal resolution, but its detection for thin cirrus clouds is relatively limited. A large number of thin cirrus clouds with optical depth of less than 0.4 are missed by passive remote sensing. This phenomenon is particularly serious in tropical areas, which greatly underestimates the coverage of cirrus clouds and causes large errors in radiation calculation. Fortunately, the dual-wavelength cloud aerosol lidar infrared with orthogonal polarization (CALIOP) onboard the CALIPSO has unparalleled advantages in detecting thin cirrus clouds, which can detect thin cirrus clouds with optical depth less than 2. However, CALIOP cannot penetrate thick cirrus clouds, with limited spatial coverage. Therefore, we combine active and passive remote sensing to identify and retrieve optical depths and top heights of single-layer transparent cirrus clouds over the South China Sea. We hope that our research can provide quantitative support for the distribution of thin cirrus clouds over the South China Sea, and help improve the radiation calculation accuracy.
Artificial neural networks have powerful nonlinear function fitting ability and can employ multi-channel information, which makes them widely applicable in cloud parameter retrieval. Based on a matched dataset from MODIS/CALIOP, we utilize back propagation (BP) neural networks for the identification and parameter retrieval of single-layer transparent cirrus clouds over the South China Sea. First, to obtain a perfect dataset, we conduct several steps, including MODIS/CALIOP data collection, data processing, data conversion, data resampling, data matching, and data filtering. Additionally, we collect MODIS/MYD02_1 km and CALIOP/Level2_CloudLayer_5 km data for a total of six years from 2009 to 2015 over the South China Sea. MODIS raw data are converted to brightness temperature as inputs of neural networks. Due to the spatial resolution of 1 km for MYD02 data, it is necessary to resample it to 5 km for data matching with CALIOP. Meanwhile, data filtering based on three conditions is conducted, including CAD_Score and Number_Layers_Found from CALIOP, and MODIS/CALIOP pixel distance. We set the threshold of CAD_Score as 50. Since we only focus on single-layer transparent cirrus clouds, Number_Layer_Found is set as 1 and the distance between MODIS/CALIOP is ensured to be no more than one pixel (5 km). After filtering, a total of 274786 data samples were obtained from 2009 to 2015, including 120980 single-layer transparent cirrus samples and 153806 clear sky samples. To increase the proportion of positive samples (transparent cirrus clouds) to improve the model accuracy, we randomly downsample the clear sky samples by 0.6 times to obtain 92284 clear sky samples. Therefore, a dataset containing 213264 samples is finally acquired. We divide the dataset into training, testing, and validation sets in a 6∶3∶1 ratio, and three neural networks are proposed, including one for detecting transparent cirrus clouds, one for retrieving optical depths, and one for retrieving top heights.
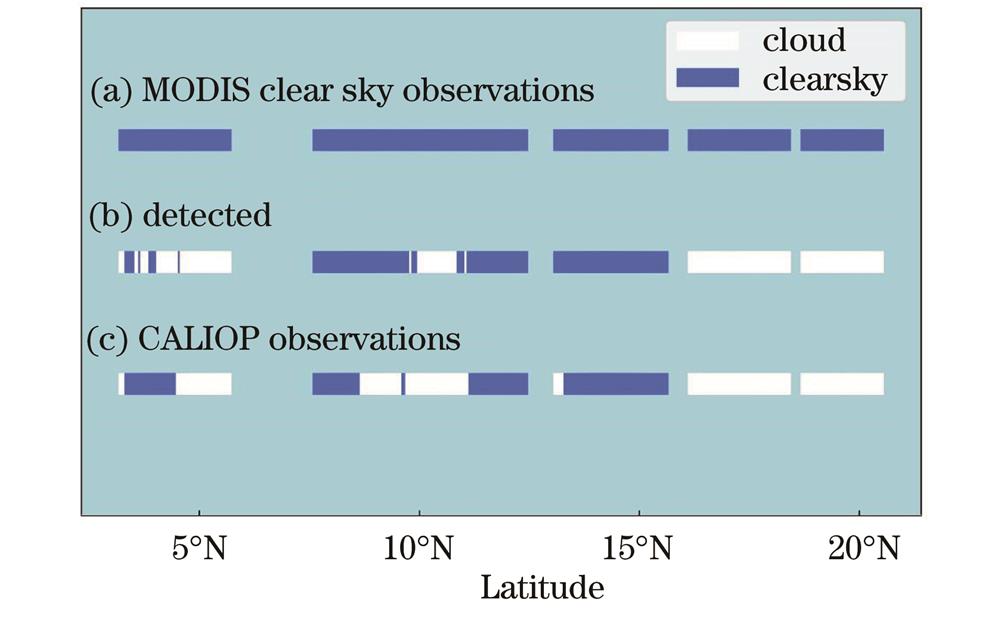
In the identification of transparent cirrus clouds, the probability threshold of the network output is set to 0.56, which can achieve the optimal detection rate and false alarm rate, with a detection rate of 79%, a false alarm rate of 9.8%, and an AUC of 0.92 [Fig. 3(a)]. A large number of transparent cirrus clouds with optical depth less than 0.1 result in a low detection rate and a high false alarm rate, which is because it is difficult to distinguish these cirrus clouds from clear skies. The detection rate rapidly increases with the rising optical depth [Fig. 3(b)]. When the optical depth is less than 0.03 or greater than 0.4, the detection rate is only 36% or over 95% respectively. Among them, when the optical depth is greater than 1, the detection rate can reach 100%, indicating that the neural network can detect transparent cirrus clouds in the region, but the detection performance on the subvisual cirrus clouds with optical depth less than 0.03 is poor. For the optical depth retrieval of transparent cirrus clouds, the error exceeds 500% under the optical depth of less than 0.03. As the optical depth gradually increases, the error rapidly decreases to within 100%. When the optical depth is greater than 0.2, the error is within 50% [Fig. 5(a)]. The reason for the large overall error is that the neural network has a significant error in retrieving cirrus clouds with optical depth less than 0.03. The error for the top height of cirrus clouds is mainly distributed around 5%. In the parts with cloud top heights less than 10 km and greater than 17.5 km, greater errors can be observed [Fig. 5(b)], and the main reason for speculation is that the sample sizes in these two intervals are relatively small. The scatter plots reveal good linear relations between the predicted and true values (Fig. 6), with correlation coefficients reaching 0.79 (for optical depth) and 0.87 (for top height). The mean absolute error and root mean square error for the optical depth are 0.2 and 0.25 respectively. The mean absolute error and root mean square error of the top height retrieval are 0.61 km and 0.74 km respectively. In a case study, the comparison with CALIOP data shows that the research results have a certain reliability degree (Figs. 9 and 10).
Based on the MODIS/CALIOP matched dataset, neural networks are adopted to first detect transparent cirrus clouds, then retrieve the optical depth and cloud top height of the detected transparent cirrus clouds, and compare the results with the CALIOP data. The results show that the classification neural network can detect transparent cirrus clouds with a detection rate of 79%. The retrieval results show that it has a high agreement with CALIOP data. The correlation of the optical depth is 0.79 and that of the cloud top height is 0.87. The classification neural network has poor detection ability for subvisual cirrus clouds with optical depth less than 0.03, with a detection rate of only 36% and a larger retrieval error. As the optical depth increases, the detection rate rises rapidly. For the parts with optical thickness greater than 0.4, the detection rate reaches more than 95% and the retrieval error decreases rapidly. Finally, we perform a case study. The results show that the detection results of the neural network are more consistent with the observations of CALIOP than the official MODIS product. The retrieval results are in good agreement with CALIOP data. The results can provide references for the distribution of transparent cirrus clouds missed by MODIS, and help improve the radiation calculation accuracy.
1 引言
卷云位于对流层上部和平流层下部,云顶气压小于440 hPa,多由冰晶粒子组成[1-2]。卷云分布广泛,约覆盖地球面积20%~35%,热带地区的卷云覆盖面积达到70%[3]。卷云通过反射太阳短波辐射和吸收地表热辐射,在地气系统中扮演着非常重要的角色[4]。其次,卷云会干扰空间信息的传输,对空间目标识别的准确性造成很大的影响[5]。此外,卷云是激光大气传输的重要影响因素,随着卷云光学厚度的增加,激光的透过率会大大降低[6]。张秀再等[7]的研究表明,卷云对量子通信光信号的传输有极大的影响。
卫星遥感探测卷云的手段分为被动探测和主动探测[8]。其中,被动探测器具有空间覆盖广、时间分辨率高等优势,主动探测器具有高灵敏度以及可提供目标的空间垂直结构信息的优点[9-10]。然而,被动探测器对薄卷云的探测有限,漏检了大量光学厚度小于0.4的薄卷云[11-12],导致辐射计算产生较大的误差。Gao等[13]的研究表明,热带地区近40%的薄卷云被中分辨率成像光谱仪(MODIS)官方云检测算法标记为晴空像元。Sun等[14]指出光学厚度小于0.3的薄卷云可使日均反射太阳短波辐射量增加2.5 W·m-2,光学厚度为0.1的薄卷云可使热辐射增加15 W·m-2。搭载在CALIPSO卫星上的双波长激光雷达CALIOP对薄卷云的探测具有无可比拟的优势,可有效探测光学厚度小于2的薄卷云,但由于消光作用,其对厚卷云的探测能力不足,而且空间覆盖范围有限[15-16]。
近年来,由于神经网络强大的非线性函数拟合能力,国内外已有许多研究将神经网络应用在了云参数反演领域。国内方面:2022年,Yang等[17]基于Himawari-8与CALIOP匹配数据集,利用机器学习方法进行了云检测和云顶高度反演,研究结果优于相关官方产品,但只限于光学厚度大于0.2的云。2019年,Min等[18]基于Himawari-8数据和CALIOP数据,利用机器学习方法对云顶高度进行了反演,研究结果证明了机器学习方法优于传统的物理方法。谭仲辉等[19]于2019年基于风云4A数据和CALIOP/Cloudsat数据,利用随机森林算法反演了云底高度,研究结果表明该算法对单层云的云底高度的估计结果较好,对多层云的估计结果较差。国外方面:2022年,Amell等[20]基于气象卫星Meteosat-9与Cloudsat匹配数据集,利用神经网络反演了冰水路径,反演结果与官方产品有较好的一致性。2021年,McHardy等[21]基于静止环境卫星GOES-16与CALIOP匹配数据集,利用机器学习方法对海域透明卷云进行了检测,结果表明该方法可有效检测出50%的光学厚度小于0.03的不可见卷云,但该方法只限于白天使用。2014年,Kox等[9]基于CALIOP与静止轨道成像仪SEVIRI的匹配数据集,利用神经网络对卷云的光学厚度和云顶高度进行了反演;2017年,Strandgren等[22]在此基础上提出了一个分类网络,先对卷云进行识别后进行参数反演,进而提高了反演精度。上述研究的不足在于引入了多层云的影响,由于存在大量的透明卷云,因此,遥感器接收的辐射信息可能包含多层云的信息。本文主要对单层透明卷云进行识别和参数反演,不考虑多层云。
本文基于2009—2015年同在A-Train轨道上的CALIOP和MODIS数据,利用神经网络对中国南海海域上空的单层透明卷云进行识别和参数反演。
2 实验数据与方法
2.1 MODIS和CALIOP
搭载在Aqua卫星上的MODIS可获得从可见光(0.405
CALIOP由于敏感性较高,以及可以探测目标的垂直结构信息,它的探测数据经常和被动遥感数据结合起来,以提供更为全面的云层空间信息[24]。本文使用的是CALIOP Level2_05 km云层产品。由于MODIS MYD02数据的空间分辨率为1 km,因此需要对其进行重采样至5 km,以便进行数据匹配。匹配方法采用最近邻法,数据处理流程如
MODIS数据转换公式如下:
式中:r为辐射值;M为MODIS原始数据;
表 1. MODIS部分红外波段校正系数
Table 1. MODIS correction coefficients for infrared bands
|
读取的CALIOP数据参数有特征分类标记、云-气溶胶区分置信度CAD_Score、532 nm特征光学厚度、特征层顶高度、特征层数以及经纬度。CALIOP数据处理中的位运算是对特征分类标记进行操作。该参数用16位二进制数表示,通过位运算可以得到透明卷云的信息。
本文根据CAD_Score、特征层数以及MODIS/CALIOP像元距离进行数据筛选。CAD_Score的值介于-100和100之间,其中0~100表示云的分类置信度,-100~0则代表气溶胶分类的置信度。CAD_Score的绝对值越大,分类正确的可信度就越高。本文只选取CAD_Score大于50且特征层数为1的云层信息,同时保证MODIS/CALIOP之间的距离不超过5 km。
根据上述三个条件进行筛选后,得到2009—2015年的数据样本共274786条,其中单层透明卷云样本120980条,晴空样本153806条。为提升透明卷云样本比例以提高模型的准确率,本文对晴空样本以0.6的系数进行随机降采样,得到92284个晴空样本,最终得到一个包含213264个样本的数据集。本文按6∶3∶1的比例将数据集分为训练集、测试集和验证集。
2.2 BP神经网络
BP神经网络应用广泛,它通过激活函数来实现非线性拟合。本文采用Relu函数和Sigmoid函数作为激活函数。Relu函数的数学表达式为
Sigmoid函数的数学表达式为
分类问题中,二元交叉熵是很常见的损失函数,它描述了两种分布之间的差异。回归问题使用输出值与真值的均方误差作为损失函数。本文选用自适应矩估计Adam优化器。Adam在训练过程中可以自适应地调整学习率,从而提高模型的收敛速度。
此外,本文使用早停法Early Stopping防止模型过拟合。实验中,训练批次batch_size设为128,使用He初始化方法对权重和偏置进行初始化。隐含层神经元的数量通常是输入特征个数的1~2倍,本文有12个输入参数,因此隐含层的神经元数量设为16。
基于上述讨论,本文提出3个神经网络。一个分类神经网络用来识别透明卷云,使用3层隐含层,每层16个神经元,激活函数为Relu函数,输出层采用Sigmoid函数输出概率值,损失函数为二元交叉熵,选择Adam优化器;一个回归神经网络用来反演透明卷云的光学厚度(COD);一个回归神经网络用来反演透明卷云的云顶高度(CTH)。两个回归神经网络均采用3层隐含层、每层16个神经元的结构,激活函数为Relu函数,损失函数为均方误差
网络以MODIS各波段的亮温、亮温差等信息作为输入,包括bt6.7 μm、bt7.3 μm、bt8.5 μm、bt11 μm、bt12 μm、bt13.34 μm、bt13.64 μm、bt13.94 μm、btd6.7-7.3、btd8.5-12、btd11-12。考虑到卷云随季节的变化情况,本文加入了当天天数的信息(D),且为了消除2009—2015年每年的12月31日至次年1月1日之间的差距,将其转换成正弦值
式中:
2.3 验证指标
本文选取7个指标对结果进行分析,其中,检测率
式中:
式中:
3 分析与讨论
3.1 透明卷云参数的分布

图 2. 透明卷云光学厚度和云顶高度。(a)透明卷云光学厚度;(b)云顶高度
Fig. 2. Histograms of transparent cirrus cloud optical depth and top height. (a) Transparent cirrus cloud optical depth; (b) top height of cirrus cloud
3.2 透明卷云的识别结果分析

图 3. 检测率
Fig. 3. ROC curve of probability of detection
在识别透明卷云时,将网络输出的概率阈值设为0.56可达到最优的检测率和误报率,检测率为79%,误报率为9.8%,AUC达到0.92。检测率较低和误报率较高是因为存在大量光学厚度小于0.1的透明卷云。基于该阈值,得到对应的混淆矩阵(
表 2. 混淆矩阵
Table 2. Confusion matrix
| |||||||||||||
3.3 透明卷云参数反演结果分析

图 4. 透明卷云光学厚度和云顶高度的
Fig. 4. MPE and

图 5.
Fig. 5. MPE and MAPE varying with optical depth and top height. (a) Optical depth; (b) top height

图 6. 预测值与真值的散点图。(a)光学厚度;(b)云顶高度
Fig. 6. Scatter plots of predicted values and true values. (a) Optical depth; (b) top height
表 3. 算法对比结果
Table 3. Comparison of results of related algorithms
| ||||||||||||||
3.4 个例分析
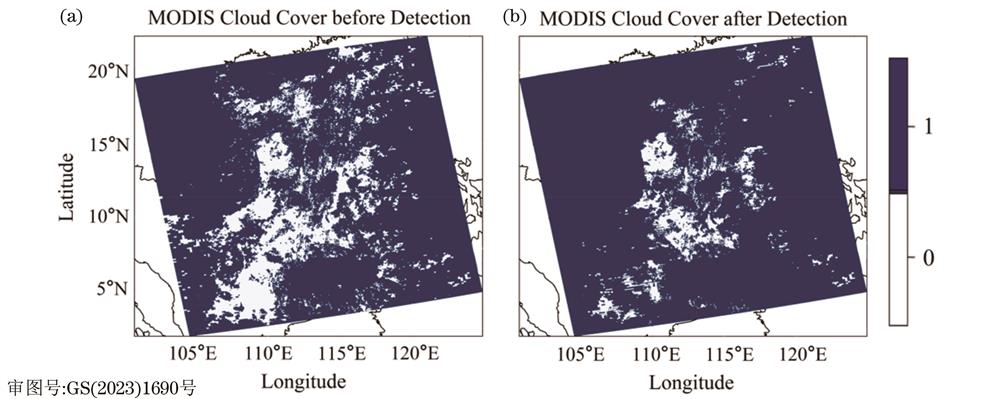
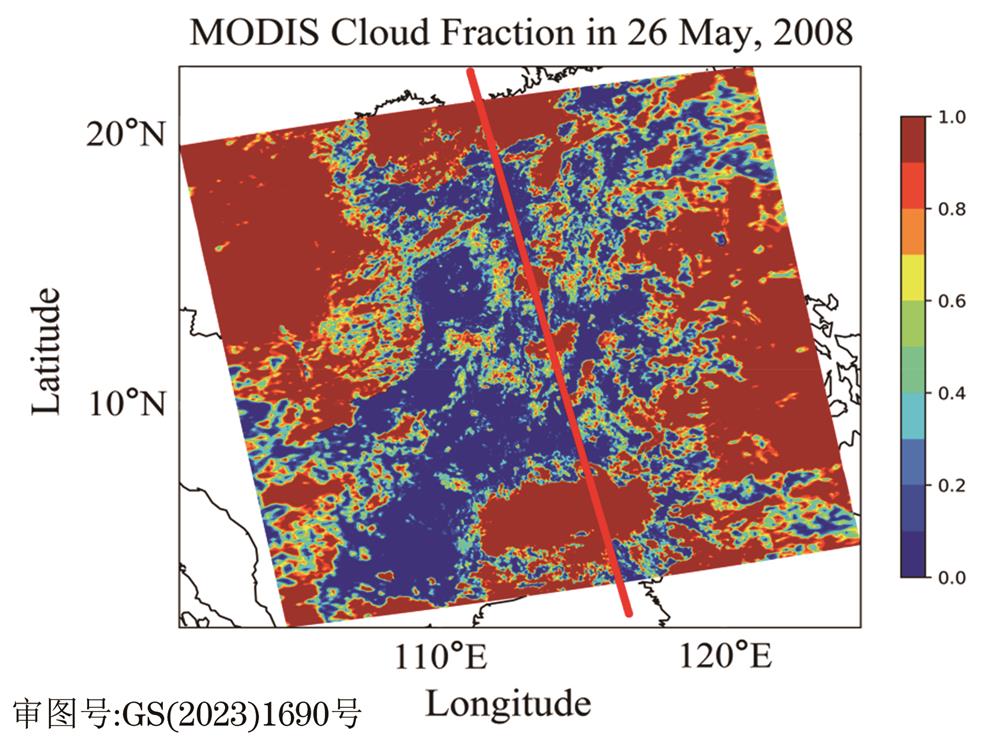
对任何云量值大于0的像元,本文都认为是云像元。经过阈值处理以及透明卷云神经网络的检测得到

图 8. MODIS产品云量分布。(a)检测前;(b)检测后
Fig. 8. Distributions of MODIS cloud fraction. (a) Before detection; (b) after detection

图 9. 检测结果对比。(a)MODIS晴空观测结果;(b)神经网络检测结果;(c)CALIOP观测结果
Fig. 9. Comparison of detection results. (a) MODIS clear sky observation results; (b) detected results of neural network; (c) CALIOP observation results

图 10. 反演值与真值对比。(a)光学厚度;(b)云顶高度
Fig. 10. Comparison of inverse values and true values. (a) Optical depth; (b) top height

图 12. MODIS漏检透明卷云的光学厚度和云顶高度分布。(a)光学厚度;(b)云顶高度
Fig. 12. Distributions of optical depth and top height of transparent cirrus clouds undetected by MODIS. (a) Optical depth; (b) top height
4 结论
本文基于MODIS与CALIOP的匹配数据集,利用神经网络首先对透明卷云进行识别检测,再对成功识别出的透明卷云进行光学厚度和云顶高度的反演,并将结果与CALIOP真值数据进行比较。结果显示,分类神经网络能够较好地检测出透明卷云,检测率为79%。反演结果与真值具有较好的一致性。其中:光学厚度的相关性为0.79,优于相关研究;云顶高度的相关性达到0.87。神经网络模型对光学厚度小于0.03的不可视卷云的检测能力较差,检测率只有36%,且反演误差较大。随着光学厚度的增大,检测率迅速上升。当光学厚度大于0.4时,检测率达到95%以上,且反演误差迅速下降。最后对实例进行验证分析。结果表明,相比于MODIS官方产品,神经网络的检测结果更加符合CALIOP的观测结果;之后对识别出来的透明卷云进行参数反演,反演结果与真值存在较好的一致性。研究结果为MODIS漏检的透明卷云的分布情况提供了一定的参考价值,有利于提高辐射计算的精度。
[1] Cziczo D J, Froyd K D, Hoose C, et al. Clarifying the dominant sources and mechanisms of cirrus cloud formation[J]. Science, 2013, 340(6138): 1320-1324.
[2] Liou K N. Influence of cirrus clouds on weather and climate processes: a global perspective[J]. Monthly Weather Review, 1986, 114(6): 1167-1199.
[3] Dessler A E, Yang P. The distribution of tropical thin cirrus clouds inferred from TerraMODIS data[J]. Journal of Climate, 2003, 16(8): 1241-1247.
[4] Sassen K, Campbell J R. A midlatitude cirrus cloud climatology from the facility for atmospheric remote sensing. part I: macrophysical and synoptic properties[J]. Journal of the Atmospheric Sciences, 2001, 58(5): 481-496.
[5] 蔡熠, 刘延利, 戴聪明, 等. 卷云大气条件下目标与背景对比度模拟分析[J]. 光学学报, 2017, 37(8): 0801001.
[7] 张秀再, 徐茜, 刘邦宇. 卷云对自由空间星地量子通信信道的影响[J]. 光学学报, 2021, 41(20): 2027001.
[8] 叶松, 付思梦, 李树, 等. 基于MODIS参数的卷云光学厚度计算方法[J]. 激光与光电子学进展, 2021, 58(19): 1901003.
[9] Kox S, Bugliaro L, Ostler A. Retrieval of cirrus cloud optical thickness and top altitude from geostationary remote sensing[J]. Atmospheric Measurement Techniques, 2014, 7(10): 3233-3246.
[10] 季承荔, 陶宗明, 胡顺星, 等. 三波长激光雷达探测合肥地区卷云特性[J]. 光学学报, 2014, 34(4): 0401001.
[11] Ackerman S A, Holz R E, Frey R, et al. Cloud detection with MODIS: part II. Validation[J]. Journal of Atmospheric and Oceanic Technology, 2008, 25(7): 1073-1086.
[12] Meyer K, Platnick S. Utilizing the MODIS 1.38 μm channel for cirrus cloud optical thickness retrievals: algorithm and retrieval uncertainties[J]. Journal of Geophysical Research: Atmospheres, 2010, 115(D24): 209-222.
[13] Gao B C, Kaufman Y J, Tanre D, et al. Distinguishing tropospheric aerosols from thin cirrus clouds for improved aerosol retrievals using the ratio of 1.38-μm and 1.24-μm channels[J]. Geophysical Research Letters, 2002, 29(18): 1890-1891.
[14] Sun W B, Videen G, Kato S, et al. A study of subvisual clouds and their radiation effect with a synergy of CERES, MODIS, CALIPSO, and AIRS data[J]. Journal of Geophysical Research: Atmospheres, 2011, 116(D22): 207-217.
[15] Mao F Y, Pan Z X, Henderson D S, et al. Vertically resolved physical and radiative response of ice clouds to aerosols during the Indian summer monsoon season[J]. Remote Sensing of Environment, 2018, 216: 171-182.
[17] Yang Y K, Sun W X, Chi Y L, et al. Machine learning-based retrieval of day and night cloud macrophysical parameters over East Asia using Himawari-8 data[J]. Remote Sensing of Environment, 2022, 273: 112971.
[18] Min M, Li J, Wang F, et al. Retrieval of cloud top properties from advanced geostationary satellite imager measurements based on machine learning algorithms[J]. Remote Sensing of Environment, 2020, 239: 111616.
[19] 谭仲辉, 马烁, 韩丁, 等. 基于随机森林算法的FY-4A云底高度估计方法[J]. 红外与毫米波学报, 2019, 38(3): 381-388.
[20] Amell A, Eriksson P, Pfreundschuh S. Ice water path retrievals from Meteosat-9 using quantile regression neural networks[J]. Atmospheric Measurement Techniques, 2022, 15(19): 5701-5717.
[21] McHardy T M, Campbell J R, Peterson D A, et al. Advancing maritime transparent cirrus detection using the advanced baseline imager “cirrus” band[J]. Journal of Atmospheric and Oceanic Technology, 2021, 38(6): 1093-1110.
[22] Strandgren J, Bugliaro L, Sehnke F, et al. Cirrus cloud retrieval with MSG/SEVIRI using artificial neural networks[J]. Atmospheric Measurement Techniques, 2017, 10(9): 3547-3573.
[23] Barnes W L, Xiong X, Salomonson V V. Status of terra MODIS and aqua modis[J]. Advances in Space Research, 2003, 32(11): 2099-2106.
[24] Sassen K, Wang Z E, Liu D. Global distribution of cirrus clouds from CloudSat/Cloud-Aerosol Lidar and Infrared Pathfinder Satellite Observations (CALIPSO) measurements[J]. Journal of Geophysical Research, 2008, 113: D00A12.
Article Outline
陆文强, 杨世植, 罗涛, 李学彬, 崔生成, 程晨, 韩露, 石建军, 韩叶颜. 基于神经网络反演中国南海海域透明卷云参数[J]. 光学学报, 2024, 44(6): 0601001. Wenqiang Lu, Shizhi Yang, Tao Luo, Xuebin Li, Shengcheng Cui, Chen Cheng, Lu Han, Jianjun Shi, Yeyan Han. Parameter Retrieval of Transparent Cirrus Clouds over South China Sea Based on Artificial Neural Networks[J]. Acta Optica Sinica, 2024, 44(6): 0601001.


