Photonics Research, 2016, 4 (6): 06000306, Published Online: Dec. 23, 2016   

Detection and upconversion of three-dimensional MMW/THz images to the visible Download: 1374次

Author Affiliations
1 Department of Electrical and Electronic Engineering, Ariel University, Ariel, Israel
2 Department of Electrical and Computer Engineering, Ben-Gurion University of the Negev, Beer-Sheva, Israel
3 Department of Electro-Optical Engineering, Ben-Gurion University of the Negev, Beer-Sheva, Israel
Abstract
We present an inexpensive technique to obtain a three-dimensional (3D) millimeter wave (MMW) and terahertz (THz) image using upconversion. In this work we describe and demonstrate a method for upconversion of MMW/THz radiation to the visual band using a very inexpensive miniature glow discharge detector (GDD) and a silicon photodetector. We present MMW/THz upconversion images based on measuring the visual light emitting from the GDD rather than its electrical current. The results show better response time and better sensitivity compared to the electronic detection performed previously. Furthermore, in this work we perform frequency modulation continuous wave (FMCW) radar detection based on this method using a GDD lamp, with a photodetector to measure GDD light emission. By using FMCW detection, the range in addition to the intensity at each pixel can be obtained, thus yielding the 3D image. The GDD acts as a heterodyne mixer not only electronically but also optically. Thesuggested 3D upconversion technique using the GDD is simple and inexpensive and has better performance compared to other MMW/THz imaging systems suggested in the literature. This method provides minimum detectable signal power that is about 6 orders of magnitude better than similar plasma systems due to the very largeinternal signal gain deriving from the much smaller electrode separation and resulting in much higher plasma electric field.

1. INTRODUCTION

The use of millimeter wave (MMW) and terahertz (THz) radiation has increased in recent years, especially in the fields of spectroscopy [1] and imaging [2,3]. More and more applications in medicine, communications, homeland security, material science, and space technology are based on MMW and THz radiation bands [24" target="_self" style="display: inline;">–4]. The motivation to use these bands is that there is no known ionization hazard for biological tissue, the atmospheric scattering of MMW and THz radiation is relatively low, and the penetration through dielectric materials is quite good [24" target="_self" style="display: inline;">–4]. Furthermore, the lack of inexpensive room temperature detectors and focal plane arrays (FPAs) in these spectral regions makes it difficult to develop some of the above applications, especially those that require the use of real-time three-dimensional (3D) imaging. Currently, one of the main goals of MMW and THz technology is the development of low-cost, fast, highly sensitive, compact, and room-temperature detectors. Miniature neon indicator lamps were found to be very good detectors in the MMW and THz regions. They are also known as glow discharge detectors (GDDs). The GDD is a room temperature detector that was previously proven to be a very sensitive and inexpensive MMW/THz radiation detector [57" target="_self" style="display: inline;">–7], capable of direct and heterodyne radiation detection [810" target="_self" style="display: inline;">–10]. FPAs based on GDD pixels were constructed and experimentally demonstrated [8]. In those demonstrations, a measurement of GDD electrical current as a function of incident MMW/THz radiation was carried out. In this work, we demonstrate and experimentally test an upconversion of MMW/THz radiation to visual light using a GDD, with a silicon detector to measure the intensity of GDD output light.

There are already several existing room-temperature MMW and THz detectors [2,3]. The most popular detectors are Golay cells, pyroelectric detectors, bolometers, and microbolometers, many of which are too slow for video frame rates. Among those detectors, the vanadium oxide (VOx) microbolometer was found to be suitable for the design of high-resolution FPA imaging [2,3]. The disadvantages of using a VOx microbolometer are low sensitivity and slow response time, as described in detail in Refs. [2,3]. Very fast existing-room-temperature MMW/THz detectors are based on Schottky diodes. The disadvantage of these detectors is that they are much less sensitive at the higher frequencies of the THz band [11]. Furthermore, Schottky diode performance was compared to GDD performance in a THz interferometer [11]. It was found that the GDD has a higher signal-to-noise ratio, a linear response, and a faster response time than the Schottky diode [11]. All the detectors described above are expensive detectors. In this work we use the GDD, which is a room-temperature detector with high dynamic range, is very broadband, exhibits fast response time, and is rigid, easy to operate, commercially available, and very inexpensive (costing about $0.20–$0.50 each).

The GDD’s detection mechanism is based on a slight change of current between the two electrodes of the lamp; these current changes occur due to the electric field of the electromagnetic radiation being incident on the GDD. The expression for the change in bias current of the GDD due to MMW/THz radiation is given by Ref. [12]: where Gexp(2·νi·td)2·νi·td represents the internal signal amplification (calculations indicate that it can be on the order of a million [12]), q is the electron charge, V is the average electron velocity, n is the electron density, Vi is the gas ionization potential, m is the electron mass, τ is the time response to create current changes, τi is the time between ionization collisions of electrons with gas atoms, η0 is the free space impedance, PD is the incident MMW/THz radiation power density on the detector, ν is the electron-neutral atom elastic collision frequency, ω is the electromagnetic radiation frequency, td is the average electron drift time to the anode, and νi is the ionization collision frequency. The dominant mechanism was found to be enhanced cascade ionization rather than diffusion current [13,14]; the enhanced cascade ionization mechanism increases the current while the diffusion current mechanism decreases it. Equation (1) is maximum when ω and ν are equal. Furthermore, it was found that the GDD is sensitive to the polarization of the incident MMW/THz radiation [7,15]. Some applications of MMW/THz require fast envelope detection. Examples of such applications include measuring the time of flight, radar detection, direct detection of short pulses, and real-time imaging. The response time of the plasma inside the GDD is on the order of picoseconds; however, the response time is limited by the electronic circuit to about 1 μs [16].

A new (to our knowledge) principle of detection and imaging using the miniature GDD is presented here in which we detect the change in the light emission from the GDD due to incident MMW/THz radiation rather than the change in its electrical current. By using the GDD for the conversion of MMW/THz radiation to the visual band, it is shown that the response time of the detection can be improved, since it is now mainly dependent on the visual detector response time rather than the GDD circuit. An advantage of this method is the elimination of the internal shot noise of the GDD components [12], which limits its sensitivity when measuring the change in its electrical current. Thus, the sensitivity and minimum detectable signal power using the upconverting (optical) method will improve the GDD sensitivity and simplify the detection signal compared to electronic detection. A method for microwave power distribution detection was published this year [17], using a one-dimensional array of arc discharge lamps that serves as an energy converter from microwave to visible light. The high-power microwave radiation can produce visible light in the lamps. The range of illumination in the lamps over the lamp array depends on the microwave intensity. Thus, the microwave distribution can be monitored by optical observation. Our work is in the MMW/THz band and shows the ability of our method to use GDDs as pixels in an imaging system. Another MMW imaging technique based on visible light emitted from the positive column of a Cs–Xe DC discharge was shown in Ref. [18]. In that technique, MMW radiation is incident toward a large, uniform positive column window and causes changes in the positive column light intensity. A charge-coupled device (CCD) camera is used to obtain the MMW pattern. The minimum detectable MMW power density of this system was found to be on the order of 1  W/cm2 for 35 GHz radiation, the response time of this technique was about 0.8 μs, and the spatial resolution for a time slot of 10 μm was 3 mm. For longer time slots the resolution is worse due to heat transfer of the plasma [18]. Our system is several orders of magnitude more sensitive than those two techniques that use high-power sources, as discussed later, and exhibits a better response time.

This paper presents the ability of our MMW/THz imaging system to obtain 3D images using upconversion. This ability was experimentally tested by performing detection, imaging, and frequency modulation continuous wave (FMCW) radar detection using a GDD and a photodetector.

2. EXPERIMENTAL SETUP AND RESULTS

2.1 A. Detection and Proof of Concept

In order to investigate the upconversion of MMW/THz radiation to visual light using GDD phenomena, we used a MMW/THz source based on multipliers from Virginia Diodes, Inc., that multiply a low-frequency source to 100 GHz. The 100 GHz source radiates to free space and, using a polyethylene (PE) lens, the MMW/THz radiation was focused on the GDD cross section between the electrodes. The experimental setup is given in Fig. 1. The 100 GHz signal was modulated with a 1 kHz square wave. This MMW/THz modulated signal was coupled to free space by a conical horn antenna, which produced an approximately fundamental mode Gaussian beam. An off-axis parabolic mirror (OPM) was used to collimate the MMW/THz Gaussian beam; that MMW/THz beam was focused by a PE lens on the GDD. A commercial green neon indicator lamp (N523, from International Light Technologies) was used in these experiments as a GDD. Changes in the GDD light are caused by the modulated MMW/THz signal incident on the GDD lamp. In order to detect the changes in the GDD’s illumination, we used a large-area balanced photodetector (model PDB210A/M, from Thorlabs) that was conveniently available. Note that a single silicon photodetector can be used as well for this experimental setup. The GDD’s light is directed toward the photodetector via optical lenses. In order to measure and record the detected signal, the output signal of the photodetector was connected directly to an oscilloscope without an external amplifier. The oscilloscope that was used was model DSO1012A from Agilent Technologies, with bandwidth of 100 MHz and max sample rate of 2 gigasamples (GSa)/s.

Fig. 1. Experimental setup of the upconversion detection: (a) schematic, (b) picture.

下载图片 查看所有图片

The detected optical intensity signal from the photodetector output for the upconversion detection using the N523 GDD is shown in Fig. 2. This signal was obtained under the following conditions: GDD bias current of 10 mA, square-wave modulation at 1 kHz, and MMW/THz frequency of 100 GHz. The detected signal from the photodetector output was measured to be 76 mV, as we can see in this figure. The GDD side configuration was used here instead of the head-on configuration for convenience. The sensitivity in the head-on configuration is about an order of magnitude better, because the plasma interaction depth is then about 1 cm, corresponding to the electrode length, rather than 1 mm, corresponding to the electrode thickness [7,8].

Fig. 2. Detected signal from the photodetector (signal A, 76 mV peak to peak) and modulation signal of the MMW/THz radiation (signal B) on the same time axis.

下载图片 查看所有图片

In order to find the best GDD lamp for the upconversion method, we tested many GDD lamps from different vendors. Several of them contained a phosphorous coating on the inner surface of the glass envelope, and several of them were without the phosphorous coating. The N523 was found to be the best one. This lamp has a phosphorous coating. Note that similar results were found for electronic detection [5].

Figure 3 shows a comparison between optical detection using the upconversion method and electronic detection without an amplifier. In this figure we can see that the responsivity of both detection methods varies with the DC bias current; also, it was found that the higher the DC current of the GDD, the better the responsivity of the system. This is attributed to an increase of the electron-neutral atom collision frequency with the bias current [12,19], thus increasing the MMW/THz radiation absorption via energy transfer to neutral atoms, where the MMW/THz energy adds to the electron kinetic energy and thereby excites or ionizes neutral atoms. This changes the de-excitation and recombination rates and therefore the illumination intensity of the GDD. Consequently, amplitude modulation of the MMW/THz radiation is required in order to distinguish between the signal light and bias light of the GDD. The signal light is modulated, while the bias light is not. AC coupling is used to separate this AC signal from the much stronger DC bias. The DC voltage was created as a result of the GDD light without MMW/THz radiation.
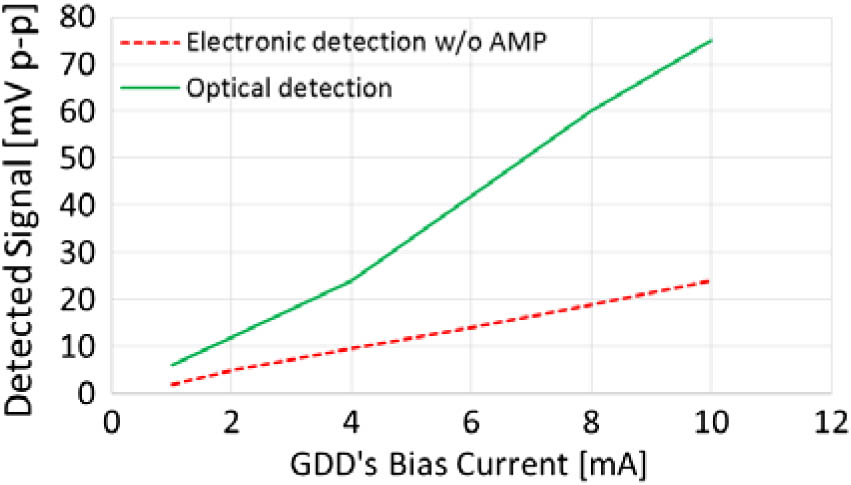
Fig. 3. Detected signal from the photodetector (solid line) and the detected signal from the electronic circuit without amplifier (dashed line) as a function of the GDD DC bias current.

下载图片 查看所有图片

The responsivity of the system was calculated by measuring the input MMW/THz power on the GDD cross section, as well as the output signal voltage from the photodetector. In order to measure and calculate the input MMW/THz power, we used an MMW/THz pyroelectric array camera from Spiricon to measure the beam diameter. The beam power was measured using an MMW/THz absolute power meter from Thomas Keating. The total MMW/THz radiation power incident on this cross section was calculated to be 800 μW. The detected signal from the photodetector output was measured to be 76 mV, which results in a responsivity of 95 V/W for the detection system at 100 GHz with a GDD bias current of 10 mA; for comparison, the detected signal from the electronic circuit (without an amplifier) was measured to be 25 mV, which results in a responsivity of 31 V/W for the electronic detection system at 100 GHz with the same GDD bias current. The optical upconversion was thus more responsive than the electronic detection.

The optical polarization sensitivity of the GDD using the upconversion method was investigated in side configuration [7]. The maximum detection value was obtained when the DC electric field was in the direction of the MMW/THz electric field. The minimum detection value was obtained when the fields were orthogonal to each other. The minimum detection value was 30% of the maximum detection value. This optical polarization sensitivity is similar to the electronic polarization sensitivity, as shown in previous works [7,15,20,21], and is in good agreement with Malus’s law. When MMW/THz frequencies are such that wavelength is on the order of electrode geometry dimensions, absorption by the plasma and noticeable responsivity increases can occur [21].

A calculation of the system noise-equivalent power (NEP) was carried out using NEP=VnR·B=Ps_minB,where Vn is the noise voltage, Ps_min is the minimum detected signal power in direct detection, B is the bandwidth, and R represents the responsivity of the detection system as described.

The noise levels of the detection system were measured with a spectrum analyzer from Agilent Technologies. The noise voltage was measured to be about 130  nV/Hz and is limited by the photodetector, which is much quieter than the plasma noise. The NEP of the system was calculated to be about 1.3  nW/Hz. The NEP using this method was almost an order of magnitude lower than the NEP in the electronic detection [16], which was measured to be about 10  nW/Hz when the incident EM wave illuminated the entire side of the GDD instead of the narrow “head.” The minimum detected signal power of our upconversion system was found to be about 1.3 μW (when multiplying the NEP with the square root of the photodetector bandwidth) according to Eq. (2). The minimum detectable MMW/THz power density of our upconversion system was found to be on the order of 1  μW/cm2 (when dividing the minimum detected signal power with the area of the detector) [10]. This is 6 orders of magnitude better than in Ref. [18].

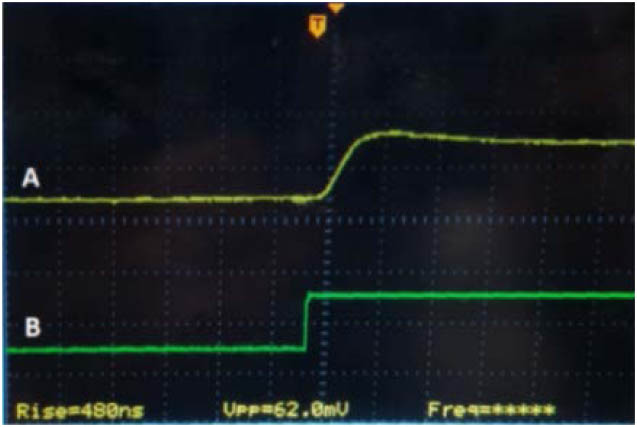
Figure 4 shows the response time that was measured in our system directly from the photodetector output. We can see from this figure that the response time was 480 ns. This response time result is limited due to the bandwidth of the optical PDB210A photodetector that was used in our setup, which affected the performance of the detection. Note that the oscilloscope, due to its parameters, doesn’t affect the rise time of the detection. Further improvement of the response time and sensitivity can be achieved using a faster and more sensitive optical detector.

Fig. 4. Detected signal from the photodetector (signal A) and modulation signal of the MMW/THz radiation (signal B). The response time of the detection using the PDB210A photodetector was found to be 480 ns.

下载图片 查看所有图片

2.2 B. Imaging Using Upconversion

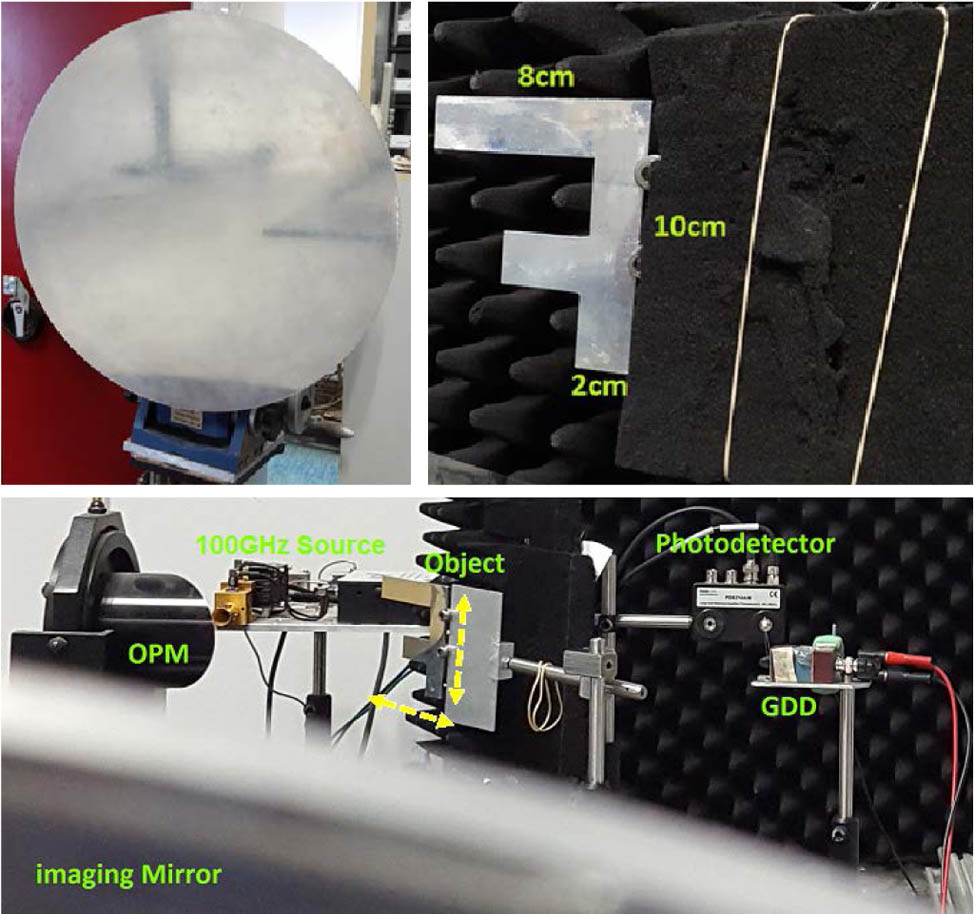
Figures 5 and 6 show the quasi-optical setup designed and built for imaging using the upconversion method at 100 GHz. This experimental setup includes a 100 GHz source that is incident on the object. The object is a metal plate in the shape of the letter F. The radiation reflected from the object is collected using the spherical mirror (imaging mirror), and the GDD lamp is placed in the image plane. The optical detector is placed close to the GDD in order to detect the change in the light intensity emitting from the GDD. The image was acquired by scanning the object horizontally and vertically in the object plane.
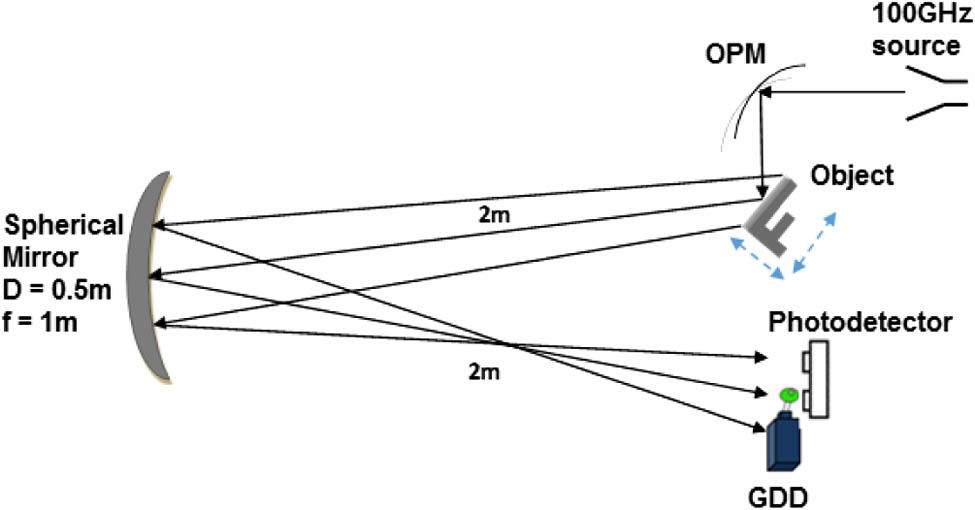
Fig. 5. Setup configuration for the upconversion imaging system using a GDD and photodetector.
下载图片 查看所有图片

Fig. 6. Pictures of the setup configuration for the upconversion imaging system using a GDD and photodetector, imaging mirror, and metal object with a size of 8  cm×10  cm and letter width of 2 cm.

下载图片 查看所有图片

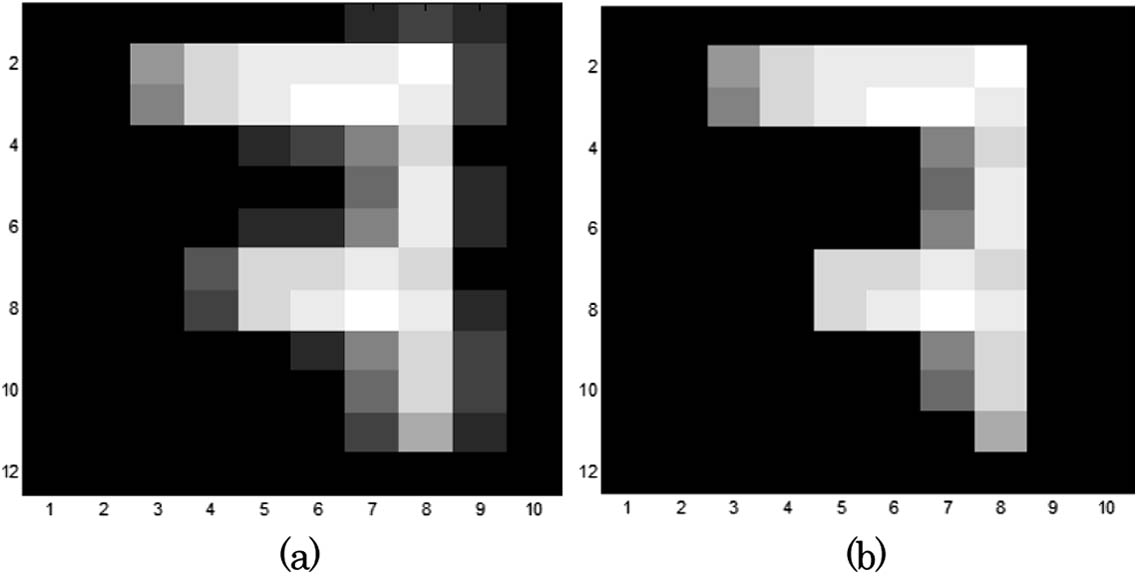
Figure 7 shows the upconversion imaging system results. In order to obtain a scan of the metal object, it was shifted 1 cm in each direction, horizontally and vertically, using a jack and a linear stage. According to our previous work, this interval of 1 cm is sufficient [22]. We shifted the object over a total range of 10 points horizontally and 12 points vertically; in that way the image of the object was scanned and acquired. Those results show the shape of the object very clearly and in the right dimensions. In order to reduce some low-intensity blur values, we performed a simple image processing to determine a threshold value by trial and error and zeroed all the pixels below it [22]. The resulting image is shown in Fig. 7(b). Until now we have considered upconversion to the visible range as a means to detect two-dimensional MMW/THz images. This derives from the intensity at each pixel. Now, we consider 3D images, where we add a target distance at each pixel.

Fig. 7. Imaging results: (a) the raw upconverted MMW/THz image, (b) the image after thresholding low values.

下载图片 查看所有图片

2.3 C. FMCW Detection Using Upconversion

FMCW radar systems employ frequency modulation at the signal source to enable propagation delay measurements for determination of the distance to the target or depth of an object in an imaging system. In order to realize FMCW radar, the signal source radiation is split into two beams. The first beam is incident toward the object and reflected back to the detector and is called the signal beam. The second beam is incident directly on the detector and is called the reference beam. Either the signal beam or the reference beam is frequency modulated (chirped), so that the time difference in propagation (Δt) for the two beams yields a beat frequency (fb). That frequency is constant and proportional to the distance from objects at each instant of image recording.

According to the beat frequency (fb), the distance/range (R) of an object can be calculated to be [23,24] fb=fSR·Δt=ΔfTs·Rc=>R=fb·Ts·cΔf,where fSR is the sweep rate (chirp slope), Δf is the full frequency swing (chirp bandwidth), R is the optical path difference (OPD) between the signal and the reference beams, Ts is the chirp sweep time, and c is the speed of light.

The depth resolution, designated as δR, can be calculated according to Eq. (3). Using the beat frequency resolution δfb, the minimum resolvable frequency deviation is δfb1Ts. Therefore, the depth resolution can be written as in Refs. [23,24]: δR=c2Δf,where δR is the minimum recognizable image depth (depth resolution). Therefore, the larger the frequency swing, the better the depth resolution that can be achieved. The GDD has been used in the past as an electronic mixer, where the difference frequency is detected in the electrical current of the GDD. Now, we wish to see if it also exists in the light intensity emitted by the GDD plasma lamps.

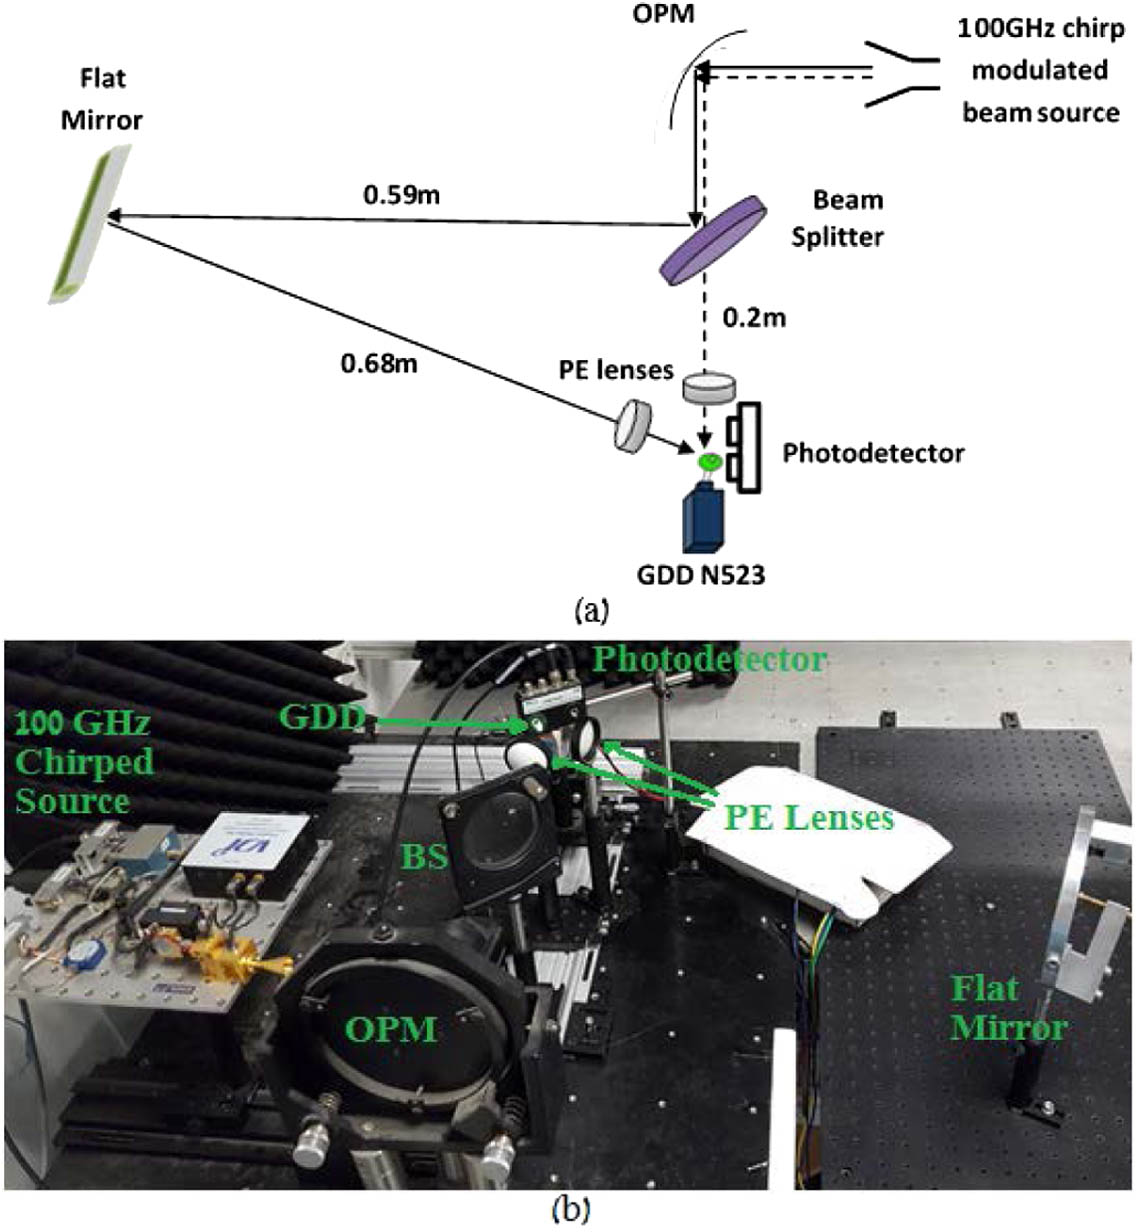
Figure 8 shows the setup designed for the optical feasibility of FMCW using a GDD and a photodetector in the MMW/THz bands. This experiment setup includes a 100 GHz chirped modulated beam that is incident on a wire-grid polarizer beam splitter (BS). The reference beam is transmitted through the BS and is focused onto the GDD that is placed in a side configuration using a PE lens. This path length is over a distance of 0.55 m and is marked as a dashed line. The signal beam is reflected by the BS toward the object, which is represented by a plane metal mirror. The beam reflected by the metal mirror is focused onto the GDD using a PE lens. This path length is over a distance of 1.62 m and is marked as a solid line. The OPD between the reference beam and the signal beam is 1.07 m. The optical detector PDB210A/M is placed close to the GDD in order to detect the change in the light intensity emitting from the GDD. As a result of heterodyne detection by the GDD, a difference frequency (the beat frequency—fb) is obtained that is proportional to the OPD of the two beams (R).

Fig. 8. Setup configuration for an optical FMCW experiment at 100 GHz using a photodetector and GDD lamp N523 in side configuration, connected to the detection electronic circuit and external amplifier.

下载图片 查看所有图片

In this experiment, according to our measurement conditions, the chirp bandwidth was about Δf=3  GHz at the output of the MMW/THz source, with a chirp sweep time Ts of 0.9 ms (the modulation signal is a 1 kHz saw-tooth signal with a duty cycle of 90%). These conditions provide a chirp rate of about fSR=3  MHz/μs, a beat frequency resolution of δfb=1  kHz, and an OPD resolution, for scenarios where there is no round trip path, of 0.1 m [the range resolution (δR), for scenarios where there is no round trip path, is 0.05 m].

In this experiment we measured the detected signal from the photodetector and that from the electronic circuit (with external amplifier) and compared them. Figure 9 shows the detected signal for the FMCW experiment shown in Fig. 8. The results are presented for the optical detection from the output of the photodetector in Fig. 9(a). The results are presented for the electronic detection from the amplifier output connected to the electronic circuit in Fig. 9(b). The yellow signal A is the detected signal, and the green signal B is the saw-tooth modulation signal serving as a trigger. We can see from this figure that the detected signals for both the optical and electronic cases are essentially identical. Furthermore, we can see that FMCW with miniature neon indicator lamps as GDD mixers thus works for both electronic heterodyne detection and upconversion optical heterodyne detection. Both detection processes derive from the excitation and resultant ionization collision processes between free electrons and neutral gas atoms. These lead to increased current as well as to de-excitation and recombination, which produce GDD light emission.
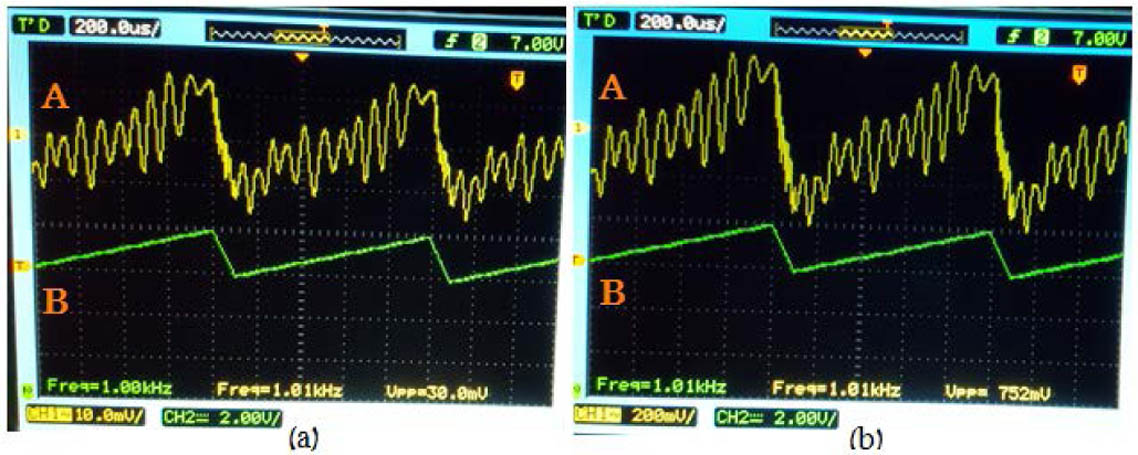
Fig. 9. Detected signal A and modulation signal B for the FMCW experiment: (a) upconversion optical heterodyne detection, (b) electronic heterodyne detection.

下载图片 查看所有图片

The raw data of the FMCW signal recorded by the oscilloscope was analyzed using a fast Fourier transform (FFT), which shows the frequency components of the detected signal. Figure 10 shows the FFT of the detected signal A for the FMCW experiment shown in Fig. 9. We use FFT to isolate the frequency component of fb from the detected signal. We can see that the beat frequency for both detection methods is 12.7 kHz according to the FFT. This frequency corresponds to an OPD of 1.143 m and is in excellent agreement with the OPD calculation made above and within the boundaries of the expected frequency and OPD resolutions. The other main frequency component shown in the FFT is the modulation signal frequency of about 1 kHz.
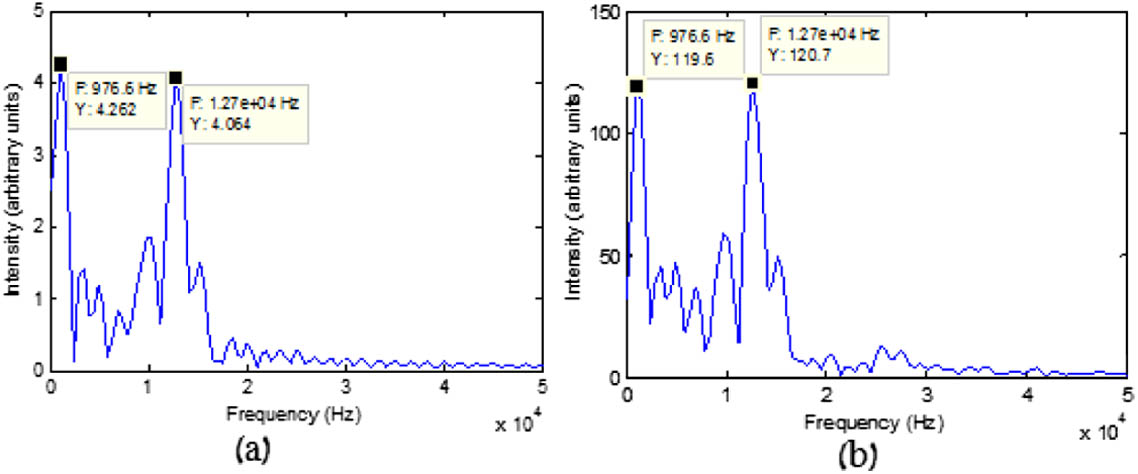
Fig. 10. FFT of the detected signal from the FMCW experiment: (a) upconversion optical heterodyne detection, (b) electronic heterodyne detection.

下载图片 查看所有图片

3. DISCUSSION AND CONCLUSIONS

The experimental results of this paper show that a system with a GDD and optical detector can serve for MMW/THz imaging. The results show improvement of the response time using the presented method compared to the electronic detection of the GDD. Furthermore, the NEP using this method was almost an order of magnitude lower than the NEP in the electronic detection, and the responsivity was 3 times better than in the electronic detection. The photodetector is much quieter than the high bias GDD. It was found that the upconversion method using the GDD is sensitive to the polarization of the incident MMW/THz radiation, similar to the electronic detection. The response time results that were shown in our work were limited due to the bandwidth of the optical detector, which affects the performance of the detection. Improvement of the upconversion system can be achieved by using better optical components and reducing the size of the optical system (to bring the optical detector closer to the GDD); further improvement of the response time and sensitivity can be achieved using a faster and more sensitive optical detector. Also, testing other GDD models using this method can result in finding better Ne miniature lamps for detection by this method rather than electronic detection.

One important application of the GDD is as a pixel in a MMW/THz FPA [25]. In this work we showed and proved the ability of this method to perform imaging using a GDD lamp and photodetector in a scanning system. We believe that based on the work presented in this paper we can use a CCD camera and a GDD FPA to perform imaging. The combination of a CCD camera and a GDD FPA can yield a faster, more sensitive, and very inexpensive MMW and THz camera, eliminating the complexity of the electronic circuits and the internal electronic noise of the GDD. By choosing lamps with smaller diameters, we can achieve better spatial resolution with an FPA. Comparison of our system to another imaging system using an upconversion method described before in Ref. [18] shows that the sensitivity of our imaging technique exceeds the other technique’s sensitivity by about 6 orders of magnitude (by comparing the minimum detectable signal power densities of both systems). Also, our system response time is about 2 times better than that of the other technique. This makes our upconversion system much better for MMW/THz imaging. A major difference between the large lamp in Ref. [18] and the miniature GDD lamps used here is the lamp dimensions. In our present case, the very small electrode separation (1  mm instead of 10 cm) gives rise to a DC bias electric field that is much larger than that in Ref. [18]. The resulting much higher excitation and ionization collision rates of signal electrons with neutral gas atoms give rise to internal signal amplification on the order of a million for these types of devices [12]. This can explain the 6 orders of magnitude responsivity improvement and NEP improvement observed here. For real-time miniature GDD imaging, where each miniature GDD serves as a pixel, an array of such GDDs is required. However, they are very inexpensive (half of a dollar each) compared to any other type of MMW/THz detector.

Furthermore, we succeeded in performing optical FMCW detection using a photodetector. The detected signal that was measured was consistent with theory. From the comparison of both detection methods we can see that the optical detection performed well and agreed with the electronic detection beat frequency. Using heterodyne and advanced detection methods, we can achieve better results with optical detection. The optically detected signal in this experiment can be enhanced by better positioning of the photodetector. These results indicate that upconversion of an MMW/THz image to the visible range using glow discharge miniature neon indicator lamps can be enhanced by FMCW techniques to obtain fast and sensitive 3D images.

In electronic detection, the input to the GDD is an electromagnetic wave, and the output is an electrical current. Therefore, limitations in response time in electronic detection derive from parasitic capacitance and inductance of the GDD. With upconversion, the output from the GDD is an optical wave rather than a current, so parasitic impedance is decoupled from the output, and the optical detection speed derives largely from the speed of the optical detector. Similarly, electronic detection sensitivity is largely limited by GDD plasma noise. With upconversion, this too is decoupled, and sensitivity is largely limited by optical detector noise, which is much less than plasma noise. In both cases, we are measuring detection properties of the upconversion system rather than those of the GDD device alone. Thus, both speed and sensitivity can be improved further by use of a detector or optical camera that is quieter and faster.

References

[1] B. M. Fischer, H. Helm, P. U. Jepsen. Chemical recognition with broadband THz spectroscopy. Proc. IEEE, 2007, 95: 1592-1604.

[2] A. Rogalski, F. Sizov. Terahertz detectors and focal plane arrays. Opto-Electron. Rev., 2011, 19: 346-404.

[3] F. Sizov. THz radiation sensors. Opto-Electron. Rev., 2009, 18: 10-36.

[4] P. H. Siegel. Terahertz technology. IEEE Trans. Microwave Theory Tech., 2002, 50: 910-928.

[5] A. Abramovich, N. S. Kopeika, D. Rozban, E. Farber. Inexpensive detector for terahertz imaging. Appl. Opt., 2007, 46: 7207-7211.

[6] D. Rozban, A. Abramovich, N. S. Kopeika, E. Farber. Terahertz detection mechanism of inexpensive sensitive glow discharge detector. J. Appl. Phys., 2008, 103: 093306.

[7] A. Abramovich, N. S. Kopeika, D. Rozban. THz polarization effects on detection responsivity of glow discharge detectors (GDD). IEEE Sens. J., 2009, 9: 1181-1184.

[8] D. Rozban, A. Levanon, H. Joseph, A. Aharon (Akram), A. Abramovich, N. S. Kopeika, Y. Yitzhaky, A. Belenky, O. Yadid-Pecht. Inexpensive THz focal plane array imaging using neon indicator lamps as detectors. IEEE Sens. J., 2011, 11: 1962-1968.

[9] D. Rozban, A. Aharon (Akram), N. S. Kopeika, A. Abramovich. W-band chirp radar mock-up using a glow discharge detector. IEEE Sens. J., 2013, 13: 139-145.

[10] A. Aharon (Akram), D. Rozban, N. S. Kopeika, A. Abramovich. Heterodyne detection at 300  GHz using neon indicator lamp glow discharge detector. Appl. Opt., 2013, 52: 4077-4082.

[11] L. Hou, W. Shi. Fast terahertz continuous-wave detector based on weakly ionized plasma. IEEE Electron. Device Lett., 2012, 33: 1583-1585.

[12] N. S. Kopeika. Glow discharge detection of long wavelength electromagnetic radiation: cascade ionization process internal signal gain and temporal and spectral response properties. IEEE Trans. Plasma Sci., 1978, PS-6: 139-157.

[13] A. Abramovich, N. S. Kopeika, D. Rozban, E. Farber. Terahertz detection mechanism of in expensive sensitive glow discharge detector. Appl. Phys., 2008, 103: 093306.

[14] N. S. Kopeika. On the mechanism of glow discharge detection of microwave and millimeter wave radiation. Proc. IEEE, 1975, 63: 981-982.

[15] T. Takan, N. Alasgarzade, I. U. Uzun-Kaymak, A. B. Sahin, H. Altan. Detection of far-infrared radiation using glow discharge detectors. Opt. Quantum Electron., 2016, 48: 292.

[16] D. Rozban, A. Aharon (Akram), A. Levanon, A. Abramovich, N. S. Kopeika. Switching and fast operation of glow discharge detector for millimeter wave focal plane array imaging systems. IEEE Sens. J., 2015, 15: 6659-6663.

[17] Z. Ji, W. Ding, S. Yang, Q. Chen, D. Xing. Remote measurement of microwave distribution based on optical detection. Appl. Phys. Lett., 2016, 108: 014104.

[18] M. S. Gitlin, V. V. Golovanov, A. G. Spivakov, A. I. Tsvetkov, V. V. Zelenogorskiy. Time-resolved imaging of millimeter waves using visible continuum from the positive column of a Cs-Xe dc discharge. J. Appl. Phys., 2010, 107: 063301.

[19] N. S. Kopeika, N. H. Farhat. Video detection of millimeter waves with glow discharge tubes: part I—physical description; part II—experimental results. IEEE Trans. Electron. Devices, 1975, ED-22: 534-548.

[20] A. Aharon (Akram), D. Rozban, N. Banay, A. Abramovich, N. S. Kopeika, A. Levanon. Polarization effects on heterodyne detection and imaging using glow discharge detector at millimeter wavelengths. Proc. SPIE, 2014, 9078: 90780F.

[21] K. Cinar, H. M. Bozaci, H. Altan. Characterization of a glow discharge detector with terahertz time domain spectroscopy. IEEE Sens. J., 2013, 13: 2643-2647.

[22] M. Shilemay, D. Rozban, A. Levanon, Y. Yitzhaky, N. S. Kopeika, O. Yadid-Pecht, A. Abramovich. Performance quantification of a millimeter-wavelength imaging system based on inexpensive glow-discharge-detector focal-plane array. Appl. Opt., 2013, 52: C43-C49.

[23] SkolnikM., Radar Handbook (McGraw-Hill, 1964), Chap. 1–3, pp. 1564.

[24] Aharon (Akram)A.RozbanD.AbramovichA.YitzhakyY.KopeikaN. S., “Terahertz frequency modulated continuous wave radar using glow discharge detector,” IEEE Sens. J.16 (2016).

[25] A. Abramovich, N. S. Kopeika, D. Rozban. Design of inexpensive diffraction limited focal plane arrays for mm wavelength and THz radiation using glow discharge detector pixels. Appl. Phys., 2008, 104: 033302.

Avihai Aharon (Akram), Daniel Rozban, Avi Klein, Amir Abramovich, Yitzhak Yitzhaky, Natan S. Kopeika. Detection and upconversion of three-dimensional MMW/THz images to the visible[J]. Photonics Research, 2016, 4(6): 06000306.

本文已被 2 篇论文引用
被引统计数据来源于中国光学期刊网
引用该论文: TXT   |   EndNote

相关论文

加载中...

关于本站 Cookie 的使用提示

中国光学期刊网使用基于 cookie 的技术来更好地为您提供各项服务,点击此处了解我们的隐私策略。 如您需继续使用本网站,请您授权我们使用本地 cookie 来保存部分信息。
全站搜索
您最值得信赖的光电行业旗舰网络服务平台!