中国激光, 2019, 46 (8): 0806006, 网络出版: 2019-08-13
基于光热效应的单光纤捕获方法与仿真分析  下载: 1280次
Photothermal Effect Based Single Fiber Trapping Method and Simulation Analysis
图 & 表
图 1. 基于光热效应的颗粒捕获实验装置图
Fig. 1. Experimental setup for particle capture based on photothermal effect
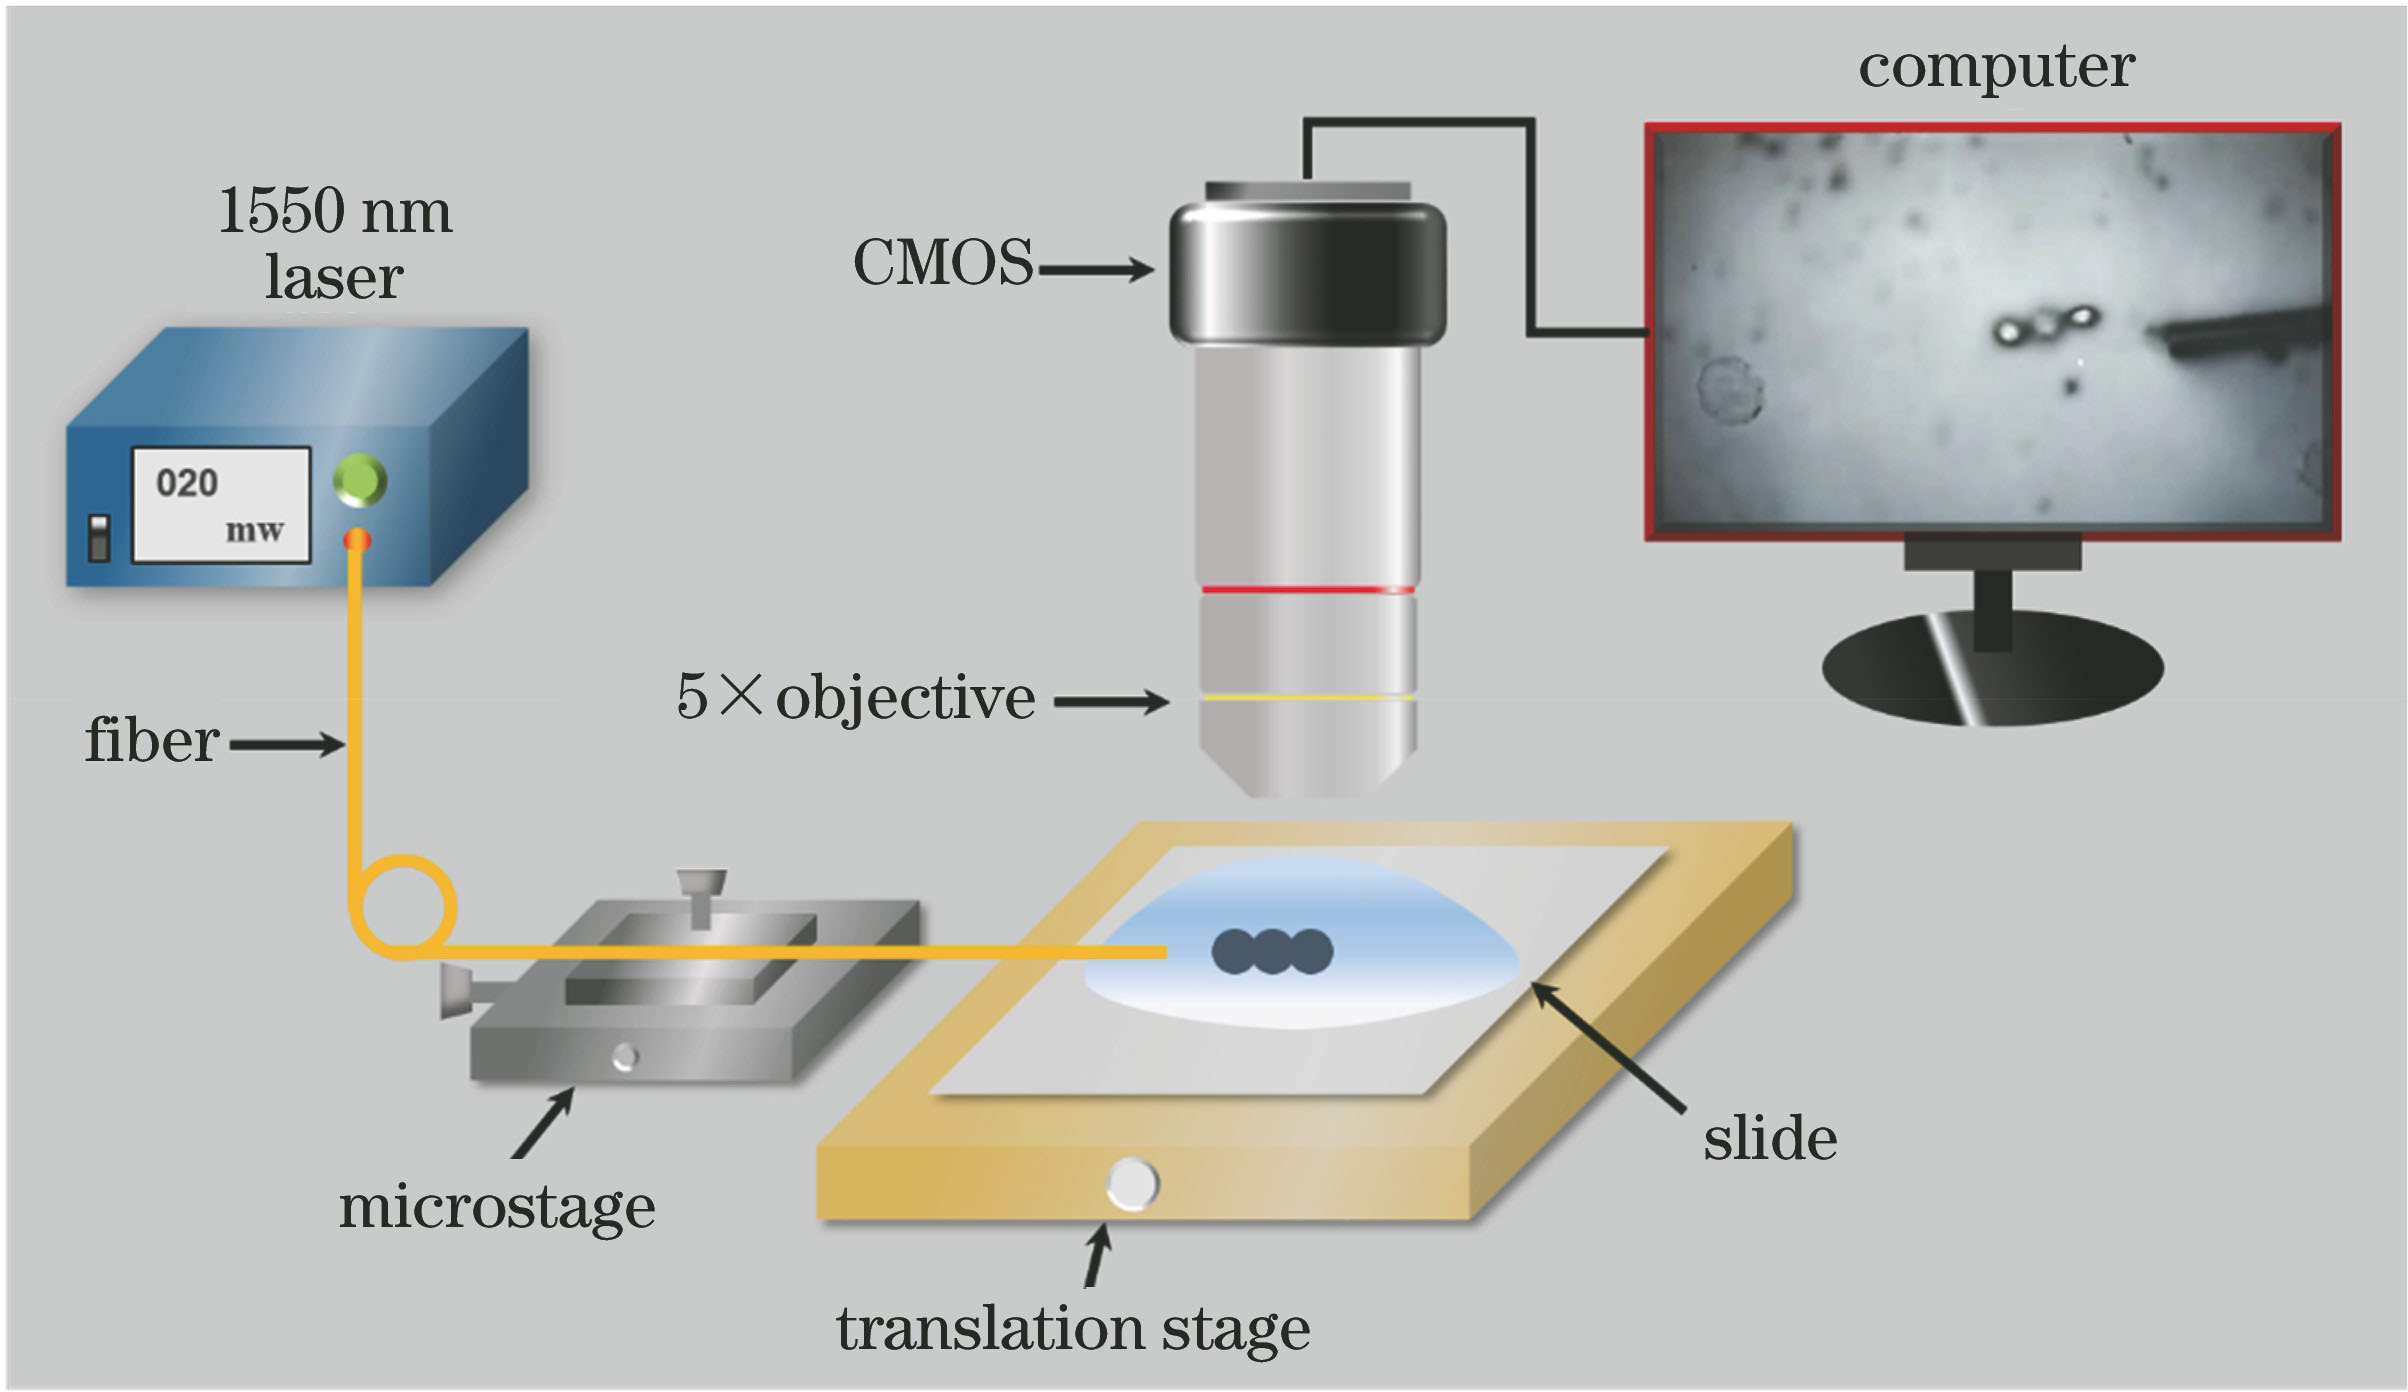
图 2. 基于热对流效应的光纤操纵SiO2小球过程示意图。(a)光纤静止;(b)光纤沿z轴移动;(c)光纤沿y轴移动;(d)光纤沿x轴移动
Fig. 2. Diagrams of optical manipulation for SiO2 sphere based on thermal convection effect. (a) Fiber being stationary; (b) fiber moving along z axis; (c) fiber moving along y axis; (d) fiber moving along x axis

图 3. 光纤上下移动操控SiO2小球横向移动过程的光学显微镜图像(俯视图)。(a) t=0 s,光纤位于z=500 μm;(b) t=3.2 s,光纤位于z=300 μm;(c) t=5.8 s,光纤位于z=150 μm;(d) t=6.1 s,光纤位于z=80 μm;(e) t=9.6 s,光纤位于z=350 μm;(f) t=11.3 s,光纤位于z=550 μm
Fig. 3. Optical microscope images of lateral movement of SiO2 sphere by vertical movement of fiber (top view). (a) t=0 s, fiber is located at z=500 μm; (b) t=3.2 s, fiber is located at z=300 μm; (c) t=5.8 s, fiber is located at z=150 μm; (d) t=6.1 s, fiber is located at z=80 μm; (e) t=9.6 s, fiber is located at z=350 μm; (f) t=11.3 s, fiber is located at z=550 μm

图 4. 光纤在不同高度位置处的温度场和对流速度场的仿真结果。(a)光纤位于z=50 μm处的温度场分布;(b) z=550 μm处的温度场分布;(c)光纤位于z=50 μm处的对流速度场分布;(d)光纤位于z=550 μm处的对流速度场分布
Fig. 4. Simulation results of heat transfer field (HT) and convective velocity field (FM) at different heights of fiber. (a) Temperature field distribution of fiber at z=50 μm; (b) temperature field distribution of fiber at z=550 μm; (c) convective velocity field distribution of fiber at z=50 μm; (d) convective velocity field distribution of fiber at z=550 μm

图 5. 光纤位于z=50 μm处SiO2小球在不同时刻的运动轨迹图。(a) t=1.2 s;(b) t=4.3 s;(c) t=8.2 s;(d) t=12.7 s
Fig. 5. Trajectories of silica sphere at z=50 μm at different times. (a) t=1.2 s; (b) t=4.3 s; (c) t=8.2 s; (d) t=12.7 s

图 6. 光纤位于z=550 μm处SiO2小球在不同时刻的运动轨迹图。(a) t=1.2 s;(b) t=8.1 s;(c) t=16.5 s;(d) t=23.3 s
Fig. 6. Trajectories of silica sphere at z=550 μm at different time. (a) t=1.2 s; (b) t=8.1 s; (c) t=16.5 s; (d) t=23.3 s

图 7. 光纤的电磁场(EM)分布以及SiO2小球所受光阱力分布。(a)光纤在悬浮液中的EM分布;(b) SiO2小球呈链状结构时的EM分布;(c) SiO2小球所受的轴向光阱力分布;(d) SiO2小球所受的横向光阱力分布
Fig. 7. Electromagnetic field (EM) distributions of fiber and optical trapping force distributions of SiO2 sphere. (a) EM distribution of optical fiber in suspension; (b) EM distribution of SiO2 sphere with chain structure; (c) axial optical force distribution of SiO2 sphere; (d) transverse optical force distribution of SiO2 sphere

杨敏君, 湛位, 宋五洲. 基于光热效应的单光纤捕获方法与仿真分析[J]. 中国激光, 2019, 46(8): 0806006. Minjun Yang, Wei Zhan, Wuzhou Song. Photothermal Effect Based Single Fiber Trapping Method and Simulation Analysis[J]. Chinese Journal of Lasers, 2019, 46(8): 0806006.


 PDF全文
PDF全文

