Chinese Optics Letters, 2017, 15 (5): 051101, Published Online: Jul. 23, 2018
Automated segmentation and quantitative study of retinal pigment epithelium cells for photoacoustic microscopy imaging  Download: 948次
Figures & Tables
Fig. 1. Schematic of the PAM system. PC1 and PC2, personal computer for scanning control and data acquisition; BS, beam splitter; PD, photodiode; FP1 and FP2, FiberPort for coupling or collimating; SMF, single mode fiber; 2D GM, two-dimensional galvanometer; SL, scan lens; TL, tube lens; OL, objective lens; UT, ultrasonic transducer; M1 and M2, mirror.
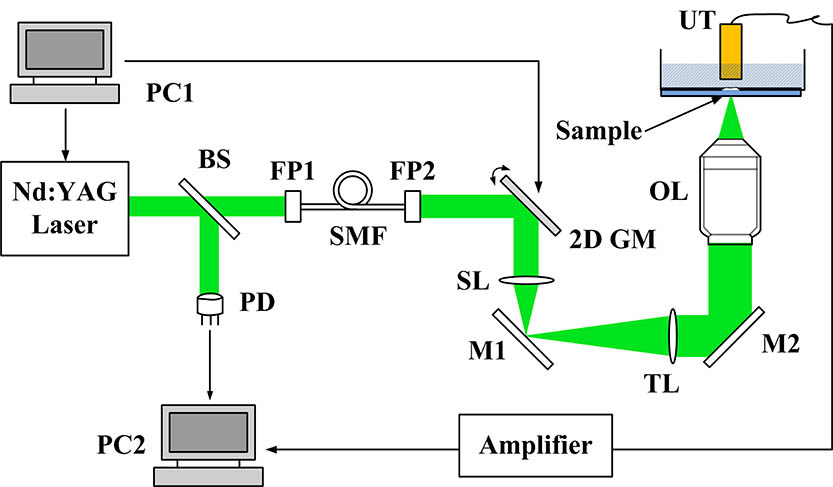
Fig. 2. Flow diagram of automatic RPE cell segmentation with the improved region growing method.

Fig. 3. Seed point distribution for segmentation. (a) Initial distribution of seed points shown as the red points, the dashed box is the defined square region for redistribution of the seed point in the center of the box, and the blue point is the transferred seed point after redistribution. (b) Redistributed seed points of the same region in (a) shown as the blue points. Bar: 10 μm.

Fig. 4. RPE cell segmentation with improved region growing method. (a), (e) PAM images of different RPE cells with red arrows pointing to the selected cells for segmentation. (b), (f) Intermediate results of the segmentation method with the MBRs shown as the red boxes. (c), (g) Final segmented results with MBRs. (d), (h) Superposed images of the segmented regions and original imaging results. Bar: 10 μm.

Fig. 5. Cell segmentation for numerical phantom images of simulated RPE cells. (a) Initial phantom image with a value of one within the cell region and zero within the intercellular region. (b) Typical acquired PAM signal amplitude profile of RPE cells along five adjacent cells and simulated signal amplitude profiles along the red line in (a) under the SNRs of 12, 5, and 3 dB, respectively. (c), (e) Phantom MAP images of simulated RPE cells under 5 and 3 dB SNRs. (d), (f) cell segmentation results for phantom images of (c) and (e), respectively. (g), (h) Statistical results of the cell number and area under a changing SNR from 6 to 2 dB.

Fig. 6. PAM imaging of RPE and quantitative results of RPE cells. (a) MAP image of RPE cells. (b) Segmented result of all the complete cells in (a). (c) Statistical result of cell area for all cells in (b). (d) Correlation between the cell area and intensity with the fitted results shown as the red and blue lines. Bar: 15 μm.

Lin Li, Qian Li, Cuixia Dai, Qingliang Zhao, Tianhao Yu, Xinyu Chai, Chuanqing Zhou. Automated segmentation and quantitative study of retinal pigment epithelium cells for photoacoustic microscopy imaging[J]. Chinese Optics Letters, 2017, 15(5): 051101.


 PDF全文
PDF全文

