Chinese Optics Letters, 2020, 18 (11): 113401, Published Online: Sep. 29, 2020   

High efficiency X-ray diffraction diagnostic spectrometer with multi-curvature bent crystal Download: 653次

Author Affiliations
1 Key Laboratory of Optoelectronic Technology and Systems of the Ministry of Education, Chongqing University, Chongqing 400044, China
2 College of Optoelectronic Engineering, Chongqing University of Posts and Telecommunications, Chongqing 400065, China
3 Research Center of Laser Fusion, China Academy of Engineering Physics, Mianyang 621900, China
Abstract
In spectral diagnostic physics experiments of inertial confinement fusion, the spectral signal is weak due to the low diffraction efficiency when using bent crystals. A spectral diagnostic instrument with high efficiency and wide spectral range is urgently needed. A multi-curvature bent crystal with multi-energy focusing ability is proposed based on the traditional conical crystal geometry. It has advantages of wide spectral range, strong focusing ability, and high spectral resolution. It also can eliminate the imaging aberration in principle due to rotational symmetry for the incoming X rays. A spectral diagnostic experiment based on a fabricated multi-curvature α-quartz crystal was accomplished using a titanium X-ray tube of the bent crystal, and the corresponding experimental data using a plane α-quartz crystal was also acquired to demonstrate the strong focusing ability. The result shows that the Kα intensity of the multi-curvature α-quartz crystal is 157 times greater than that of the plane crystal, and the corresponding energy range is about 4.51–5.14 keV. This diagnostic instrument could be combined with a streak camera at a vertical direction so as to intensify the diffracted X-ray signal with a wide spectral range.

Imaging diagnosis of plasma blast targets and the corresponding spectrum detection play important roles in inertial confinement fusion (ICF) experiments. In the detection of the X-ray energy spectrum, crystals are often used as spectroscopic components because the lattice parameter of crystals is of the same order of magnitude as the wavelength of X rays[15" target="_self" style="display: inline;">5]. Crystal spectrometers, which are used to detect diffracted signals and perform imaging diagnostics, have evolved from the planar crystal structure to the common curved crystal structure[6].

The main feature of the curved crystal spectrometer is the bent diffractive crystal surface, which has a smooth cylindrical or spherical shape. Hence, the intensity of the diffracted X ray is much higher than that of the planar crystal spectrometer. Johann, Johansson, and Hamos are three most commonly used crystal spectrometers using bent crystal[79" target="_self" style="display: inline;">–9]. In the Johann-type crystal spectrometer, the reflecting surface of the crystal is a cylindrical surface with a radius of curvature R. The curved crystal satisfies the tangent to the Rowland circle, which has a radius of R/2. When the source is on the Rowland circle, the reflected X ray will be focused on the Rowland circle. Although the Johann-type curved crystal spectrometer could achieve high resolution and high X-ray intensity with a simple geometry set, the geometric defocusing also happens. The Johansson-type curved crystal spectrometer is improved from the Johann-type spectrometer. The curved crystal with a radius of curvature R can be fabricated to match the Rowland circle with the radius R/2, which eliminates geometric defocusing of the Johann-type device. In the Hamos-type crystal spectrometer, the diffractive surface of the crystal is also a cylindrical surface. However, the X-ray source and the detector are both on the axis of the cylinder, of which the setup is different from the Johansson spectrometer. As a result, any given wavelength X rays can be reflected and focused to a point after being diffracted by the crystal[10]. However, this type of spectrometer, which was adapted to the diagnostic experiment of the high power laser facilities, provides only limited diagnostic arrangement with the streak camera because the imaging plane was only focusing on the cylindrical axis. This Letter presents a more flexible multi-curvature crystal spectrometer with wider spectral range and higher spectral resolution. The corresponding imaging plane could be perpendicular to the optical axis of the crystal.

For the purpose of diagnosing the critical parameters of the plasma based on spectral characteristics of X rays, it is necessary to incorporate tracer materials in the target ablation or the combustion zone in fusion diagnostic experiments. Generally, the amount of the tracer material should be as small as possible and the range of the X-ray energy spectrum that can be detected should be as wide as possible. As a result, an X-ray diagnostic instrument with wide spectral range and strong focusing ability is needed. In the Hamos crystal spectrometer, X rays of several characteristic energies can be focused on the central axis, and the energy band width increases with increasing crystal length. In addition, when X rays are projected on the cylindrical surface of the Hamos spectrometer, all X rays can be focused. This focusing geometry gives high spectrometer efficiency. Therefore, the Hamos spectrometer has been extensively developed in high temperature plasma diagnosis[11,12]. However, in the X-ray spectral detection of the laser plasma, the Hamos structure is not suitable for the time-resolved diagnostic experiment using the coupled streak camera. The reason is that the streak camera has strong mechanical constraints because of the large size. When a bent crystal is coupled with the streak camera, the blocking of the laser beam and spatial interference limit the arrangement of other diagnostic instruments. It can only be fixed when the spectrum is recorded in the plane perpendicular to the central axis of the cylinder. Although the vertical placement of the detector in the Hamos structure has advantages, only one X-ray spectral line in this case could be focused at a point on the central axis of the cylinder. The other spectral lines, which are deviations from the symmetry axis, give a set of concentric arcs. This defocusing effect decreases the spatial resolution and the intensity of the focusing spectrum[13].

In order to obtain spatially focused spectral images on the plane that is perpendicular to the optical axis, Hall proposed a focusing structure based on the Hamos structure by bending the crystal to a conical surface rather than a cylindrical surface[14]. As shown in Fig. 1, the crystal surface is part of a conical surface, in which diffraction occurs in the direction of the optical axis (X axis). The conical surface focuses the beam onto the axis of the apex of the cone. The imaging plane, which is parallel to the Y–Z plane, passes through the apex of the cone. The conical spectrometer functions in the way of a locally off-axis cylindrical spectrometer. It is obvious that the cylindrical radius is smaller, as the corresponding conical ring gets closer to the image plane (IP).

Fig. 1. Principle diagram of the conical crystal spectrometer.

下载图片 查看所有图片

For a conical spectrometer structure, the radius of the off-axis cylinder is not equal to the local radius of the cone. When using a paraxial approximation for off-axis X rays, two issues can be found in a conical spectrometer. The spherical aberration deteriorates the focusing performance due to the image broadening in the lateral direction. Meanwhile, X rays with the same energy will be defocused on the IP, and the spectral resolution will also deteriorate. Therefore, the paraxial approximation for off-axis X rays has less influence when using the limited width crystal under the condition that a certain spectral range is given.

The conical structure proposed by Hall cannot achieve perfect imaging without aberration. In this conical structure, the rays involved in imaging have non-rotational symmetry in theory, so this structure can only reduce certain aberrations[1517" target="_self" style="display: inline;">–17]. This Letter presents a more flexible crystal spectrometer with a multi-curvature surface, which can eliminate the aberration of the X-ray imaging. The analysis of its principle is shown in Fig. 2, where point O is the origin of coordinates, the source S is located on the Z axis, NB is located on the detector plane, which is parallel to the Z axis, and M is the midpoint of ON. The X rays are emitted from point S and reflected at point M. The reflected rays are focused at point B on the detector plane. Under the condition SR=RB, then RM is perpendicular to SB, and the angle between incident ray SM and the reflecting surface is the Bragg angle. There could be an imaginary circle when the R point is placed as the center of the circle, and RM is the corresponding radius. The imaginary circle can be regarded as a cylinder with a very low height Δt. It can be easily proved that all of the X rays, which are emitted from point S and are reflected from the inner surface of the imaginary cylinder, can be focused at point B. In other words, the rays involved in the imaging have rotational symmetry in theory.

Fig. 2. Principle diagram of the multi-curvature analyzer.

下载图片 查看所有图片

Under the geometry condition that the distance between the source and detector plane is unchanged, and another reflection point M1 is located on the left of the previous point M, an imaginary Conical Ring 1 can also be obtained when the R1 point is regarded as the center of the circle, and R1M1 is the corresponding radius. Therefore, all of the rays are emitted from point S and are also diffracted by the inner surface of Conical Ring 1. The deliberate adjustment of the R1M1 length and the angle between R1M1 and the X axis can make all of the rays focus at point B1, which is located on the same imaging plane as the previous focal point B. A similar geometry can be found when reflection point M2 is located on the right of midpoint M, and there is also focal point B2 on the same detector plane. It can be considered that there are infinite conical rings, which are tangent with the X axis along the X direction. Hence, a multi-curvature crystal could be fabricated, whose surface consists of the curvatures that coincide with these conical rings. In this multi-curvature configuration, focal points for different energies X rays are all located on the same detector plane. In other words, this multi-curvature spectrometer not only focuses X rays with different energies to the points on the same plane, but also spreads out the focal points of different energies along the same line.

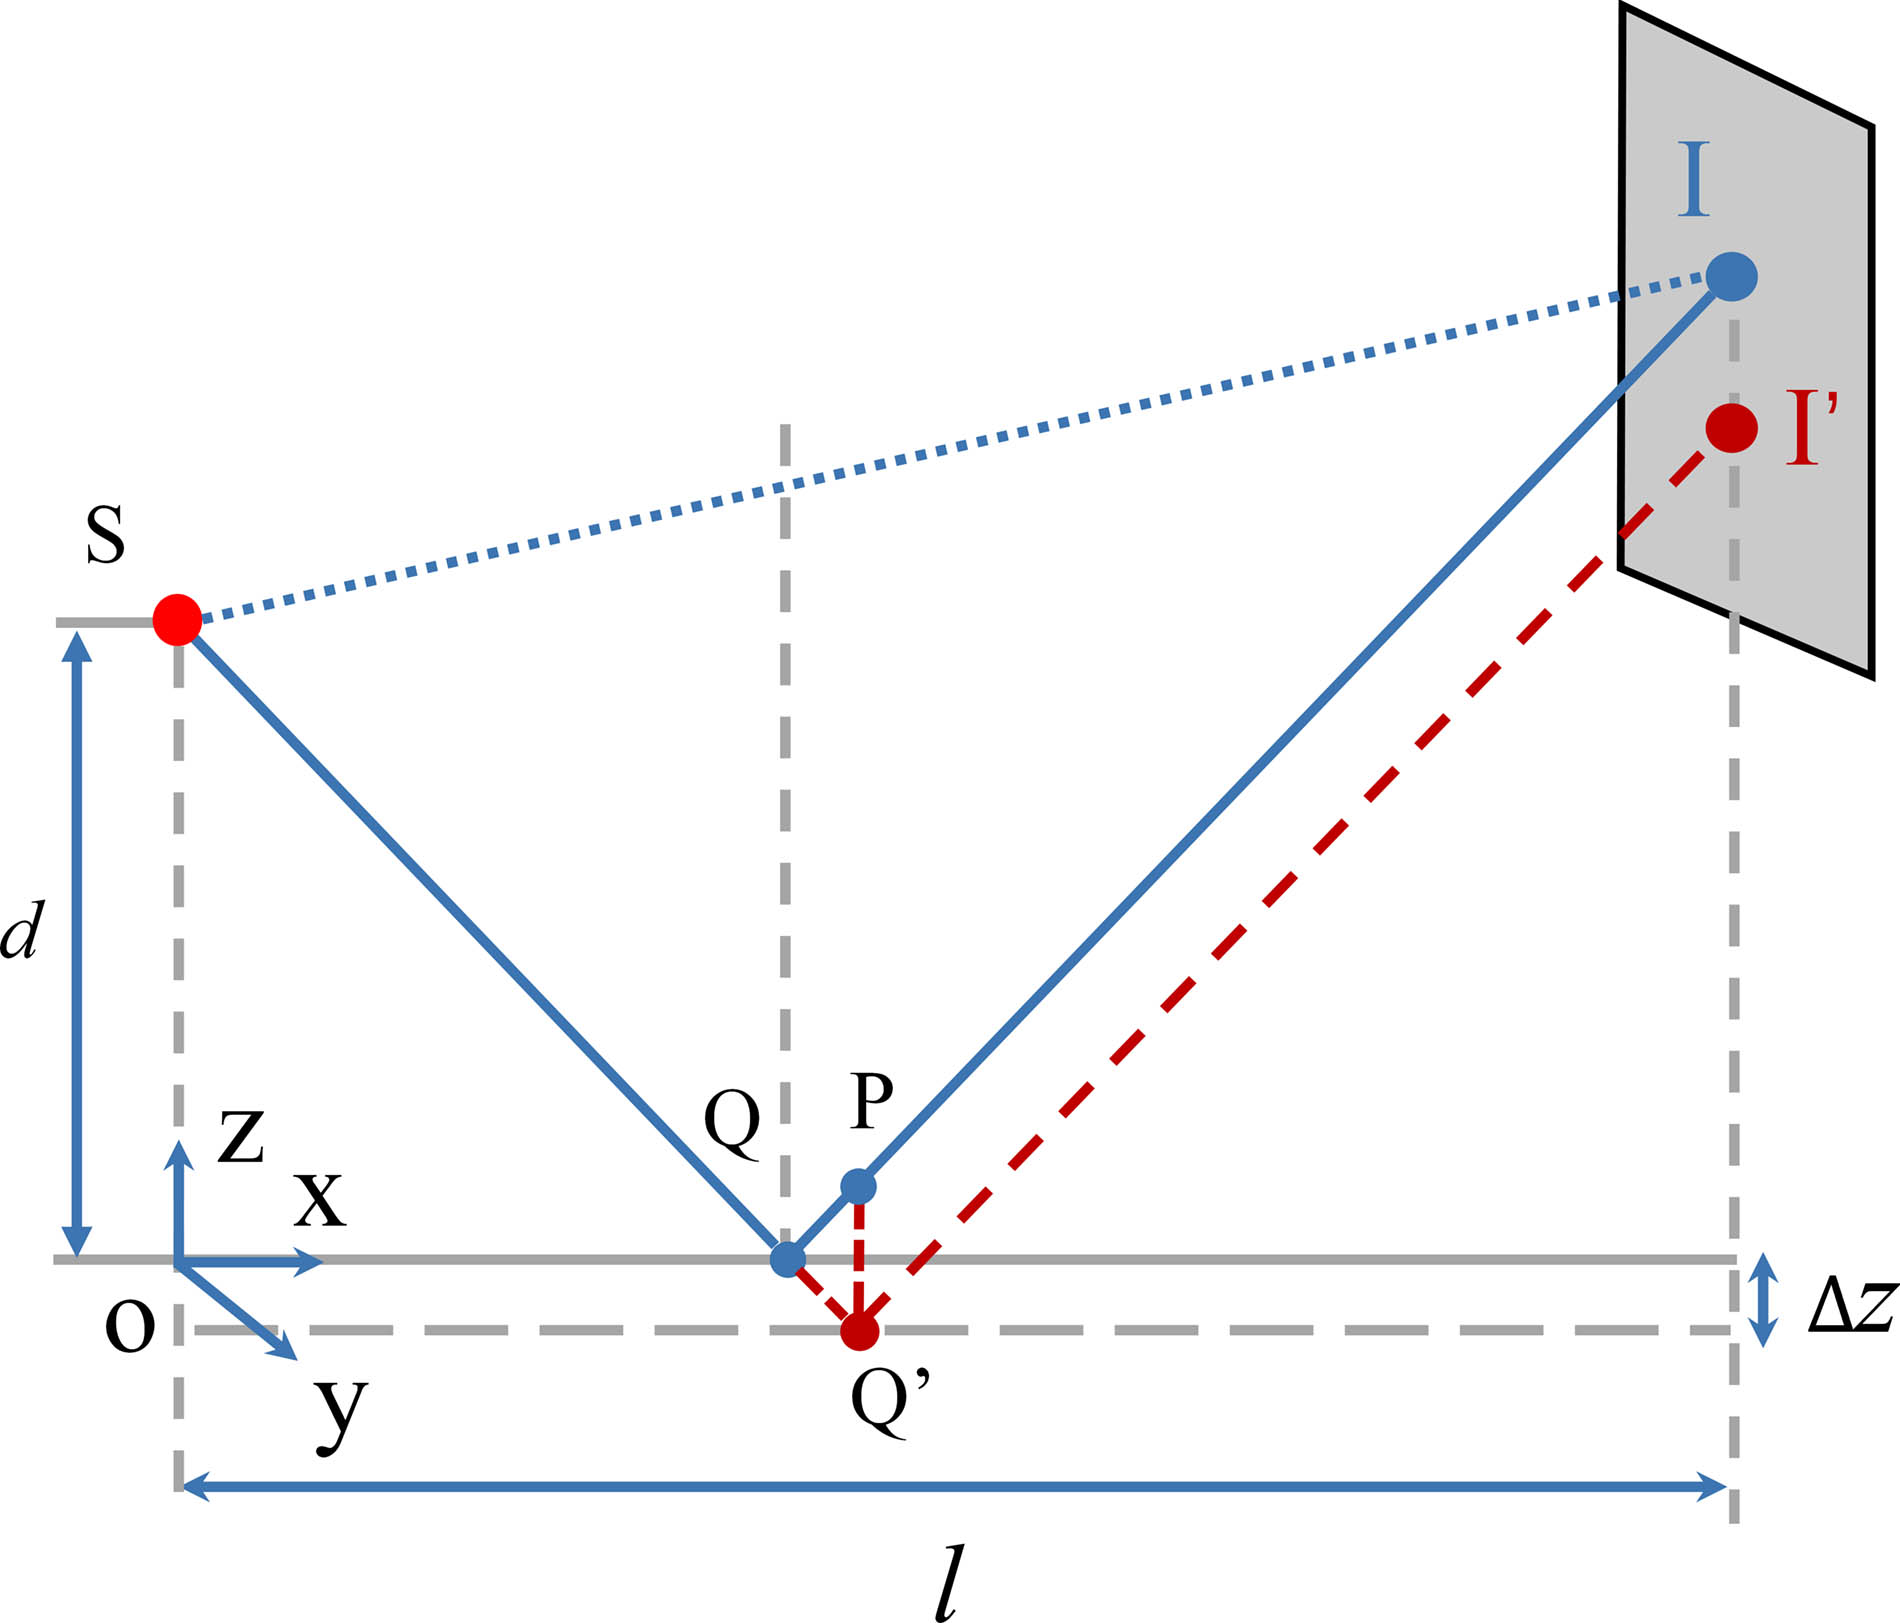
Ideally, all of the rays emitted from source S with the same Bragg diffraction angle will focus on the same point after being diffracted by a multi-curvature crystal. However, it is hard to get an ideal surface by using any possible crystal fabrication technology. The multi-curvature surface always has the surface-shape error due to the deviation, which was introduced in the crystal manufacturing process and the surface post-processing. The analysis of diffraction under certain surface error conditions is shown in Fig. 3. Point Q is the theoretical reflection point on the X axis, and Q is the actual reflection point, which is assumed to be below point Q. When point Q has an offset of Δz along the z axis, the X-ray path will change from the original lines SQI to SQI. Simultaneously, the focal point on the imaging plane will be changed from point I to point I. Moreover, the geometry relation II=QP=2Δz can be found under this condition, which means the offset of the focal point I is 2Δz.

Fig. 3. X-ray path in the XOZ plane with deviation of reflection point.

下载图片 查看所有图片

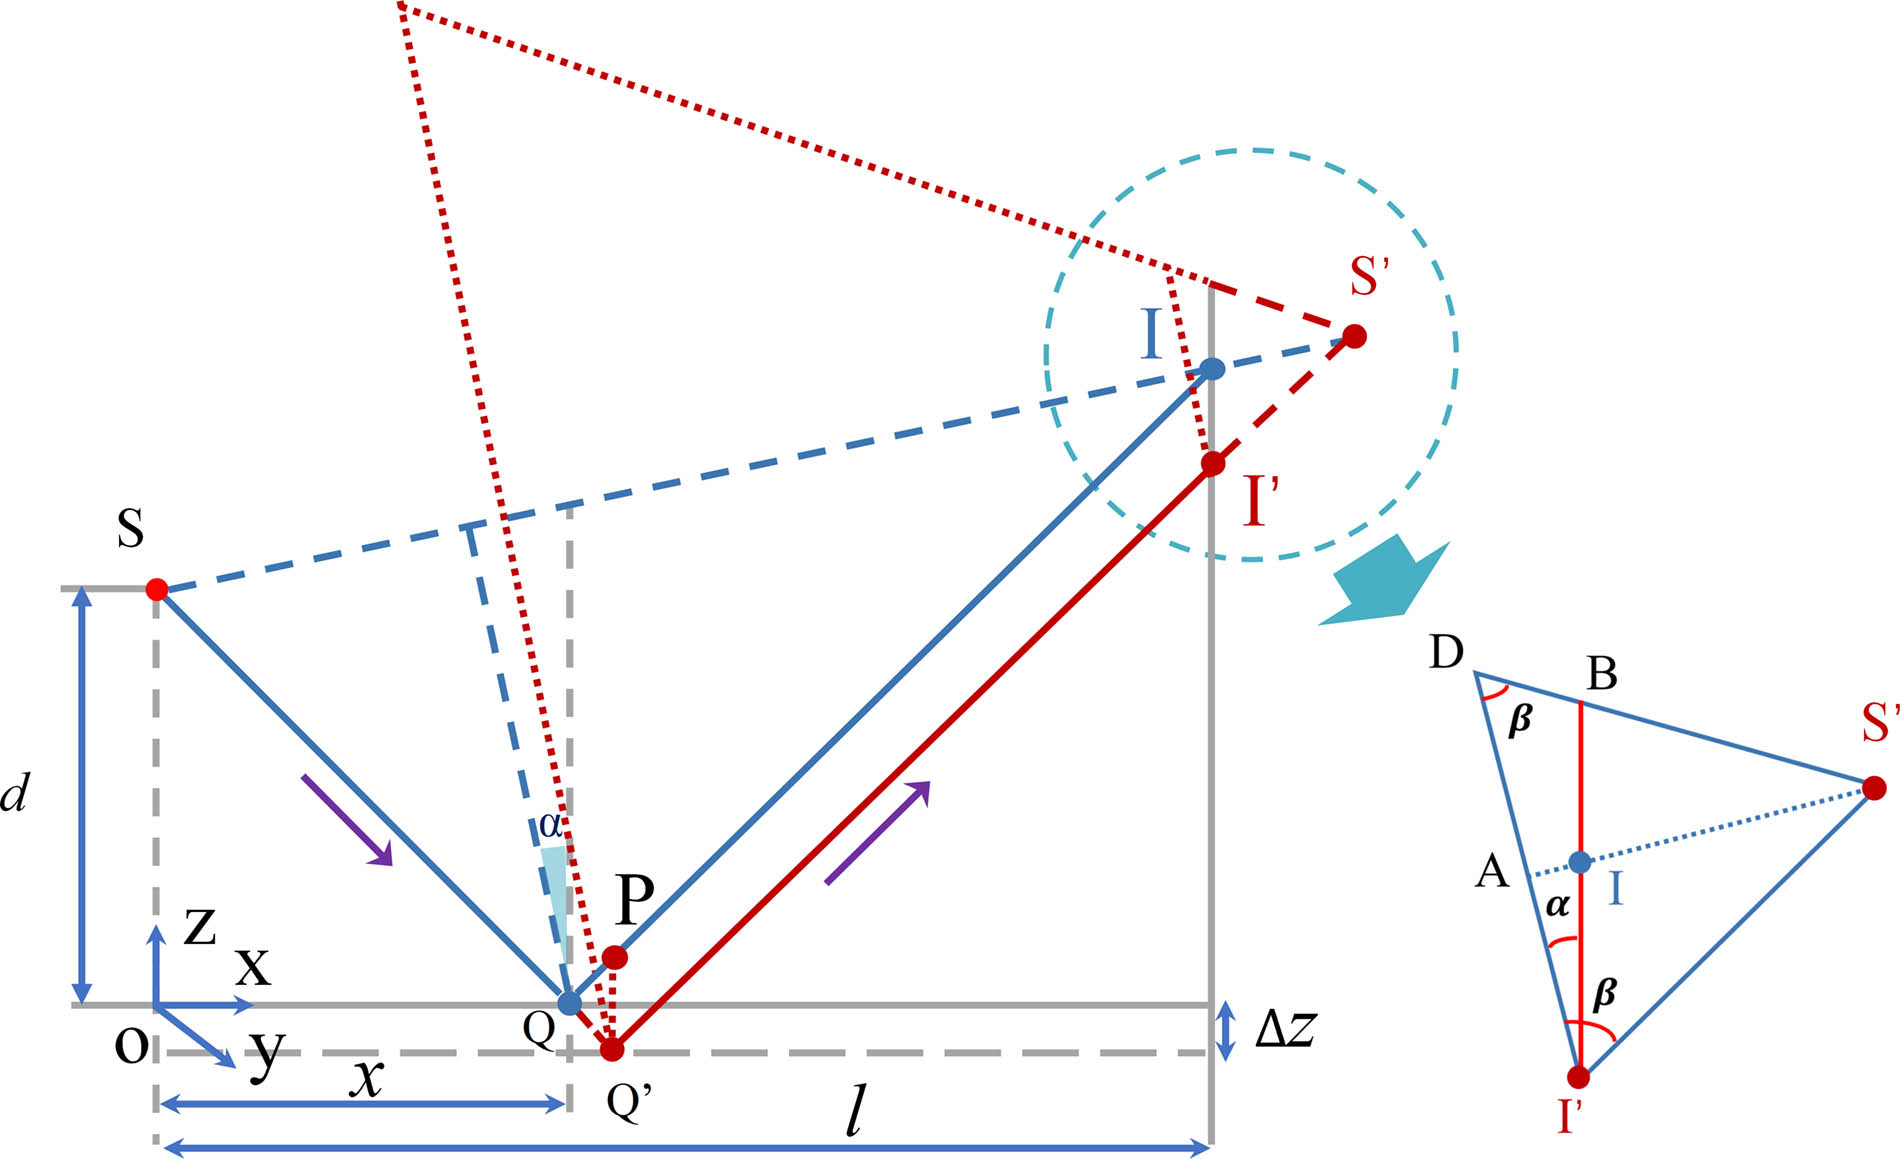
A more detailed analysis can be shown based on Fig. 4. When rays are not reflected on the theoretical surface of the crystal, it is known from the previous discussion that all rays were also reflected on the bottom inner surface of an imaginary cone, which satisfy the geometric relationship in Fig. 4 due to rotational symmetry. The generatrix of the imaginary cone is QS, and its central axis is SI. The intersection plane between this cone and the imaging plane is an ellipse, which has a long axis BI. The following equation can be deduced from the geometric relationship in Fig. 4:where d is the distance from the source to the X axis, the distance between the source and the imaging plane in the X-axis direction is l, and x is the distance between the source and the incident point in the X axis. Therefore, in the isosceles triangle SDI, the base side is and

Fig. 4. Schematic of the reflection point moving along negative Z axis.

下载图片 查看所有图片

According to the geometric properties of the conical oblique section, the projection of the conical oblique section on the bottom of the cone is a circle. The diameter of the circle obtained by projecting the section on the bottom surface is the short axis of the ellipse, and the short axis of the ellipse can be obtained:

From the previous analysis, a perfect focal point cannot be obtained when the reflection surface has deviation Δz, and an ellipse will be obtained on the imaging plane. The maximum deviation in the Y direction is

The maximum deviation in the negative Z-axis direction is δz=2Δz, and the maximum deviation in the positive Z-axis direction is

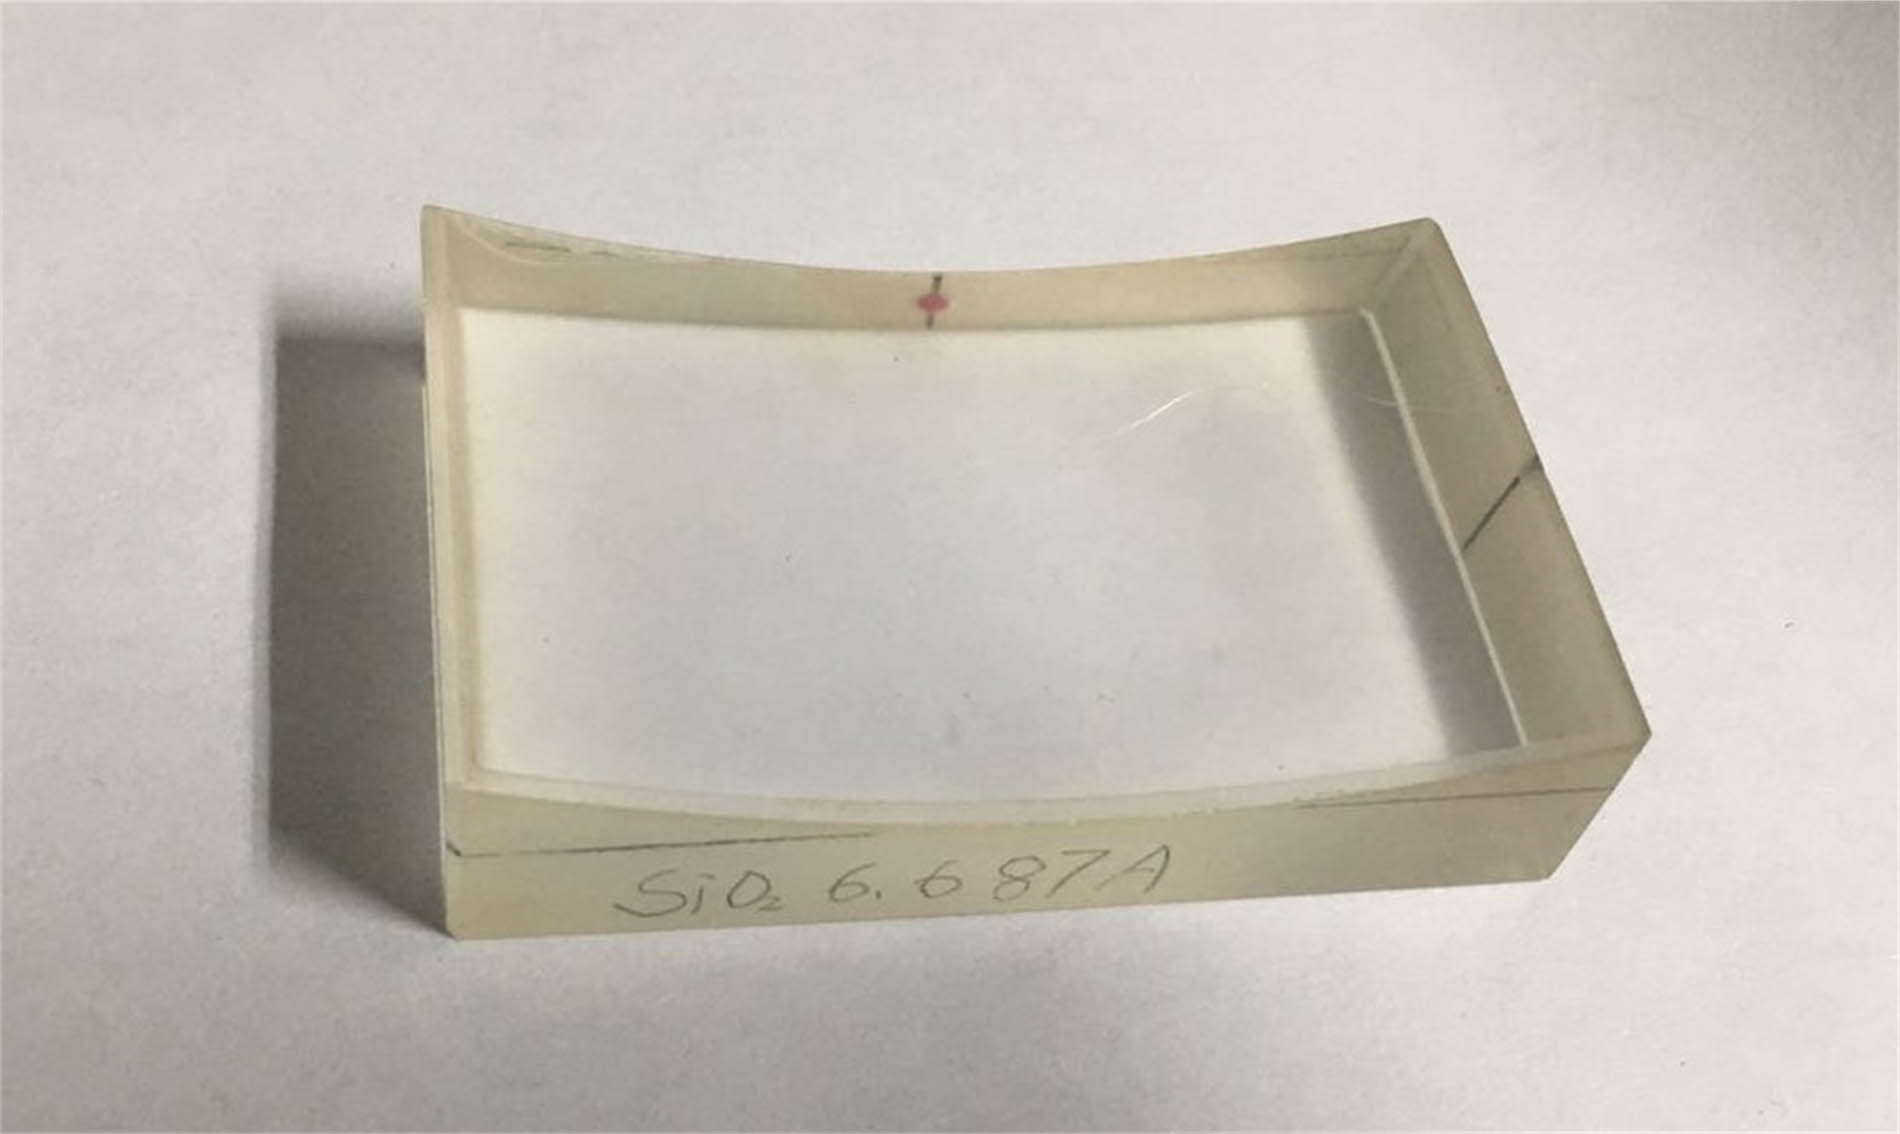
The first step in making a crystal analyzer is to process a crystal substrate, which can be made of metal or glass. It is difficult to guarantee high precision in the fabricating process of the multi-curvature surface as discussed in the previous section, since this process is not as simple as making a regular shape like a cylinder or sphere. This Letter used glass material to ensure the precision of the variable-curvature surface at the micron scale. First, a glass substrate was fabricated by machining, and then precisely fabricated crystal plates were pasted to the substrate at a certain temperature and humidity. This experiment is planned to detect titanium (Ti) Kα rays with the energy around 4750 eV. α-quartz was chosen as the diffraction wafer in the experiment (Fig. 5) because it has better bending properties when compared with other crystal materials; the lattice constant of it is 2d=0.6687nm.

Fig. 5. Fabricated multi-curvature α-quartz crystal on the glass substrate.

下载图片 查看所有图片

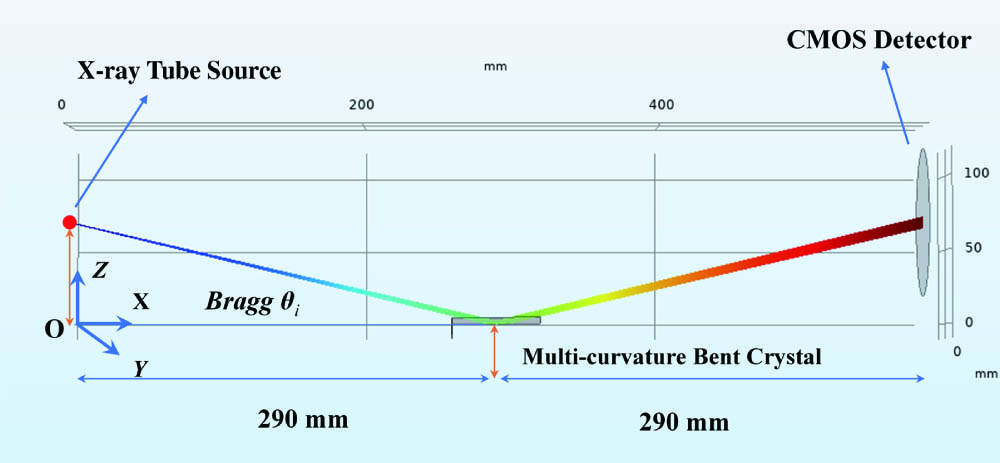
The experiment was accomplished by using the Ti target X-ray tube in the Research Center of Laser Fusion, China Academy of Engineering Physics. The initial positions of devices are arranged as shown in Fig. 6. A complementary metal–oxide–semiconductor (CMOS) camera, which detects the CsI (Tl) scintillator, was used as the X-ray imaging detector. The detection plane of the CMOS is perpendicular to the paper, and its center is 290 mm away from the crystal center in the X-axis direction. The distance between the source and the crystal is also 290 mm. Obviously, the detection plane and the source are centro-symmetrically distributed. The diagnostic setup was verified first using a laser level meter. The source, the center of the crystal, and the convergence line (the light received on the IP board after the laser is reflected by the crystal) should be centered on the same plane. This condition can be guaranteed by adjusting the optical path with a gradienter. After the geometry setup is verified, the X-ray experiment can proceed by using the IP board first. When the X-ray tube is turned on, the emission spot can be observed on the IP board. Meanwhile, the orientation of the crystal was adjusted slightly to make the emitted spot a standard circle, and it also located the source on the center axis. After the alignment, a CMOS detector was used to detect the diffracted X-ray spectrum. The diffraction profile obtained is shown in Fig. 7 under the condition that the irradiation time is 10 s. As can be seen from Fig. 7, the spectra of Kα and Kβ are close to a round dot, and the brightness of the obtained focusing profile is extremely high. The obtained experiment results were consistent with the theoretical analysis.
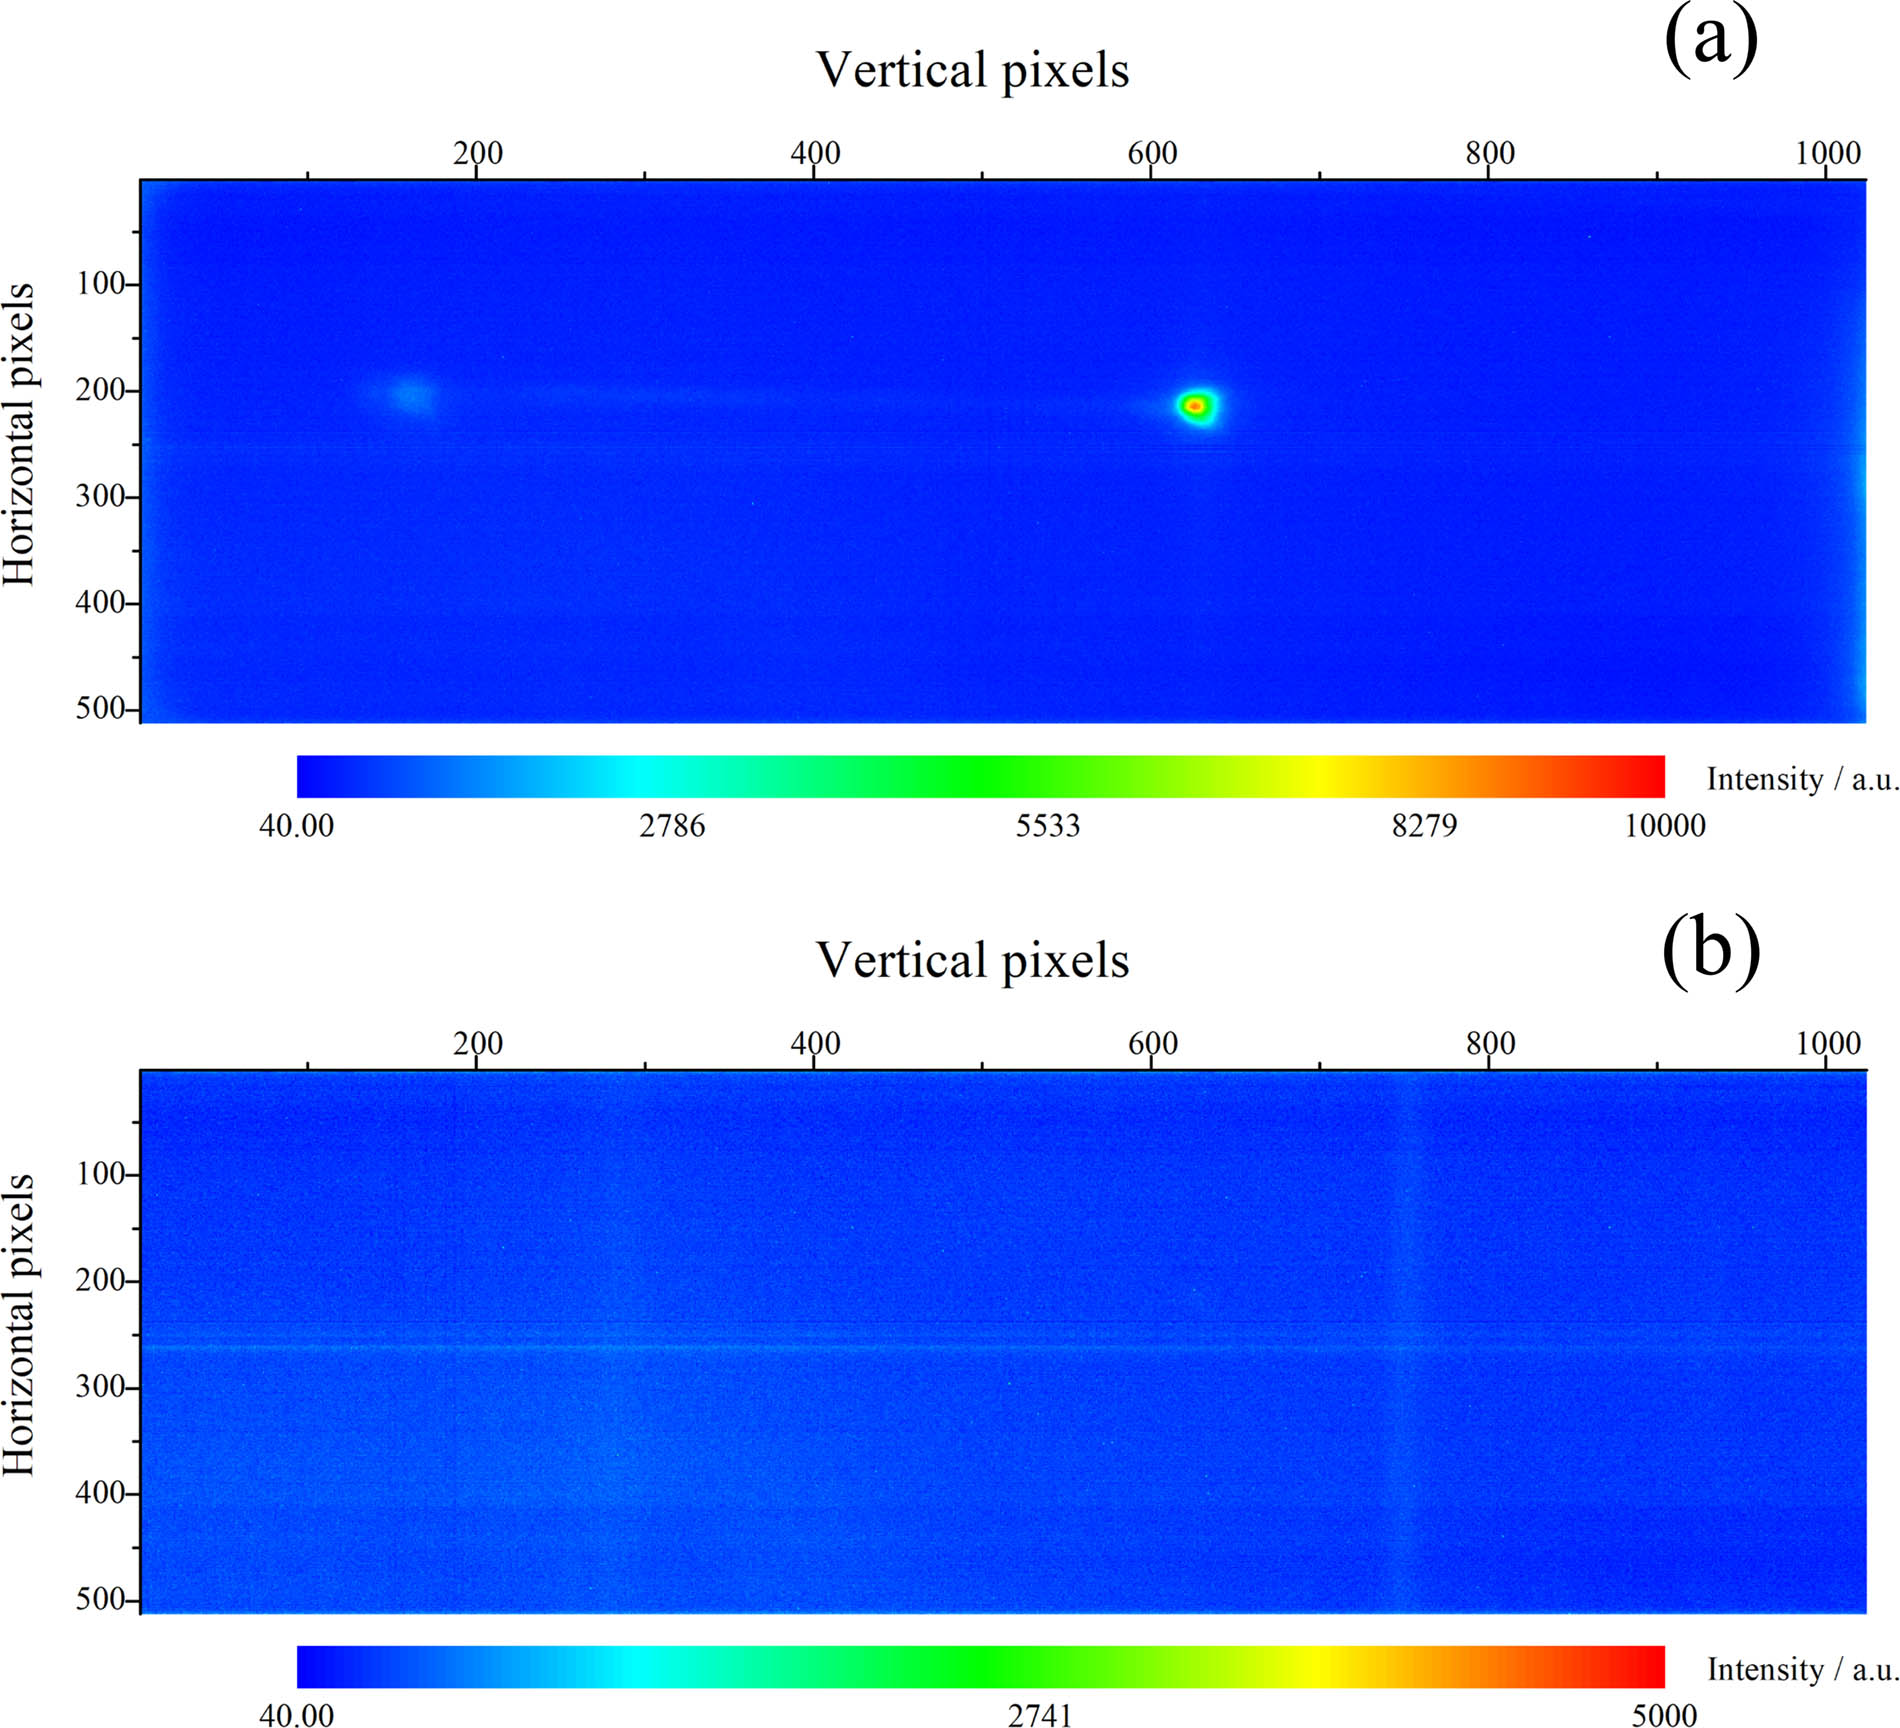
Fig. 6. Schematic of the source, bent crystal, and detector.

下载图片 查看所有图片

Fig. 7. X-ray spectrum obtained from the (a) multi-curvature crystal and (b) the planar α-quartz crystal, respectively.

下载图片 查看所有图片

In order to verify the focusing ability of the multi-curvature crystal, the experiment result by using a planar crystal was also obtained, as shown in Fig. 7(b). The diffraction profile was obtained under the same condition, while the multi-curvature crystal was replaced by a planar crystal. As can be seen from the figures, the focusing profile of the planar crystal is approximately a straight line due to the lack of focusing ability[18].

The distribution of spectral intensity, which can be obtained after analyzing the spectrum detected in Fig. 7, is shown in Fig. 8. The highest Kα intensities of the multi-curvature crystal analyzer and the planar crystal analyzer are 8180 and 390, respectively. After the background strength is deducted, the calibrated intensities are 6280 and 40, respectively. The results show that the X-ray focusing intensity of the multi-curvature crystal is 157 times that of the planar crystal. It can be further seen from the intensity profiles, the multi-curvature crystal has a smoother and higher signal-to-noise ratio than the planar crystal. It is suitable for coupling with the subsequent diagnostic equipment, which has higher intensity and spatial resolution requirements.
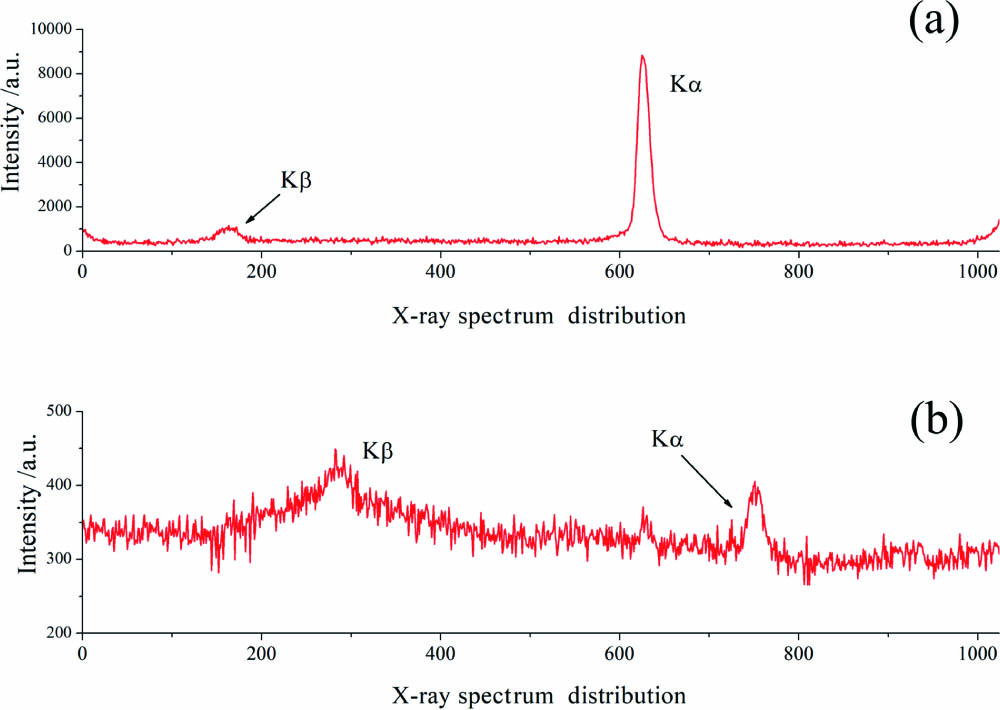
Fig. 8. Distribution of spectral intensity: (a) multi-curvature bent α-quartz crystal, (b) the planar α-quartz crystal.

下载图片 查看所有图片

The spectral resolution is a critical characteristic for the bent crystal spectrum analyzer. In our experiment, the Kα energy and the Kβ energy of the Ti target are 4.511 keV and 4.932 keV, and the energy difference is 421 eV. The FWHM of the Kα X ray is 13.6 eV, which can be calculated from Fig. 8(a). Hence, the spectral resolutions (λ/Δλ) obtained from the multi-curvature crystal and the planar crystal are both around 331. The main reason is that the size of the Ti target of the X-ray source is large (about 10 mm in length), and the excessive size of the X-ray source limits the spectral resolution of the crystal spectrometer. The spectral resolution advantage of the designed multi-curvature analyzer will be verified during the following experiments based on the Shenguang device, which has a 0.2 mm source.

The efficiency of X-ray collection of a bent crystal X-ray analyzer with multi-curvature surface has been demonstrated in this Letter. The designed multi-curvature crystal analyzer extends the spectral range and also optimizes the structure of the X-ray crystal spectrometer. Thereby, more diagnostic devices can work at the same time. The results show that the spectral intensity of the multi-curvature spectrometer can reach 157 times that of the quartz plane spectrometer, and the detection energy range is also increased to 4.51–5.14 keV during a single diagnostic test by using the multi-curvature crystal. The crystal spectrometer with the multi-curvature surface can provide a diagnostic instrument with better performance and higher utilization efficiency for laser fusion diagnostic experiments.

References

[1] YuB.YangJ. M.HuangT. X.WangP.ShangW. L.QiaoX. M.DengX. W.ZhangZ.W.SongZ. F.TangQ.PengX. S.ChenJ. B.LiY. L.JiangW.PuL. D.YanJ.ChenZ. J.DongY. S.ZhengW. D.WangF.JiangS. E.DingY. K.ZhengJ., Chin. Phys. B28, 298 (2019).1674-1056

[2] WangF.GuanZ. Y.LiY. L.PengX. S.XuT.WeiH. Y.LiuX. M.ZhaW. Y.LiuY. G.MeiY., Sci. Sin. Phys. Mech. Astro.48, 065205 (2018).

[3] CaoZ. R.YuanZ.ChenT.DengB.WangQ. Q.DengK. L.YangZ. W.LiuJ.MiaoW. Y.JiangW.YuanY. T.LiY. K.HuX.ZhangJ. Y.DongJ. J.DingY. K.MuB. Z.WangF.LiuS. Y.YangJ. M.JiangS. E.ZhangB. H., Sci. Sin. Phys. Mech. Astro.48, 065206 (2018).

[4] DengY. T.JinG. F.ZhuJ., Chin. Opt. Lett.17, 092201 (2019).CJOEE31671-7694

[5] ZangH. P.ZhengC. L.FanQ. P.WangC. K.WeiL.CaoL. F.WangX. R.LiangE. J., Chin. Opt. Lett.16, 080501 (2018).CJOEE31671-7694

[6] ShiJ.PengG. H.XiaoS. L.QianJ. Y., Chin. J. Sci. Instrum.12, 2761 (2012).YYXUDY0254-3087

[7] PetruninA. A.SovestnovA. E.TyunisA. V.FominE. V., Tech. Phys. Lett.35, 73 (2009).TPLEED1063-7850

[8] ShevelkoA. P.KasyanovY. S.YakushevO. F.KnightL. V., Rev. Sci. Instr.73, 3458 (2002).RSINAK0034-6748

[9] HamosV., Ann. Phys.409, 716 (1933).

[10] ShevelkoA. P.AntonovA. A.GrigorievaI. G.KasyanovY. S.KnightL. V.MenaA. R.TurnerC.WangQ.YakushevO. F., Proc. SPIE4144, 148 (2000).PSISDG0277-786X

[11] ShevelkoA. P., Proc. SPIE91, 3406 (1998).PSISDG0277-786X

[12] ShevelkoA. P.AntonovA. A.GrigorievaI. G.YakushevO.KnightL. V.WangQ., Adv. X-ray Analysis45, 433 (2002).AXRAAA0376-0308

[13] ZamponiF.KämpferT.MorakA.UschmannI.FörsterE., Rev. Sci. Instrum.76, 116101 (2005).RSINAK0034-6748

[14] HallT. A., J. Phys. E Sci. Instrum.17, 110 (1984).

[15] BitterM.HillK. W.GaoL.EfthimionP. C.ApariccioL. D.LazersonS.PablantN., Rev. Sci. Instrum.87, 11E333 (2016).RSINAK0034-6748

[16] ShiJ.BitterM.HillK. W.GaoL.MaJ.MiaoS., Rev. Sci. Instrum.88, 123116 (2017).RSINAK0034-6748

[17] AndielUEidmannKPisaniF.WitteK.UschmannI.WehrhanO.FörsterE., Rev. Sci. Instrum.74, 2369 (2003).RSINAK0034-6748

[18] YuanX. H.CarrollD. C.CouryM.GrayR. J.BrennerC. M.LinX. X.LiY. T.QuinnM. N.TrescaO.ZielbauerB.NeelyD.McKennaP., Phys. Res. A653, 145 (2011).

Jun Shi, Tong Yao, Miao Li, Guohong Yang, Minxi Wei, Wanli Shang, Feng Wang. High efficiency X-ray diffraction diagnostic spectrometer with multi-curvature bent crystal[J]. Chinese Optics Letters, 2020, 18(11): 113401.

本文已被 1 篇论文引用
被引统计数据来源于中国光学期刊网
引用该论文: TXT   |   EndNote

相关论文

加载中...

关于本站 Cookie 的使用提示

中国光学期刊网使用基于 cookie 的技术来更好地为您提供各项服务,点击此处了解我们的隐私策略。 如您需继续使用本网站,请您授权我们使用本地 cookie 来保存部分信息。
全站搜索
您最值得信赖的光电行业旗舰网络服务平台!