Photonics Research, 2020, 8 (9): 09001512, Published Online: Aug. 31, 2020
Saturable and reverse saturable absorption in molybdenum disulfide dispersion and film by defect engineering Download: 772次
Figures & Tables
Fig. 1. (a) Concentrations of MoS 2 dispersion at different rotation speeds with related optical images inserted. (b) Tauc plot of MoS 2 dispersions. (c) Size and height of MoS 2 dispersions at different rotation speeds. (d), (g) AFM image and height profile of MoS 2 at 2000 rpm. (e), (h) AFM image and height profile of MoS 2 at 4000 rpm. (f), (i) AFM image and height profile of MoS 2 at 6000 rpm. The number indicates the different nanosheet.
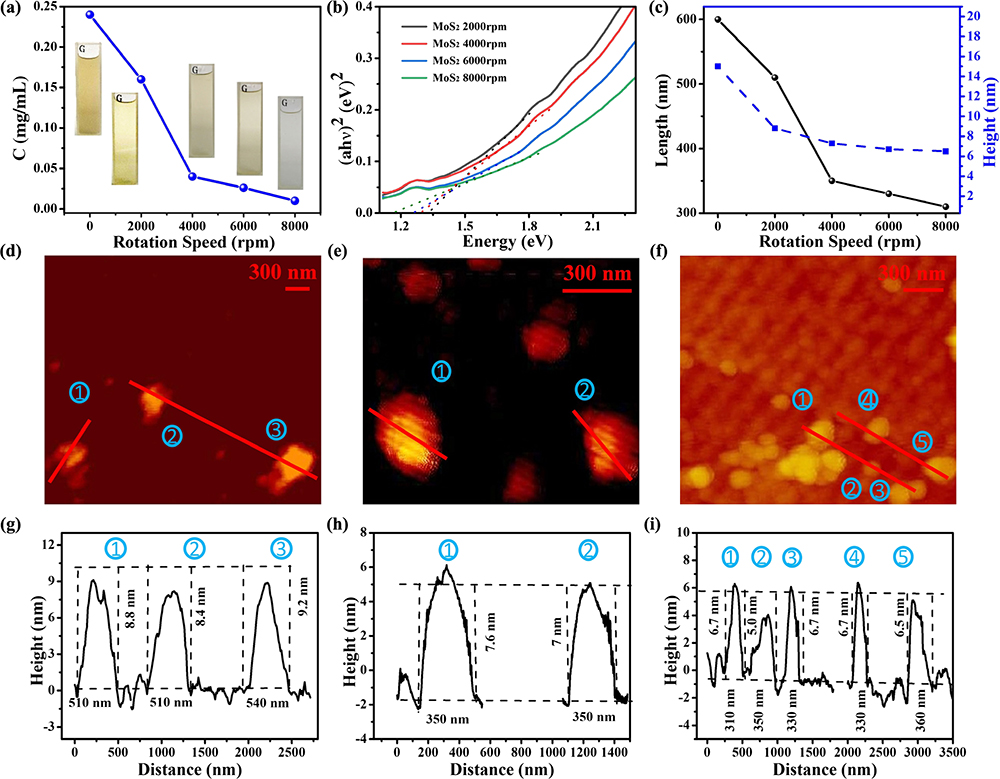
Fig. 2. Representative TEM images of MoS 2 dispersions at (a) 0, (b) 2000, (c) 4000, (d) 6000, and (e) 8000 rpm. (f) High-resolution TEM image of MoS 2 nanosheet at 6000 rpm. (g) TEM image of ultrathin layer of MoS 2 defect at 8000 rpm; elemental mapping of (h) Mo (i) S.
Fig. 3. (a) High-resolution XPS spectra of MoS 2 films. (b) XRD patterns of MoS 2 films. (c) Raman spectra of MoS 2 films. (d) Raman shift of E 2 g 1 and A 1 g . (e) UV-Vis absorption spectra of MoS 2 films. (f) Tauc plot obtained from UV-Vis absorption spectra of MoS 2 films with an increase in centrifugation speed.
Fig. 4. Open-aperture Z-scan results of MoS 2 dispersions (a) at 0 rpm with different pulse energies, (b) at 6000 rpm with different pulse energies, and (c) at different rotation speeds. Z-scan results of MoS 2 films (d) at 8000 rpm and different pulse energies, at different rotation speeds (e) with 45 nm thickness and (f) 75 nm thickness.
Fig. 5. (a) Calculated results of α 0 (red dot) and β eff (blue square), respectively. (b) Im χ ( 3 ) and FOM from MoS 2 dispersions in red dot and blue square, respectively. (c) Measured α 0 (red dot) and β eff (blue square). (d) Im χ ( 3 ) and FOM from films with different sizes, which are shown using red dot and blue square, respectively.
Fig. 6. Band structure and DOS results for monolayer MoS 2 : (a) perfect; (b) with monosulfur vacancy; and (c) with disulfur vacancy.
Fig. 7. (a) Three-energy-level model of few or few-defect MoS 2 . (b) Three-energy-level model combined with defect state of S vacancies in MoS 2 . (c) Three-defect-energy-level diagram at a high concentration of S vacancies in MoS 2 . Fitting results of (d) MoS 2 dispersions at different rotation speeds, MoS 2 films (e) with 45 nm thickness and (f) with 75 nm thickness.
Table1. Parameters of Dispersions and Films
|
Chunhui Lu, Hongwen Xuan, Yixuan Zhou, Xinlong Xu, Qiyi Zhao, Jintao Bai. Saturable and reverse saturable absorption in molybdenum disulfide dispersion and film by defect engineering[J]. Photonics Research, 2020, 8(9): 09001512.