Matter and Radiation at Extremes, 2020, 5 (3): 038401, Published Online: Nov. 25, 2020
Crystallography of low Z material at ultrahigh pressure: Case study on solid hydrogen
Figures & Tables
Fig. 1. Axial pressure distribution of a diamond anvil with a hydrogen sample at 228 GPa. (a) Raman spectra of the ambient diamond anvil measured with the laser beam in focus and out of focus at different distances. (b) Intensity of a diamond Raman phonon measured with the laser beam in focus and out of focus at different distances. The intensity drops to 50% at 40 µ m. (c) Raman spectra of the diamond anvil measured with the laser beam in focus and out of focus with the sample at different depths. (d) Pressures at different depths away from the culet–anvil interface. The pressure increases slightly at shallow depths, with the intensity of the high-frequency diamond edge decreasing rapidly. At a depth of 40 µ m, the high-frequency edge that corresponds to >200 GPa is hardly distinguishable. The hint of a high-frequency edge is due to convolution of the high-pressure signal with the finite depth of focus (80 µ m). The pressure drops to ∼20 GPa at 110 µ m. The inset shows a microscope image of the sample with transmitted and reflected light.
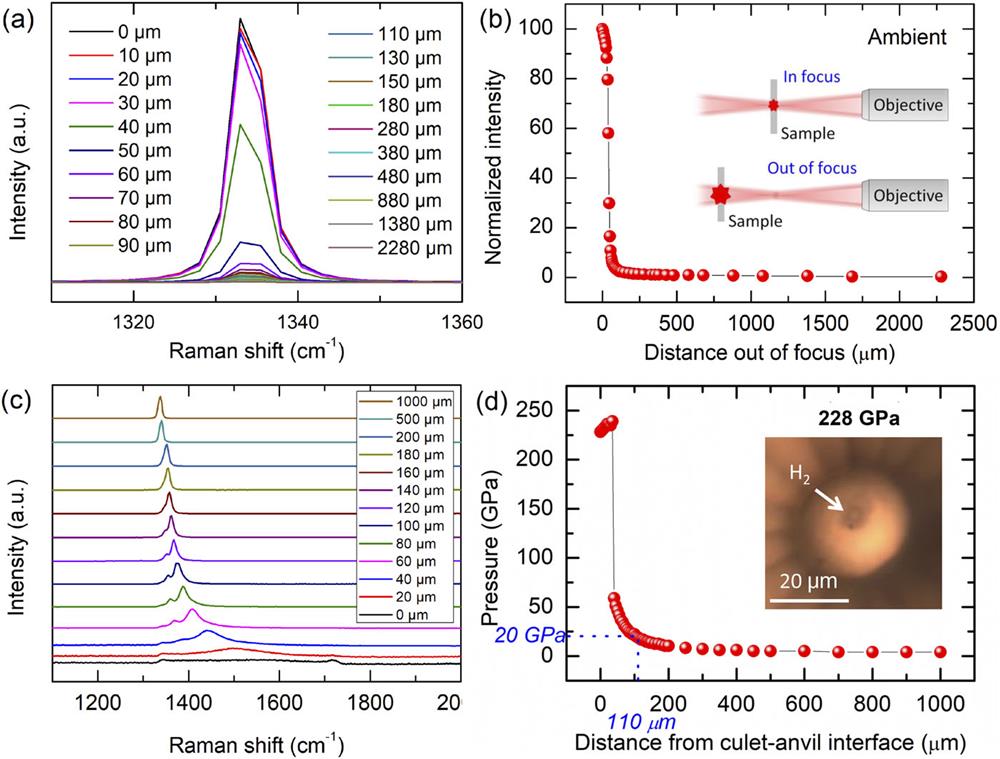
Fig. 2. Examination of diamond anvils by synchrotron white beam topographic imaging. (a) Experimental setups at beamline 1-BM of the APS at ANL. The inset shows the sample and sample holder. (b) Developed X-ray film with the recorded Laue pattern. (c)–(f) show topographic (top) and optical microscopic (bottom) images of selected anvils. (c) Example of a cracked diamond anvil, released from 200 GPa, where the red dashed box on the topographic image marks the cracked position while the corresponding microscopic image shows the anvil after pressure release. (d)–(f) Anvils for ultrahigh-pressure hydrogen experiments, with the maximum pressures before failure being 210 GPa, 232 GPa, and 270 GPa, respectively.

Fig. 3. Correlation of the maximum pressures achieved on hydrogen samples with the final sizes of the sample chambers. The inset shows a microscope image of a diffusion-induced crack inside a diamond anvil with a hydrogen sample at megabar pressure. This figure summarizes some of our early experiments with W gaskets and 40 or 50 µ m culet diamond anvils. Later experiments with composite gaskets under similar experimental conditions are not included here.
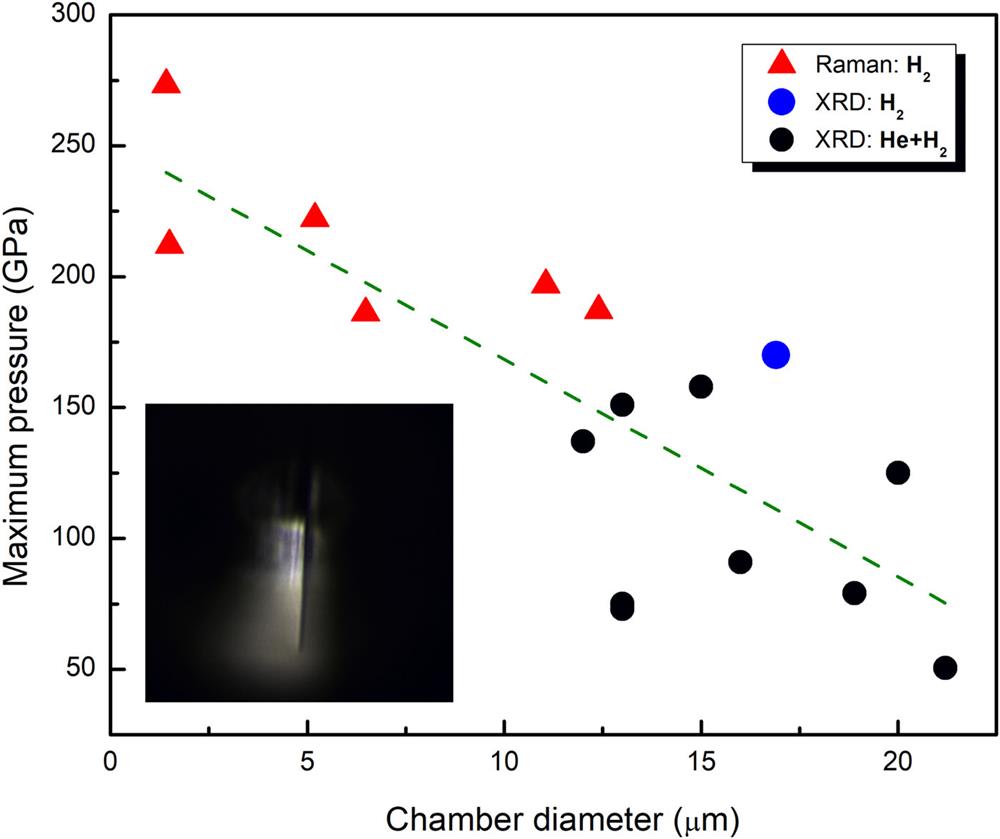
Fig. 4. (a) Schematic of the X-ray path of a sample in a DAC with a composite gasket. (b) Demonstration of the influences of the tail of a focused X-ray on XRD patterns from DAC samples. The inserts on the left and right show XRD patterns in the case of a composite gasket with an MgO insert and the case of a Re gasket, respectively.

Fig. 5. XRD contrast imaging of a hydrogen sample with a composite gasket. (a) Microscope image of the sample illustrated by both transmitted and reflected light. (b) Enlarged image of the part included in the red dashed box in (a). (c) Bragg peaks tracked in XDI software.53 Red shading marks the Bragg peaks from which the intensity is subtracted. (d) XRD contrast image of the same sample area corresponding to (b). Blue and orange represent cBN and Au, respectively. Darker color represents higher Bragg peak intensity. The white area corresponds to hydrogen.

Fig. 6. (a) Microscope image of a typical H2–He sample with 40 or 50 iμ m culet. (b) Raw XRD images (exposure time 1 s) of measured hydrogen (100) reflections at 158 GPa. Numbers represent Miller indices for each reflection. (c) Measured (100) reflections at 158 GPa in reciprocal space. The angles marked are those between adjacent reciprocal lattice points. Dashed lines are visual guides. (d) Evolution of rocking curve of (100) reflections with pressure. (e) Span of the diffraction arc in azimuth angle. Error bars in both (d) and (e) stand for the standard deviation of the six (100) reflections.
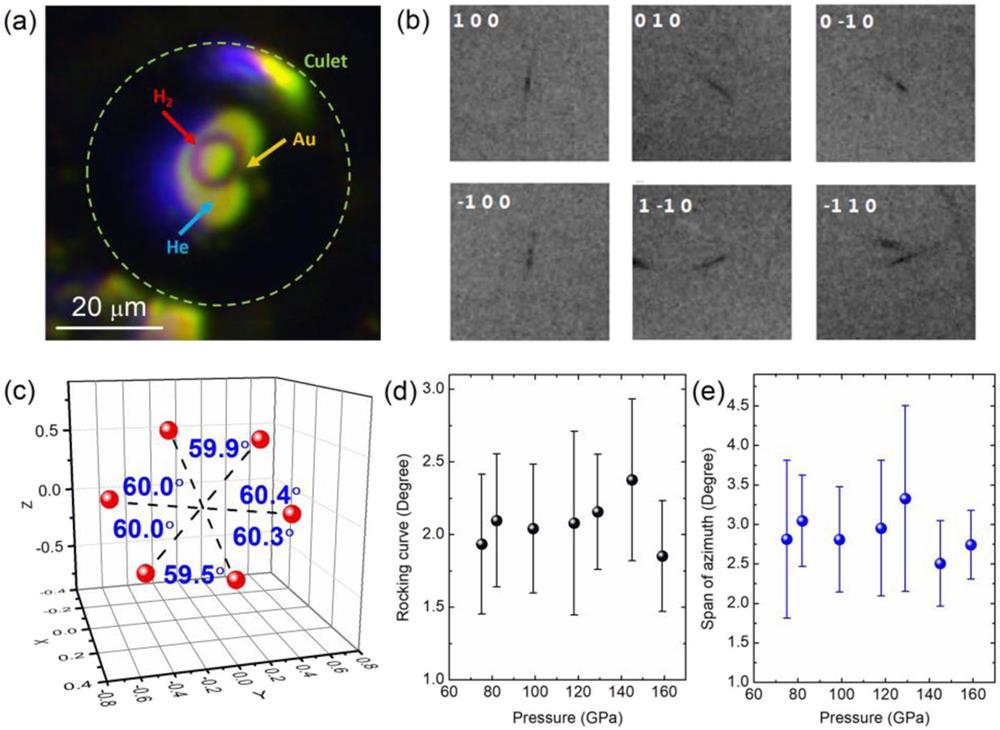
Fig. 7. XRD of hydrogen using a 50 nm focused X-ray beam. (a) Selected XRD raw image showing the Bragg peak of hydrogen (red box). The saturating Bragg peaks (blue boxes) are from diamond. (b), (c), and (d) Cropped XRD images of a hydrogen Bragg peak and two types of non-sample peaks, respectively. The image in (b) was obtained from a Pilatus 1M detector with 172 µ m pixel size, and those in (c) and (d) were obtained from a MarCCD detector with 79 µ m pixel size (300 nm X-ray beam). (e) and (f) XRD contrast imaging of hydrogen crystallites at 198 GPa. Darker color represents stronger Bragg peak intensity. The step size in both the horizontal and vertical directions is 100 nm. (g) and (h) Typical rocking curves of hydrogen Bragg peaks at 222 GPa.

Fig. 8. (a) Experimental setup with the 10° MCC and (b) example of an XRD image obtained with it. (c) Experimental setup with the 30° MCC and (d) example of an XRD image obtained with it. Experimental devices were pictured at 16IDB of APS, ANL. The green and red boxes in (c) and (d) mark the exposed areas on the Pilatus 1M detector from the MCCs and hydrogen Bragg peaks, respectively.

Fig. 9. Comparison of the SBR [hydrogen (100)] for different setups. Open and solid symbols represent data collected using MarCCD 165 and Pilatus 1M detectors, respectively. Circles represent H2–He samples measured using a 6 × 7 µ m2 (30 keV) or 3 × 2 µ m2 (37 keV) focused X-ray beam. Squares are data measured on pure-H2 samples using an MCC, probed by 6 × 7 µ m2 focused X-ray beam at 30 keV (10° MCC). Upward-pointing triangles are data measured on pure-H2 samples using a 300 nm focused X-ray beam at 23 keV or 24 keV. Downward-pointing triangles are data measured on pure-H2 samples using a 50 nm focused X-ray beam at 20 keV. The inset shows a comparison of SBRs measured with different setups on same samples. Symbols with the same color were measured from one particular sample. The detailed conditions are described in the key. Data obtained with the MCC usually lack an error bar since only one (100) Bragg peak was resolved. Data obtained with the nano beam may have large error bars since several Bragg peaks from crystallites in different qualities were measured.

Fig. 10. (a) Comparison between the d 100 pressure scale and the MgO pressure scale. Solid squares and open hexagons represent data on the d 100 and MgO pressure scales, respectively, with different colors representing different runs. The blue curve is a fit of data on the d 100 scale. The inset shows a microscope image (top) and an XRD contrast image (bottom) of a sample. The pressure on the MgO gasket is measured at the position inside the black box, where MgO is in direct contact with hydrogen. (b) Comparison of different pressure scales in terms of c /a . Solid squares, open hexagons, open upward-pointing triangles, open circles, and open downward-pointing triangles represent data on the d 100 scale, MgO scale,68 Raman shift of v 1 scale,27 diamond edge scale,69 and the reference from Loubeyre et al. ,41 respectively. The blue curve is a fit of phase I data on the d 100 scale. The red dashed line serves as a visual guide. (c) Differences between the d 100 scale and the other scales. The key to the symbols is the same as that for (b). Part of (a) and (c) is adapted from Fig. 6 of our.70

Cheng Ji, Bing Li, Wenjun Liu, Jesse S. Smith, Alexander Björling, Arnab Majumdar, Wei Luo, Rajeev Ahuja, Jinfu Shu, Junyue Wang, Stanislav Sinogeikin, Yue Meng, Vitali B. Prakapenka, Eran Greenberg, Ruqing Xu, Xianrong Huang, Yang Ding, Alexander Soldatov, Wenge Yang, Guoyin Shen, Wendy L. Mao, Ho-Kwang Mao. Crystallography of low Z material at ultrahigh pressure: Case study on solid hydrogen[J]. Matter and Radiation at Extremes, 2020, 5(3): 038401.


 PDF全文
PDF全文
