Photonics Research, 2019, 7 (11): 11001354, Published Online: Nov. 1, 2019
Design, fabrication, and characterization of a highly nonlinear few-mode fiber  Download: 603次
Figures & Tables
Fig. 1. (a) Schematic of the intramodal and intermodal FWM processes. The colors represent the spatial modes of the waves. (b) The inverse group velocity (β 1 β 1
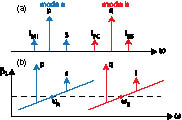
Fig. 2. (a) Designed and measured refractive index profiles of the fabricated HNL-FMF at 1550 nm. The effective refractive index of the supported modes and their transverse mode profiles are also shown. (b) Relative inverse group velocity curves of the modes of the designed fiber and (c) those of the modes when the core radius or α ± 1 %

Fig. 3. SLM apparatus when used as the MMUX for mode excitation of the fabricated HNL-FMF. PBS, polarizing beam splitter; λ / 2


Fig. 5. Setup of time-domain pulse response measurement, where GSa/s stands for gigasamples per second.

Fig. 6. Spectrogram of fiber pulse response over the C band. Inset: β 2


Fig. 8. SPM spectra of the beating signal after propagation in different MGs. Inset: relationship between the SPM phase shift and the power ratio of the zero- and first-order harmonics, according to Ref. [36]. The two markers in the inset correspond to the power ratios of MGs labeled in the main figure.

Fig. 9. Experimental setup for intermodal FWM. Signal and Pump 1 are connected with the HE 11 HE 21 TE 01

Fig. 10. Output spectra after mode demultiplexing. Two different MGs are received separately by changing the corresponding phase pattern in the MDMUX. For easier observation, a redshift of 0.1 nm is intentionally added on the spectrum when receiving the HE 11

Fig. 11. Spectra of conversion efficiency when the signal wavelength varies from 1549.6 to 1546 nm. The blue curves correspond to the BS idlers, while the orange curves correspond to the PC idlers. The dashed-dotted curves correspond to the CE curves found through simulations, and the black dashed line shows where Pump 2 is located.

Jitao Gao, Elham Nazemosadat, Chen Yang, Songnian Fu, Ming Tang, Weijun Tong, Joel Carpenter, Jochen Schröder, Magnus Karlsson, Peter A. Andrekson. Design, fabrication, and characterization of a highly nonlinear few-mode fiber[J]. Photonics Research, 2019, 7(11): 11001354.


 PDF全文
PDF全文

