中国激光, 2018, 45 (3): 0307009, 网络出版: 2018-03-06
基于荧光随机涨落的超分辨显微成像  下载: 1497次特邀综述
Fluorescence Fluctuation-Based Super-Resolution Nanoscopy
图 & 表
图 1. SOFI重建原理图[12]。(a)由N个闪烁荧光分子组成的样品;(b)采集图像序列;(c)对所采集图像序列的各个像素点提取时间涨落信号;(d)分别计算3个像素时间涨落信号的自相关累积量函数;(e)所得到的SOFI图像
Fig. 1. Schematic of SOFI reconstruction[12]. (a) A specimen consists of N temporally fluctuating emitters; (b) collecte the image sequence; (c) extract temporal fluctuation signals from each pixel of the image sequence; (d) calculate auto-cumulant functions of three fluctuation signals, respectively; (e) reconstructed SOFI image
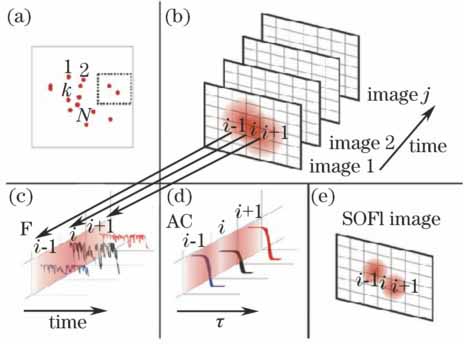


图 4. (a)对色素失调症患者的细胞进行SOFI成像,揭示其细胞中NEMO蛋白的空间结构分布[55];(b) HP1α蛋白的宽场荧光显微图像;(c) HP1α蛋白的3B荧光显微图像[56]
Fig. 4. (a) SOFI imaging of cells from patients suffered from incontinentia pigmenti, revealing spatial distribution of NEMO protein in cells[55]; (b) wide-field image of HP1α protein. (c) 3B image of HP1α protein[56]

图 5. (a) Alexa Fluor 647标记细胞微管的TIRF图像;(b) Alexa Fluor 647标记细胞微管的SRRF图像;(c) LifeAct-GFP标记F-actin的TIRF和SRRF图像(t=0);(d) LifeAct-GFP标记F-actin的TIRF和SRRF图像(t=120 s)[19]
Fig. 5. (a) TIRF image of microtubules labeled with Alexa Fluor 647; (b) SRRF image of microtubules labeled with Alexa Fluor 647; (c) TIRF and SRRF images of F-actin labeled with LifeAct-GFP (t=0); (d) TIRF and SRRF images of F-actin labeled with LifeAct-GFP (t=120 s) [19]

图 6. (a) GFP标记细胞微管的宽场荧光图像; (b)区域A的放大宽场荧光图像;(c)区域A的放大MUSICAL超分辨荧光图像;(d)区域B的放大宽场荧光图像;(e)区域B的放大MUSICAL超分辨荧光图像[35]
Fig. 6. (a) Wide-field image of microtubules labeled with GFP; (b) magnified wide-field image from Region A; (c) magnified MUSICAL image from Region A; (d) magnified wide-field image from Region B; (e) magnified MUSICAL image from Region B[35]

图 7. (a)计算机仿真模拟的一个放射状的分辨率测试图案;(b)测试图案的宽场图像;(c)~(f)测试图案的bSOFI、SRRF、ESI和MUSICAL超分辨图像;(g)白色线条位置处的截面强度分布曲线图。比例尺:1 μm
Fig. 7. (a) Computer-simulated radial resolution test pattern; (b) widefield image of test pattern; (c)-(f) bSOFI, SRRF, ESI and MUSICAL super-resolution images of test pattern; (g) intensity line profiles of positions indicated by white lines inthe images. Scale bar: 1 μm

表 1基于荧光随机涨落的超分辨成像技术性能对比
Table1. Comparison of fluorescence fluctuation-based super-resolution nanoscopy
|
曾志平. 基于荧光随机涨落的超分辨显微成像[J]. 中国激光, 2018, 45(3): 0307009. Zeng Zhiping. Fluorescence Fluctuation-Based Super-Resolution Nanoscopy[J]. Chinese Journal of Lasers, 2018, 45(3): 0307009.


 PDF全文
PDF全文

