基于响应面法的聚苯乙烯粉末选择性激光烧结成型工艺参数优化  下载: 915次
Process Parameters Optimization of Polystyrene Powder Selective Laser Sintering Based on Response Surface Methodology
1 重庆理工大学机械工程学院, 重庆 400054
2 重庆大学材料科学与工程学院, 重庆 310027
图 & 表
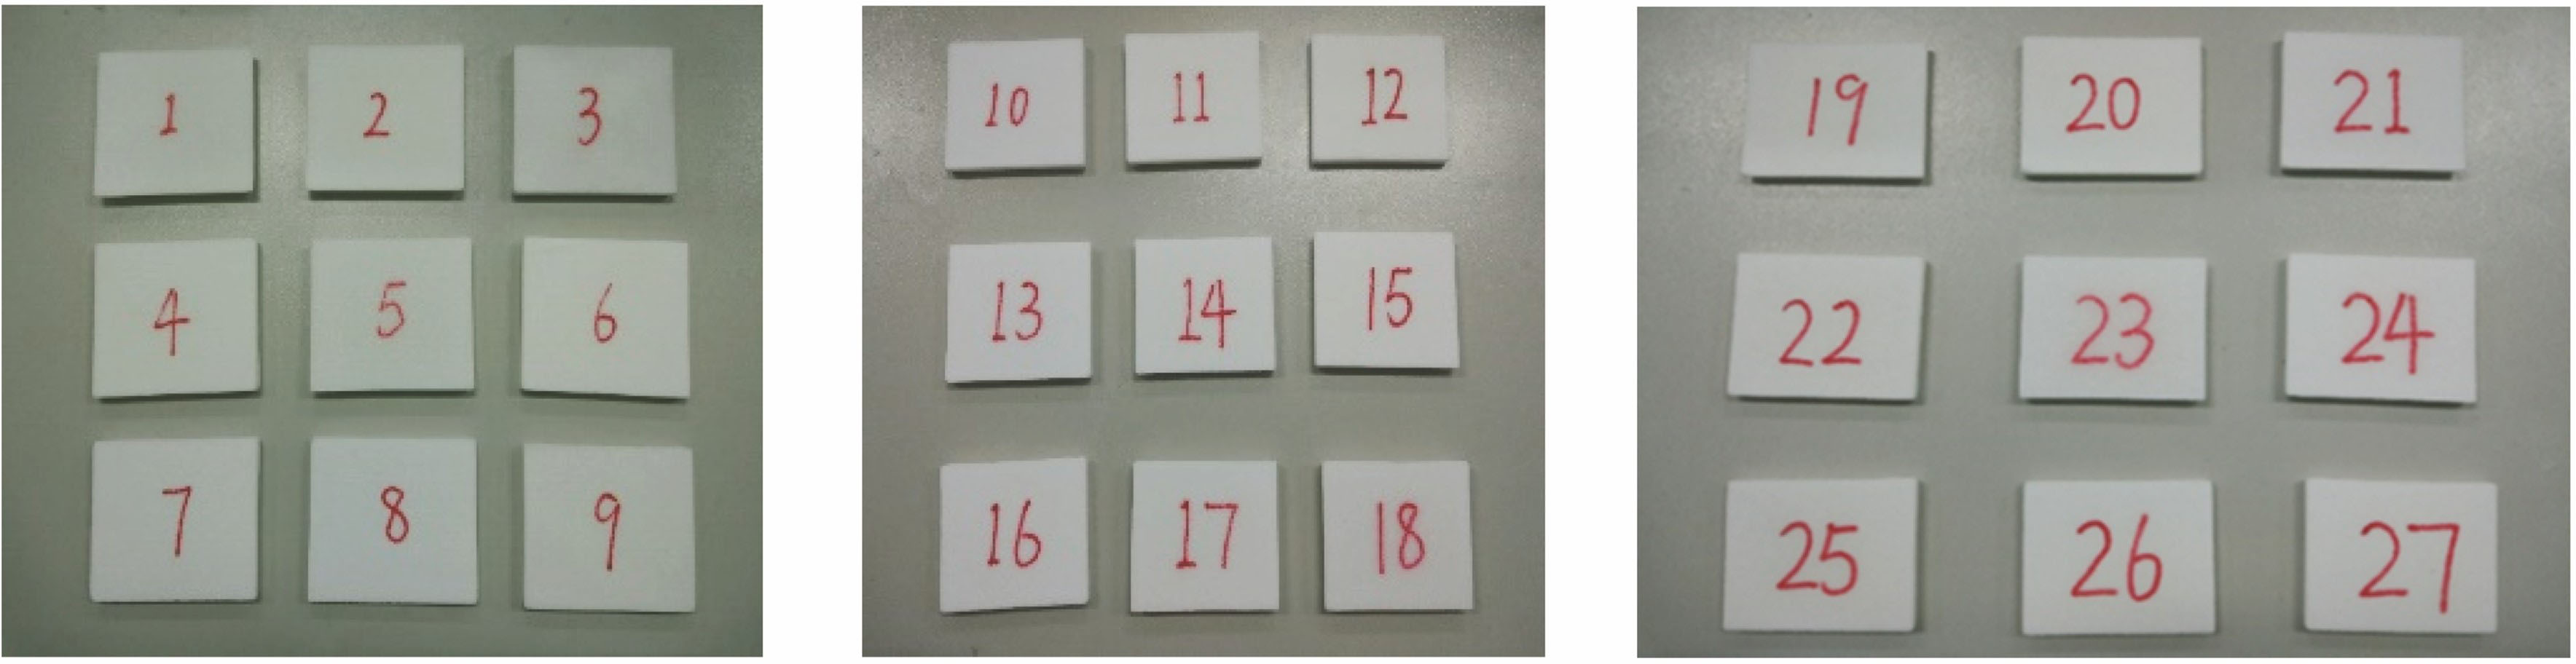
图 1. 测试样件
Fig. 1. Tested samples
下载图片 查看原文
图 2. 残差正态概率图
Fig. 2. Residual normal probability map
下载图片 查看原文
图 3. 预测值与实际值的比较
Fig. 3. Comparison between predicted and actual values
下载图片 查看原文
图 4. 不同因素对尺寸偏差率的影响
Fig. 4. Influences of different factors on dimensional deviation rate
下载图片 查看原文
图 5. 尺寸偏差率与激光功率和扫描间距的关系示意图。(a)响应面图;(b)等高线图
Fig. 5. Relationship of dimensional deviation rate versus laser power and scanning pitch. (a) Response surface diagram; (b) contour map
下载图片 查看原文
图 6. 尺寸偏差率与激光功率和单层厚度的关系示意图。(a)响应面图;(b)等高线图
Fig. 6. Relationship of dimensional deviation rate versus laser power and layer thickness. (a) Response surface diagram; (b) contour map
下载图片 查看原文
图 7. 尺寸偏差率与扫描间距和单层厚度的关系示意图。(a)响应面图;(b)等高线图
Fig. 7. Relationship of dimensional deviation rate versus scanning pitch and layer thickness. (a) Response surface diagram; (b) contour map
下载图片 查看原文
图 8. 尺寸偏差率与扫描间距和扫描速度的关系示意图。(a)响应面图;(b)等高线图
Fig. 8. Relationship of dimensional deviation rate versus scanning pitch and scanning speed. (a) Response surface diagram; (b) contour map
下载图片 查看原文
图 9. 尺寸偏差率与单层厚度和扫描速度的关系示意图。(a)响应面图;(b)等高线图
Fig. 9. Relationship of dimensional deviation rate versus layer thickness and scanning speed. (a) Response surface diagram; (b) contour map
下载图片 查看原文
表 1实验因素及水平
Table1. Experimental factors and levels
| Level | Factor |
|---|
| Laser power percentage /% | Scan pitch /mm | Layer thickness /mm | Scan speed /(mm·s-1) |
|---|
| 1 | 30 | 0.12 | 0.15 | 1800 | | 2 | 40 | 0.16 | 0.20 | 2000 | | 3 | 50 | 0.20 | 0.25 | 2200 |
|
查看原文
表 2实验设计参数与结果
Table2. Design parameters and results of experiments
| No. | Laser powerpercentage /% | Scanpitch /mm | Layerthickness /mm | Scanspeed /(mm·s-1) | Error in X /% | Error in Y /% |
|---|
| 1 | 50 | 0.16 | 0.2 | 1800 | 0.840 | 0.892 | | 2 | 50 | 0.2 | 0.2 | 2000 | 0.733 | 1.36 | | 3 | 40 | 0.12 | 0.2 | 2200 | 0.340 | 0.608 | | 4 | 30 | 0.16 | 0.2 | 1800 | 0.383 | 1.172 | | 5 | 40 | 0.12 | 0.2 | 1800 | 0.913 | 1.36 | | 6 | 30 | 0.16 | 0.2 | 2200 | 0.823 | 0.976 | | 7 | 30 | 0.2 | 0.2 | 2000 | 0.977 | 1.748 | | 8 | 40 | 0.2 | 0.25 | 2000 | 1.217 | 1.768 | | 9 | 30 | 0.16 | 0.15 | 2000 | 0.857 | 1.528 | | 10 | 30 | 0.12 | 0.2 | 2000 | 0.010 | 0.808 | | 11 | 40 | 0.16 | 0.2 | 2000 | 0.473 | 1.044 | | 12 | 40 | 0.2 | 0.2 | 2200 | 0.540 | 0.8 | | 13 | 40 | 0.16 | 0.2 | 2000 | 0.460 | 1.012 | | 14 | 50 | 0.16 | 0.25 | 2000 | 0.903 | 1.408 | | 15 | 40 | 0.16 | 0.15 | 2200 | 0.757 | 1.024 | | 16 | 30 | 0.16 | 0.25 | 2000 | 1.337 | 1.792 | | 17 | 40 | 0.16 | 0.15 | 1800 | 1.270 | 1.848 | | 18 | 40 | 0.12 | 0.15 | 2000 | 0.580 | 0.924 | | 19 | 40 | 0.16 | 0.25 | 1800 | 0.687 | 1.276 | | 20 | 40 | 0.2 | 0.15 | 2000 | 0.617 | 1.372 | | 21 | 50 | 0.16 | 0.15 | 2000 | 0.490 | 1.036 | | 22 | 40 | 0.16 | 0.2 | 2000 | 0.737 | 1.164 | | 23 | 50 | 0.12 | 0.2 | 2000 | 0.300 | 0.924 | | 24 | 40 | 0.12 | 0.25 | 2000 | 0.887 | 1.224 | | 25 | 50 | 0.16 | 0.2 | 2200 | 0.773 | 0.648 | | 26 | 40 | 0.16 | 0.25 | 2200 | 0.690 | 0.872 | | 27 | 40 | 0.2 | 0.2 | 1800 | 0.597 | 1.136 |
|
查看原文
表 3优化模型的方差分析结果
Table3. Variance analysis results of optimized model
| Source of variance | Sum of square | Degree of freedom | Mean square error | F | P | Significant |
|---|
| Model | 2.46 | 11 | 0.22 | 5.09 | 0.0028 | Y | | A-Laser power | 0.41 | 1 | 0.41 | 9.26 | 0.0088 | | | B-Scan pitch | 0.20 | 1 | 0.20 | 4.62 | 0.0495 | | | C-Layer thickness | 0.031 | 1 | 0.031 | 0.70 | 0.4166 | | | D-Scan speed | 0.63 | 1 | 0.63 | 14.40 | 0.0020 | | | AB | 0.21 | 1 | 0.21 | 4.88 | 0.0443 | | | AC | 2.916×10⁻³ | 1 | 2.916×10⁻³ | 0.066 | 0.8005 | | | BC | 2.304×10⁻³ | 1 | 2.304×10⁻³ | 0.052 | 0.8222 | | | BD | 0.043 | 1 | 0.043 | 0.98 | 0.3380 | | | CD | 0.044 | 1 | 0.044 | 1.00 | 0.3336 | | | C2 | 0.58 | 1 | 0.58 | 13.22 | 0.0027 | | | D2 | 0.080 | 1 | 0.080 | 1.83 | 0.1975 | | | Residual | 0.62 | 14 | 0.044 | | | | | Lack of fit | 0.60 | 12 | 0.050 | 7.82 | 0.1188 | N | | Pure error | 0.013 | 2 | 6.421×10⁻³ | | | | | Total | 3.08 | 25 | | | | | | R2 | 0.7999 | R2 adjustment | 0.6927 | RSNR | 8.562 | |
|
查看原文
表 4最优工艺方案及模型验证
Table4. Optimal process plan and model verification
| Condition | No. | Laser powerpercentage /% | Scanningpitch /mm | Layerthickness /mm | Scanning speed /(mm·s-1) | PredictedS /% | RealS /% | Predictederror /% |
|---|
| 1 | 50 | 0.12 | 0.19 | 2200 | 0.538 | | | | 2 | 50 | 0.12 | 0.19 | 2199.98 | 0.540 | | | | Optimal | 3 | 50 | 0.12 | 0.18 | 2200 | 0.541 | 0.53 | 5.0 | | 4 | 50 | 0.12 | 0.20 | 2200 | 0.558 | | | | 5 | 50 | 0.12 | 0.17 | 2200 | 0.568 | | | | Verification | 6 | 30 | 0.2 | 0.15 | 2000 | 1.958 | 1.837 | 6.2 | | 7 | 40 | 0.16 | 0.25 | 1800 | 1.436 | 1.39 | 3.2 |
|
查看原文
鄢然, 李浩, 李军超, 朱丽. 基于响应面法的聚苯乙烯粉末选择性激光烧结成型工艺参数优化[J]. 中国激光, 2019, 46(3): 0302015. Ran Yan, Hao Li, Junchao Li, Li Zhu. Process Parameters Optimization of Polystyrene Powder Selective Laser Sintering Based on Response Surface Methodology[J]. Chinese Journal of Lasers, 2019, 46(3): 0302015.


 PDF全文
PDF全文

