Photonics Research, 2019, 7 (9): 09001003, Published Online: Aug. 9, 2019
Acousto-optical modulation of thin film lithium niobate waveguide devices  Download: 883次
Figures & Tables
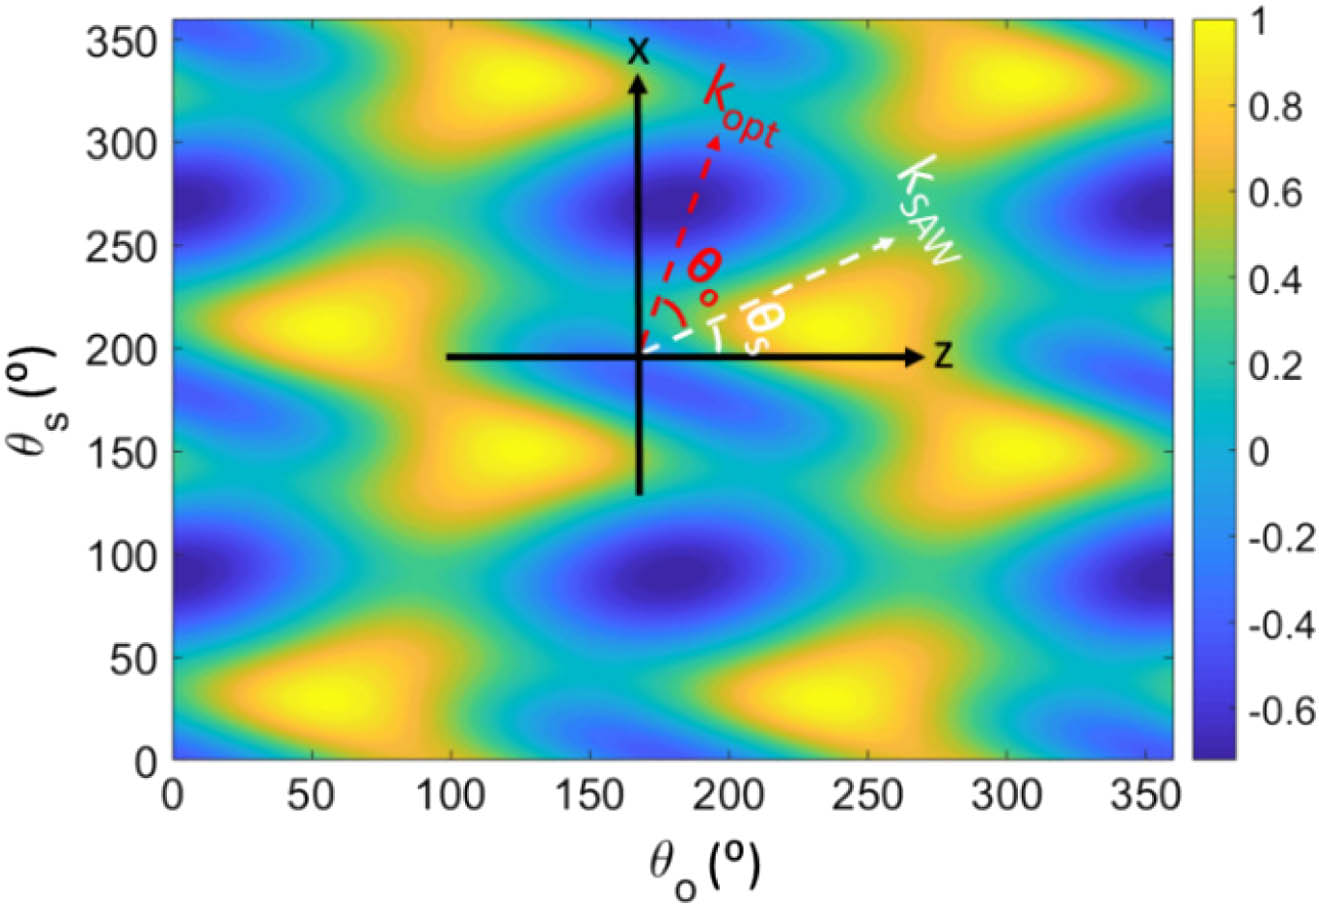
Fig. 2. (a) Cross-section rendering of the AO modulator. Note that dimensions are not to scale and the actual SAW of this implementation propagates more deeply in the substrate. (b) and (c) Schematic layouts of MZI- and resonator-type AOMs. Light (green arrows) is coupled to/from the chip by grating couplers. An SAW is launched by the split IDT, and its amplitude is enhanced in the cavity formed by the reflectors (acting as acoustic mirrors). Drawings are conceptual renderings and not to scale. The acoustic cavity (black dashed line) is much larger than the MZI and RT resonators (1.2 mm × 5.7 mm 2.4 mm × 6.2 mm

Fig. 3. Dependence of the (a) first and (b) second derivative of transmission T ϕ a r

Fig. 4. Microscope pictures of (a) MZI- and (b) resonator-type AOMs. (c) SEM image of the photonic waveguide (tilted view). (d) SEM image of the IDT region (top view).

Fig. 5. (a) Measurement setup for characterizing AOM. PC, polarization controller; RF SG, RF signal generator; DUT, device under test; EDFA, erbium-doped fiber amplifier; PD, photodetector; SA, spectrum analyzer. (b) Detected modulation power (normalized to the maximum) of the first harmonic when the frequency of RF SG is swept. The Q factor of the acoustic cavity is 1800. (c) Measured (triangle) and theoretical (solid line) first, second, and third harmonic signals as functions of the square root of the driving power from the RF SG when the frequency is fixed at 111.725 MHz. All are normalized to the maximum first harmonic modulation power of − 34 dBm p eff a p

Fig. 6. (a) Transmission of the RT resonator for a broad wavelength range. (b) Measured (blue circle) and Lorentzian fit (red) transmission of one of the resonances around 1601.53 nm. Inset: mode profile of the fundamental TE-like mode.

Fig. 7. (a) Measured (triangle) and theoretical (solid line) first and seconnd harmonic signals as functions of the square root of the driving power from RF SG. All are normalized to the maximum first harmonic modulation power of − 71.4 dBm P e

Fig. 8. Displacement components (a) u z u y S 3 = ∂ u z / ∂ z S 2 = ∂ u y / ∂ y z ′ y ′ S 3 S 2 S 3 y ′ = 0

Fig. 9. Refractive index ellipsoid of LN. x – y – z k SAW x – z θ S z θ O k opt k SAW

Fig. 10. Primary (blue) and effective (red) photo-elastic coefficient tensor elements (a) p 21 − p 26 p 31 − p 36


Lutong Cai, Ashraf Mahmoud, Msi Khan, Mohamed Mahmoud, Tamal Mukherjee, James Bain, Gianluca Piazza. Acousto-optical modulation of thin film lithium niobate waveguide devices[J]. Photonics Research, 2019, 7(9): 09001003.


 PDF全文
PDF全文

