Photonics Research, 2019, 7 (9): 09001042, Published Online: Aug. 13, 2019   

Simultaneous dual-contrast three-dimensional imaging in live cells via optical diffraction tomography and fluorescence Download: 644次

Author Affiliations
1 Nanophotonics Research Centre, Shenzhen Key Laboratory of Micro-Scale Optical Information Technology, Shenzhen University, Shenzhen 518060, China
2 Department of Chemistry and Physics, La Trobe Institute for Molecular Science (LIMS), La Trobe University, Melbourne, Victoria 3086, Australia
3 Department of Optics and Optical Engineering, Anhui Key Laboratory of Optoelectronic Science and Technology, University of Science and Technology of China, Hefei 230026, China
4 Department of Biochemistry and Genetics, La Trobe Institute for Molecular Science (LIMS), La Trobe University, Melbourne, Victoria 3086, Australia
5 Australian Research Council (ARC), Centre of Excellence in Advanced Molecular Imaging, Australia
6 Istituto Italiano di Tecnologia, Genova 16163, Italy
7 School of Physics, University of Melbourne, Victoria 3010, Australia
8 School of Engineering, RMIT University, Melbourne, Victoria 3001, Australia
9 Microvision and Microdiagnostic Group (SCI STI CHD), Ecole Polytechnique Fédérale de Lausanne (EPFL), 1015 Lausanne, Switzerland
10 Laboratory for Cellular Imaging and Energetics, Biological and Environmental Sciences and Engineering Division, King Abdullah University of Science and Technology (KAUST), Thuwal 23955-6900, Saudi Arabia
11 Joint International Research Unit in Neurodevelopment and Child Psychiatry, CHUV, Département de Psychiatrie, Lausanne, Switzerland, Université Laval, Québec, Canada
12 Institut universitaire en santé mentale de Québec, Québec, Canada
13 Centre d’optique, photonique et laser, Department of Psychiatry and Neuroscience, Université Laval, 2375 rue de la Terrasse, Québec, QC G1V 0A6, Canada
14 e-mail: xcyuan@szu.edu.cn
15 e-mail: christian.depeursinge@epfl.ch
16 e-mail: Pierre.Marquet@neuro.ulaval.ca
17 e-mail: s.kou@latrobe.edu.au
Figures & Tables

Fig. 1. Comparison of the 2D and 3D diffracted field using Fourier relationship. (a) 3D light field of a cell, shown as different planes of wavefront information; (b) 2D light field of a cell extracted from (a); (c) 3D and (d) 2D Fourier spectrum of the light fields. Under Fourier operation, a “slice” of the diffracted field results in a 2D spectrum as shown in (d), whereas the entire volumetric diffracted field results in a 3D “spherical cap,” as shown in (c).

下载图片 查看原文

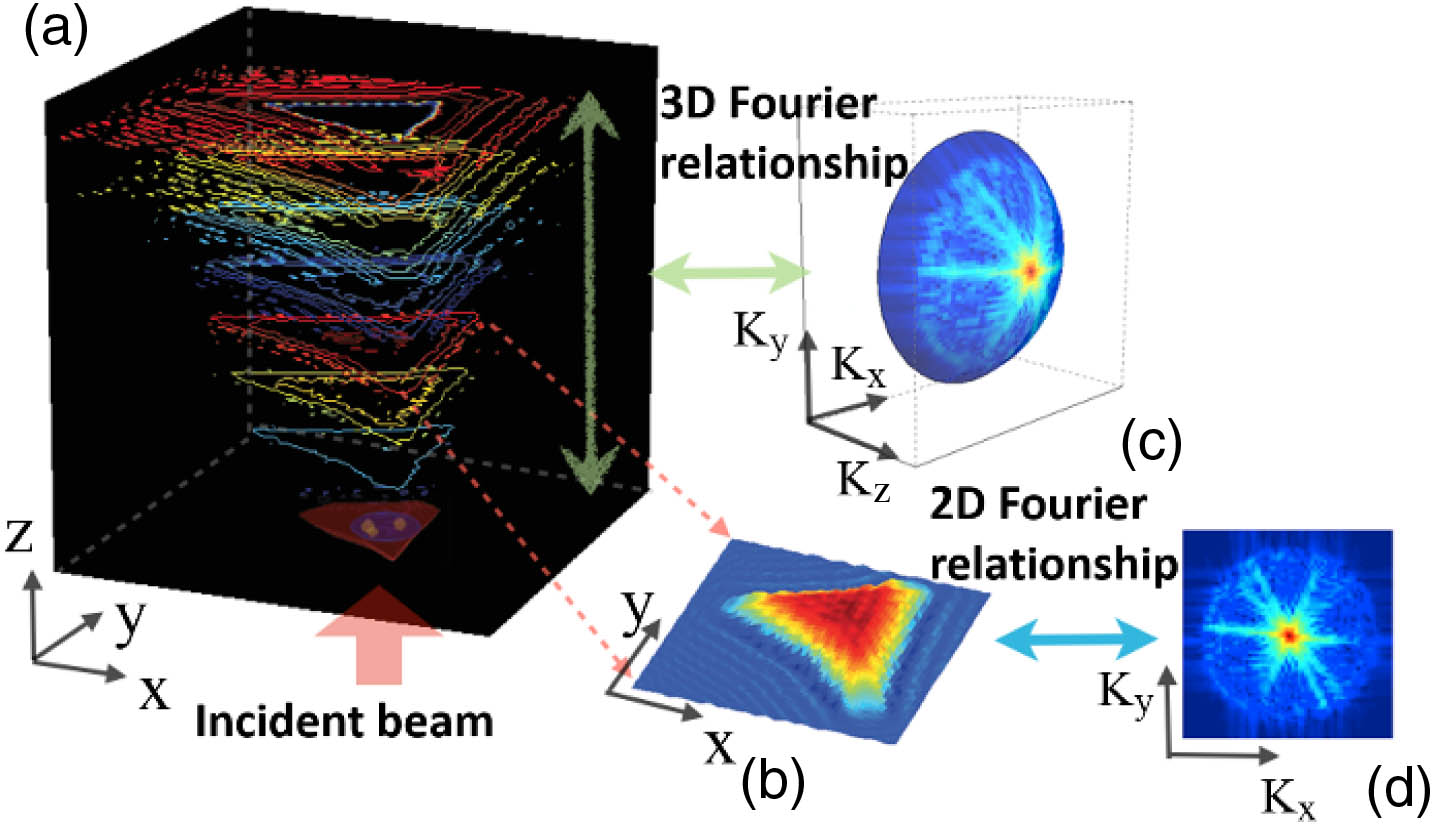
Fig. 2. Complex spectra synthesis of the scattering potential using three example angles. (a) A cell is subject to a multiangle plane-wave illumination with a maximum subtended half-angle θ; hence, N.A.=sinθ. The 3D angular spectra under different incident angles can be acquired (only three angles shown). (b) 2D side view of the angular compensation method introduced during the synthesis of the 3D angular spectrum (only three angles shown). The green arc represents the center reference cap, the red and blue arcs represent the “compensated” caps from incident angles θ and θ, respectively. ΔFz is the amount of shift in axial direction for the incident angle θ. (c) 3D view of a “synthesized” angular spectrum under three example angles. In (a), the center illumination and two maximum subtended angles illuminations formed three individual spherical caps in the Fourier domain as the 3D angular spectra. The respective 3D angular spectra are then translated and shifted accordingly, as shown in (b), so that angular information introduced in the incident beams is compensated. A synthesized angular spectrum for the three example angles is shown in (c), where all the 0th-order components coincide at a point.

下载图片 查看原文

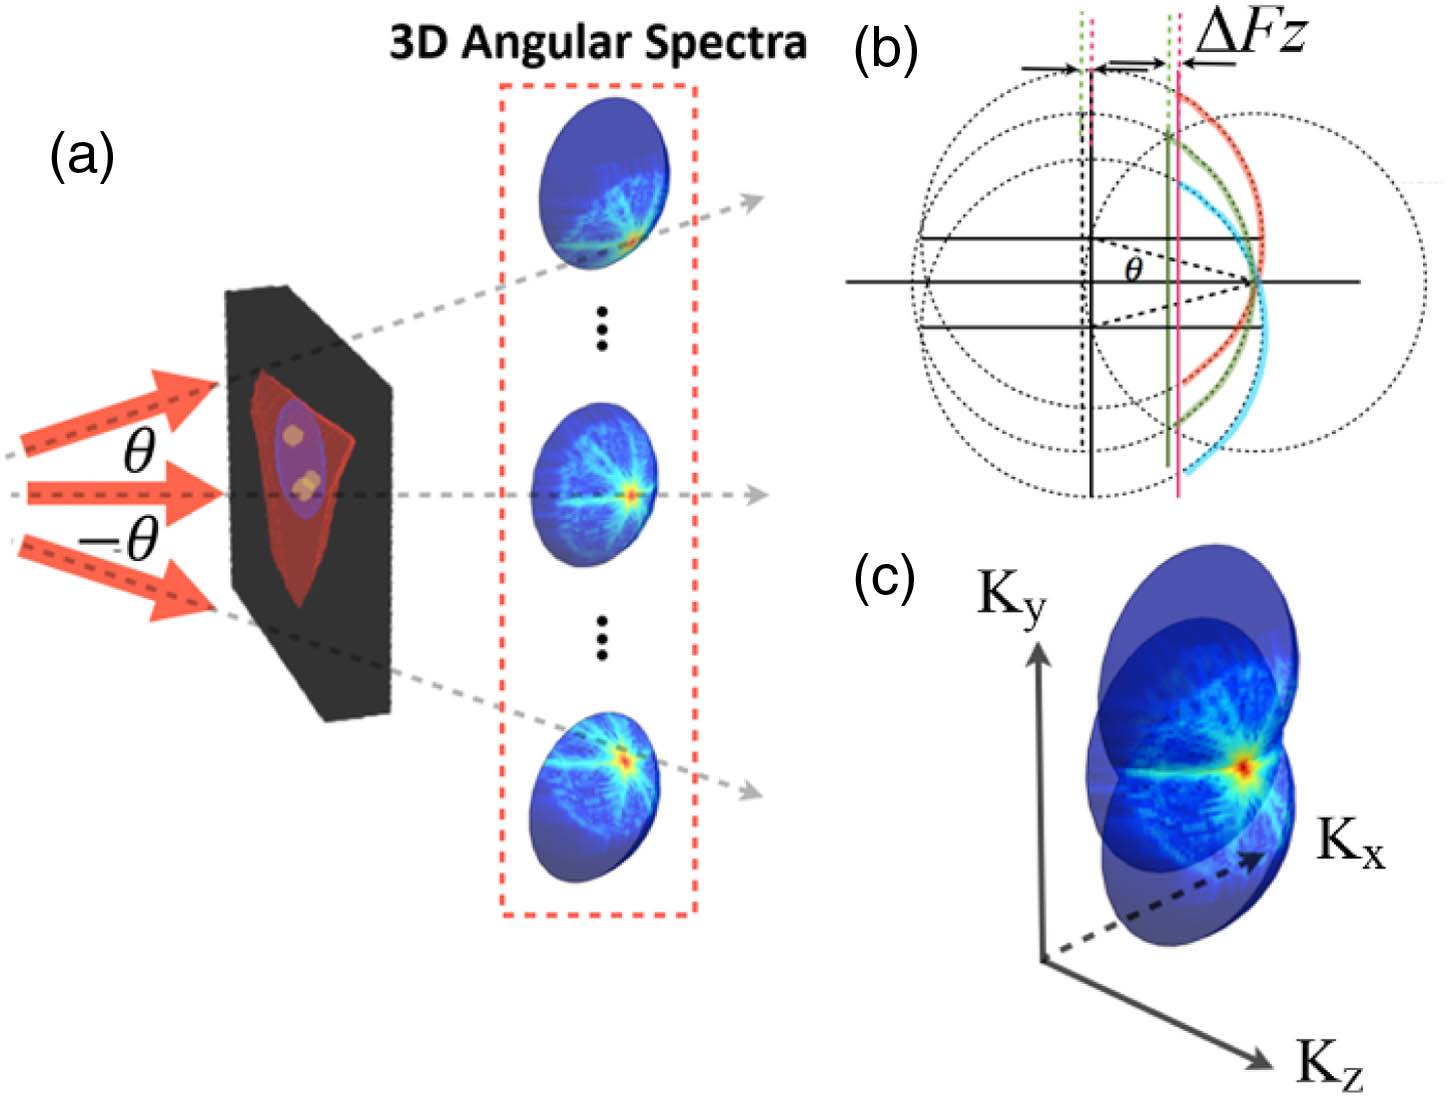
Fig. 3. Schematic diagram of the multimodal setup combining tomography with fluorescence. The tomography module is based on an off-axis digital holographic microscope setup in transmission. Different illumination angles are introduced by galvo mirror. The inset illustrates the tilted angle illumination situation. The fluorescence module is based on the epifluorescence microscopy. BS, beam splitter; GM, galvo mirror; SL, scanning lens; C, condenser; O, objective lens; TL, tube lens; Ex, excitation filter; Em, emission filter; DM, dichroic mirror.

下载图片 查看原文

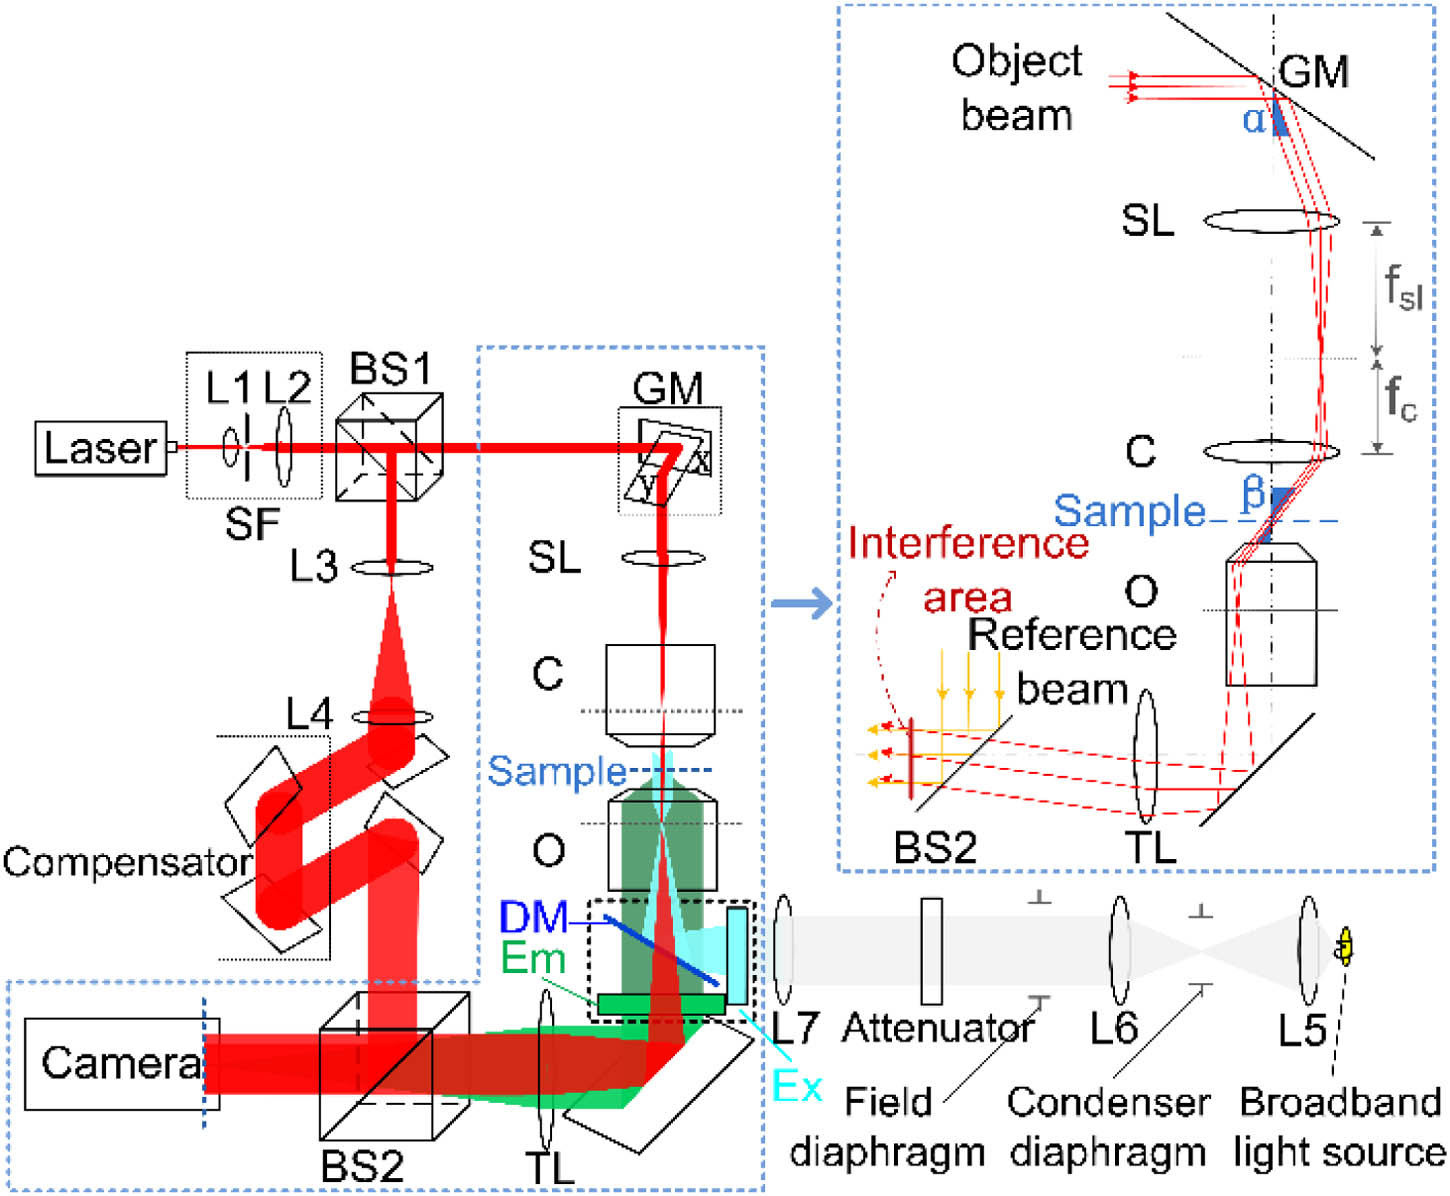
Fig. 4. Results for 3D reconstructions. (a) Buccal cell and (c) neuron, with internal structures delineated by groupings of refractive indices. The rotating views of the buccal cells and neuron can be found in Visualization 1 and Visualization 2, respectively. Optical phase distribution of the same (b) buccal cell (in dashed box) and (d) neuron calculated from the interferometric measurements. The units for the color bars in (b) and (d) are radians. Part of the buccal cell in (a) is removed for clear visualization of the subcellular structures. The magnification is 20× with an N.A. of 0.45.

下载图片 查看原文

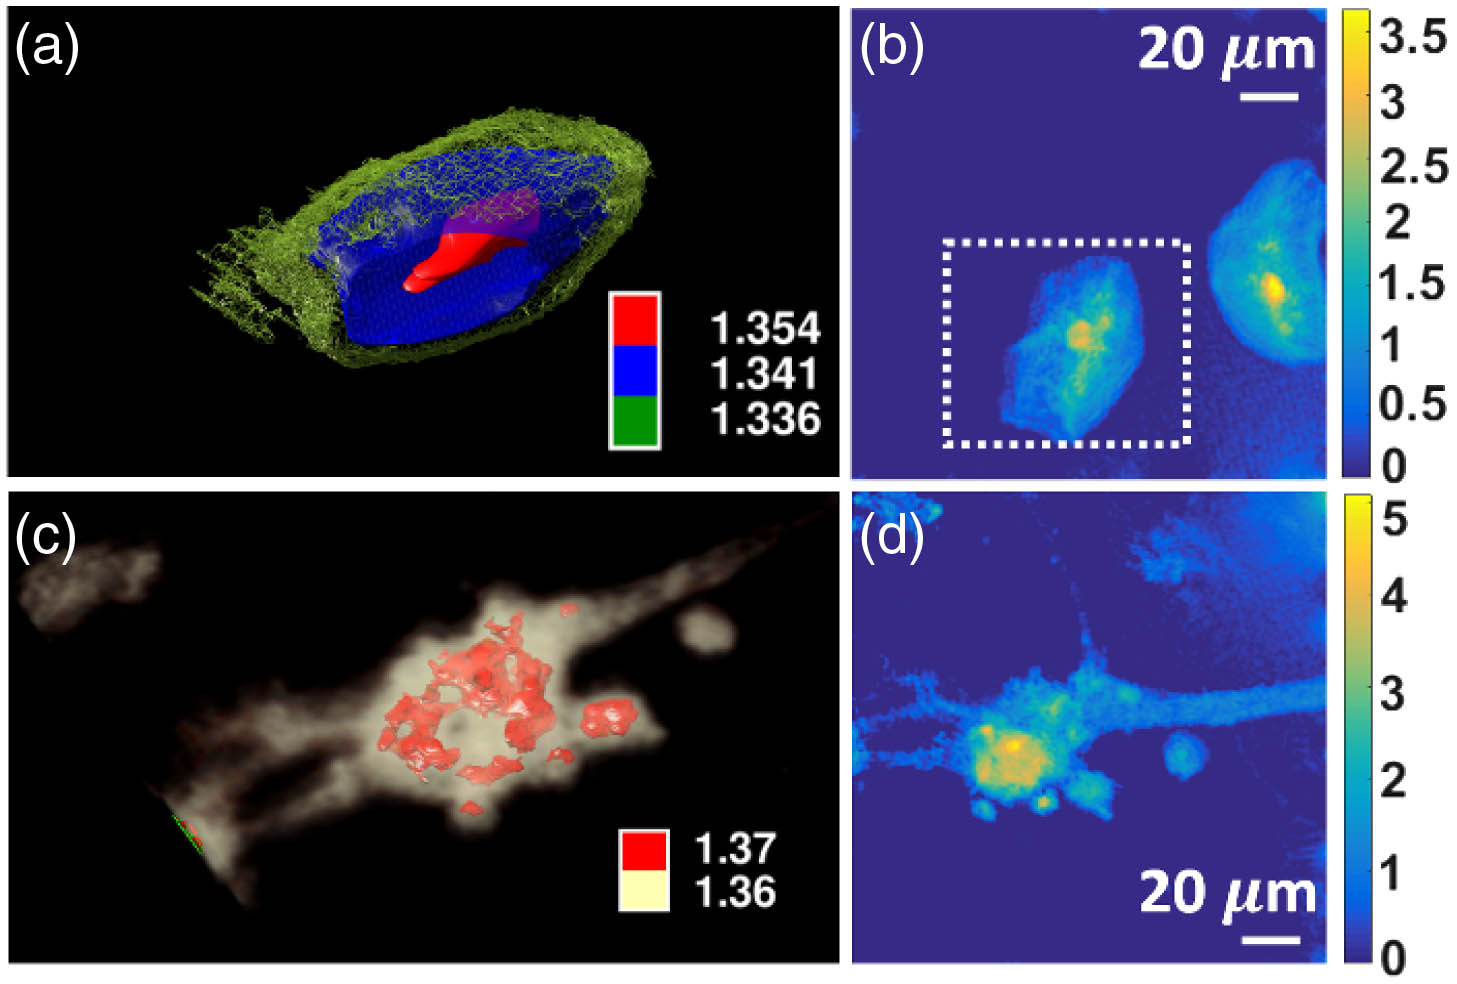
Fig. 5. Structures reconstructed using RI spatial mappings in apoptotic T cells are shown to be compatible with wide-field fluorescence counterparts. (a) Cells with internal structures delineated from groupings of RI values (top view). Inset gives an opened-up view of the cell through the central z plane of the nucleus. The rotating view of the cells can be found in Visualization 3. (b) 2D slice of RI distributions along xy plane; (c) wide-field fluorescence image of the same cells. The nuclear contents highlighted with blue contour lines in (b) are based on the intensity distributions of fluorescence in (c). The cell nuclei were stained with Hoechst dye. The value of RI in the range of 1.388–1.419 (pseudo-colored red orange) matches very well with what the fluorescent signal is showing, indicating that our technique is able to differentiate functional substructures within the cell. The magnification is 40× with an N.A. of 0.6.

下载图片 查看原文

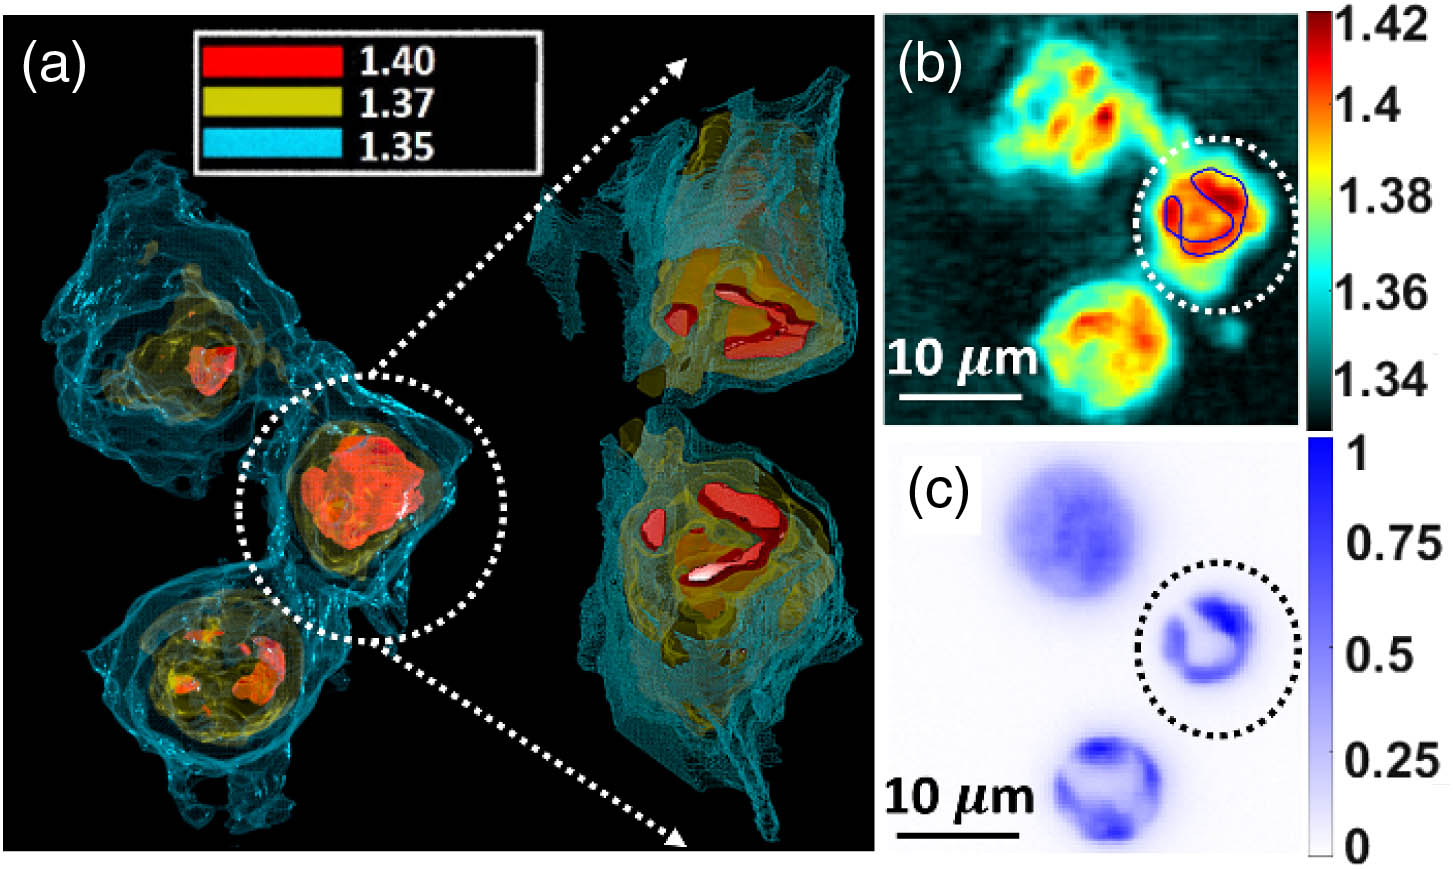
Fig. 6. Distributions of RI values (row 1) and fluorescence intensities (row 2) for Jurkat T cells under different conditions (scale bar, 10 μm). (a), (b) Viable cell; (c), (d) UV light-induced apoptotic cells with trovafloxacin treatment; (e), (f) necrotic cell. The positions of stained DNA, where many proteins are localized, are highlighted with blue contour lines in RI mappings based on fluorescence imaging. The magnification is 40× with an N.A. of 0.6.

下载图片 查看原文

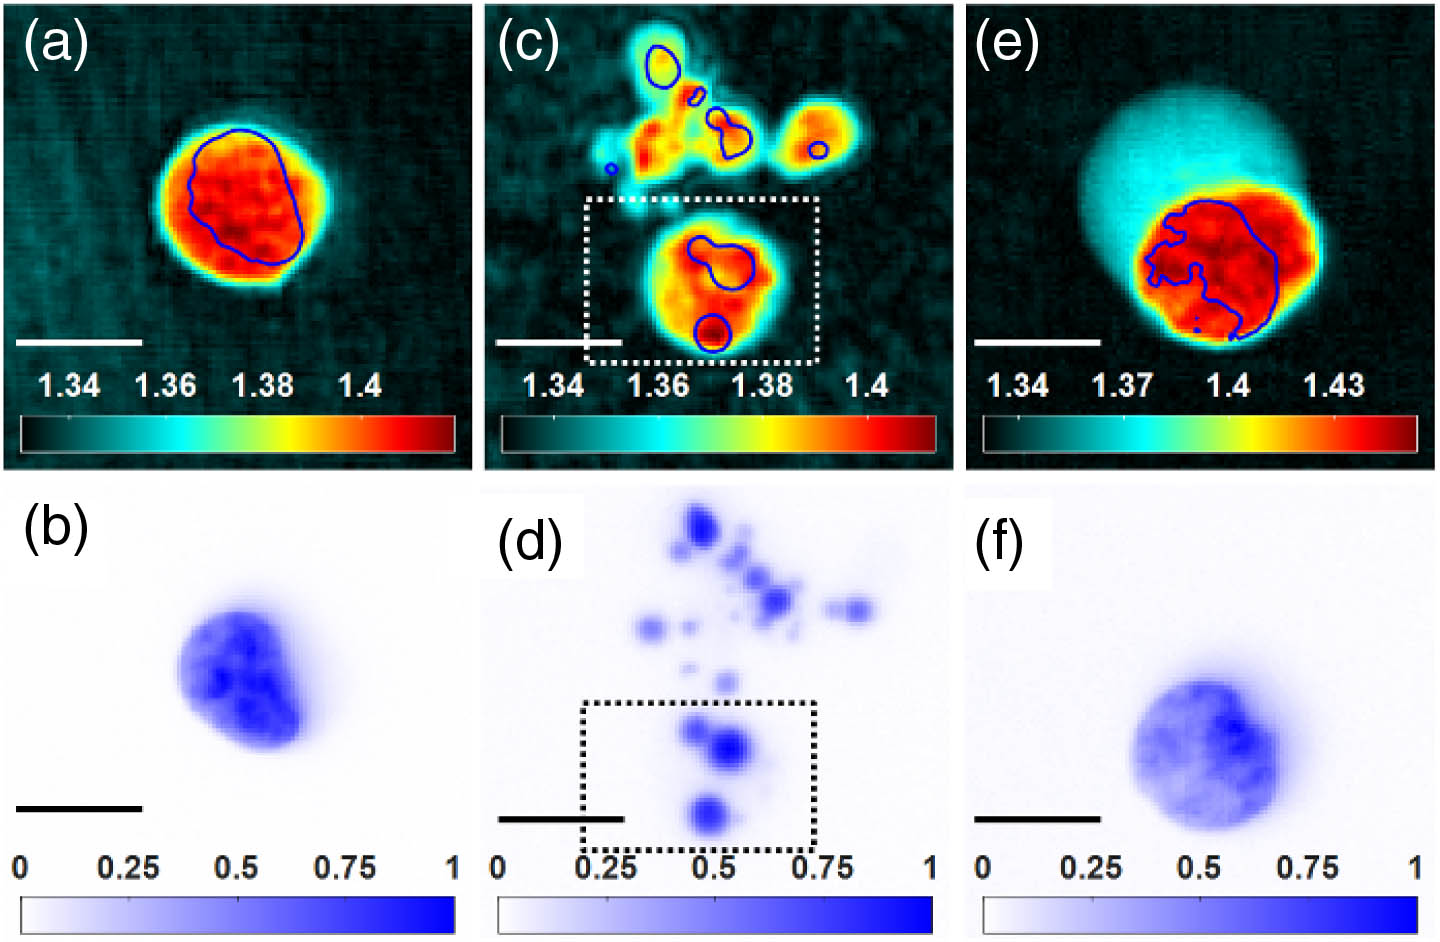
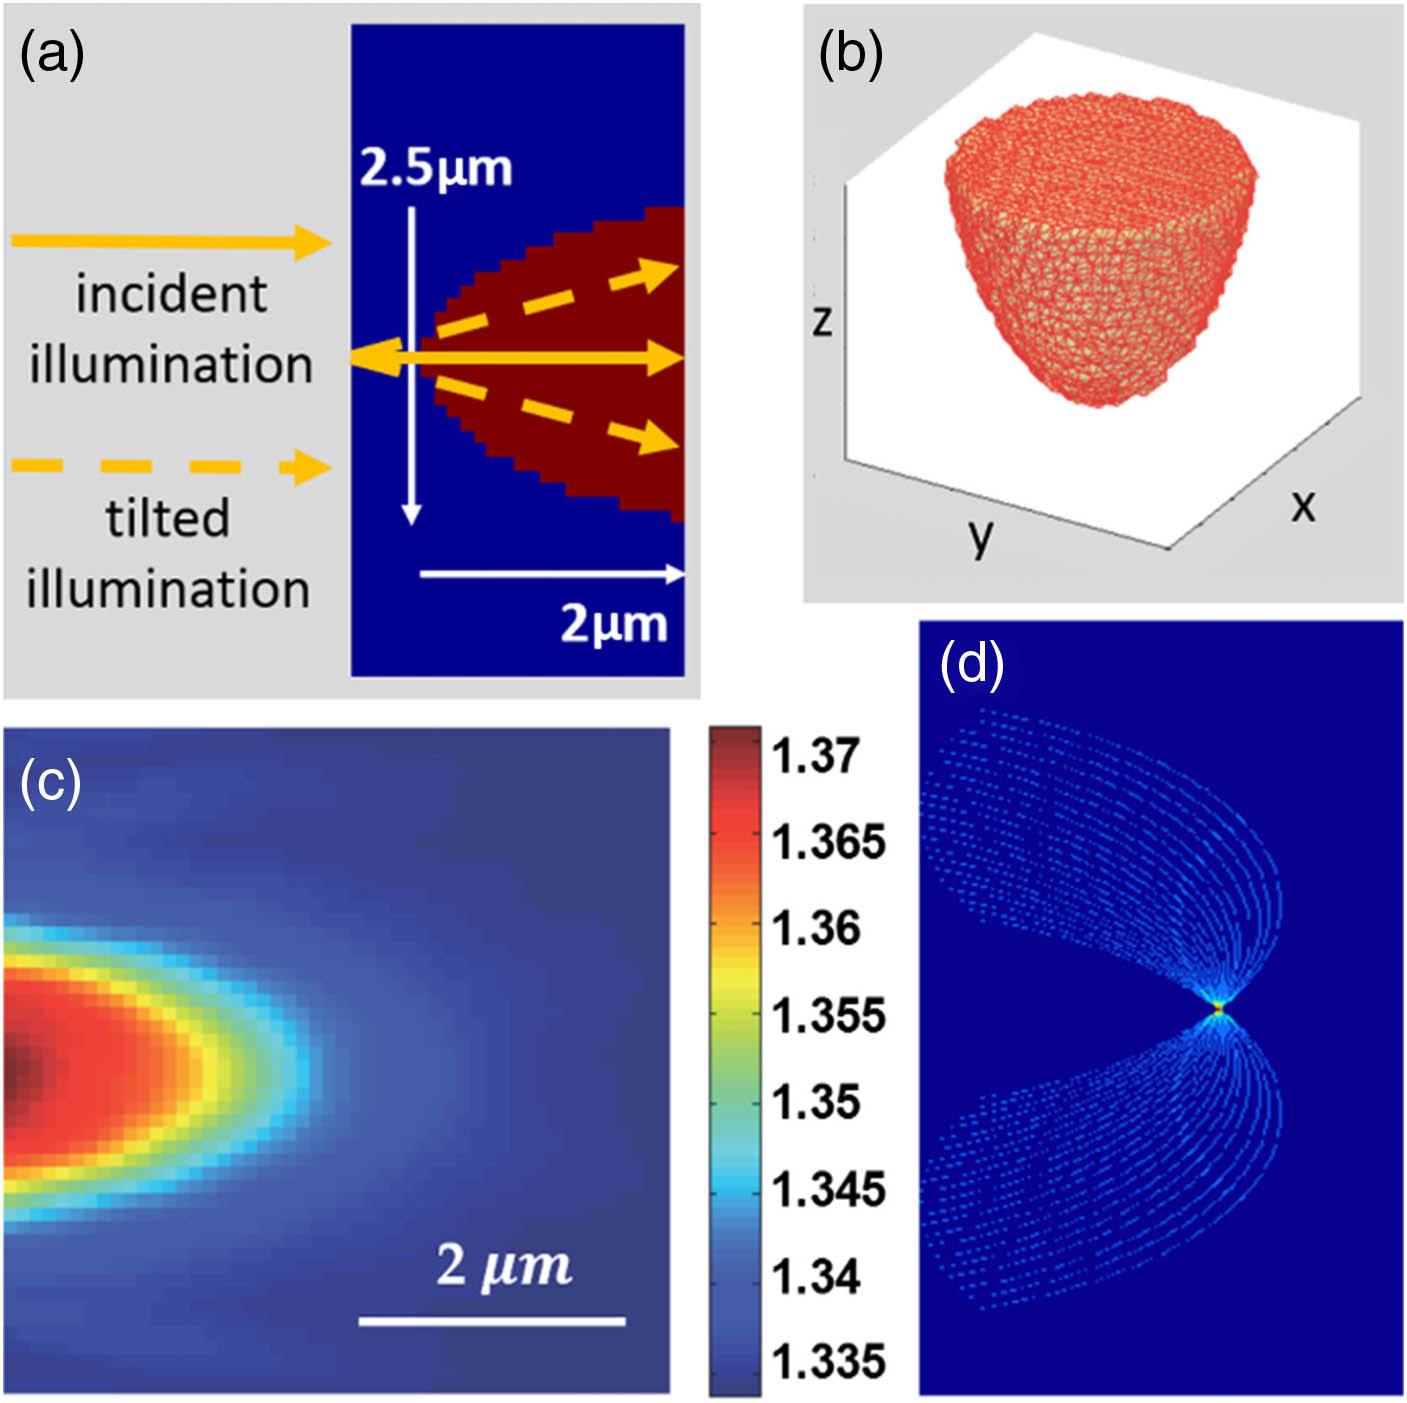
Fig. 7. Monte Carlo simulation of a phantom object volumetric diffraction and its quantitative reconstruction. (a) The configuration of the Monte Carlo simulation; (b) 3D view of the semispherical-shaped phantom object; (c) reconstructed RI distribution of the object in central yz plane; (d) cross section of the CTF (central fxfz plane), which is synthesized by 21 spherical Fourier caps.

下载图片 查看原文

Chen Liu, Michael Malek, Ivan Poon, Lanzhou Jiang, Arif M. Siddiquee, Colin J. R. Sheppard, Ann Roberts, Harry Quiney, Douguo Zhang, Xiaocong Yuan, Jiao Lin, Christian Depeursinge, Pierre Marquet, Shan Shan Kou. Simultaneous dual-contrast three-dimensional imaging in live cells via optical diffraction tomography and fluorescence[J]. Photonics Research, 2019, 7(9): 09001042.

本文已被 2 篇论文引用
被引统计数据来源于中国光学期刊网
引用该论文: TXT   |   EndNote

相关论文

加载中...

关于本站 Cookie 的使用提示

中国光学期刊网使用基于 cookie 的技术来更好地为您提供各项服务,点击此处了解我们的隐私策略。 如您需继续使用本网站,请您授权我们使用本地 cookie 来保存部分信息。
全站搜索
您最值得信赖的光电行业旗舰网络服务平台!