Intermodal four-wave mixing in silicon waveguides  Download: 526次
1 Department of Physics, University of Trento, Via Sommarive 14, 38123 Trento, Italy
2 SM Optics s.r.l., Research Programs, Via John Fitzgerald Kennedy 2, 20871 Vimercate, Italy
3 Department of Information Engineering, University of Brescia, Via Branze 38, 25123 Brescia, Italy
4 Centre for Materials and Microsystems, Fondazione Bruno Kessler, 38123 Trento, Italy
Figures & Tables
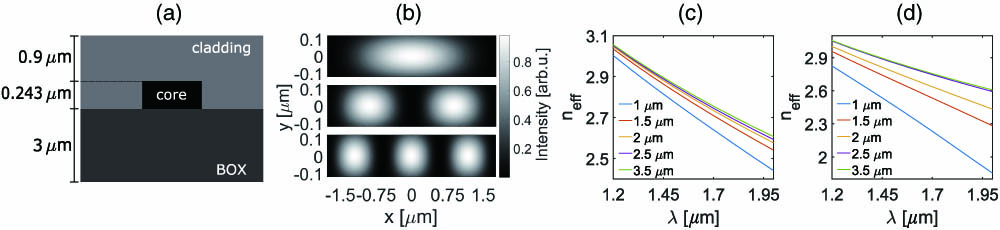
Fig. 1. (a) Cross section of the waveguides used in this work. BOX refers to the buried oxide. The core is made of crystalline Si, and the cladding by deposited SiO2. (b) Computed intensity profiles in the core region of the first three TE modes supported by a 3.5-μm-wide waveguide. (c) Effective index as a function of the wavelength for the first TE mode for the different waveguide widths reported in the legend. (d) Effective index as a function of the wavelength for the second TE mode for the different waveguide widths reported in the legend.
下载图片 查看原文
Fig. 2. Spectral dependence of the idler generation efficiency for the (1,1,1,1) intramodal FWM and for the (1,2,2,1) intermodal FWM. All waves have TE polarization. A silicon waveguide with a cross section 3.5 μm×243 nm was assumed in the calculation. Each efficiency is normalized to its maximum.
下载图片 查看原文
Fig. 3. Numerical simulation of Δk according to Eq. (4) for a 2-μm-wide waveguide with (1,2,2,1) intermodal combination and TE polarization. In grayscale, the Δk parameter is a function of the pump wavelength and the signal wavelength. The red line highlights the perfect phase-matching spectral position.
下载图片 查看原文
Fig. 4. Computed power coupled into the different modes of a waveguide by a tapered lensed fiber as a function of the fiber position with respect to the center of the waveguide. It is assumed a 3.5-μm-wide waveguide and 1 W at the input fiber with a wavelength of 1550 nm. When the fiber position is 0 μm, the fiber is in the middle of the waveguide. These values have been normalized with respect to the measured coupling losses for the first TE waveguide mode.
下载图片 查看原文
Fig. 5. Setup for the sFWM. The pump is initially filtered with two 1550 nm bandpass filters. Then, the pump and the signal, after a polarization controller stage, are mixed by a free-space beam splitter and coupled in the same tapered lensed fiber through a collimator. The input fiber injects the light in the desired waveguide on the SOI chip. The light is collected from the waveguide by another tapered lensed fiber. The position of both fibers is controlled by means of two XYZ nanopositioning stages via piezocontrollers. The collected light is analyzed with an OSA or a monochromator, depending on the power of the generated signal. In the inset, the waveguide modes involved in the intermodal FWM are sketched by showing the mode profiles at the input and at the output of the waveguide; as an example, the case of the (1,2,2,1) modal combination is considered. For the SFWM, the setup is exactly the same, except for the lack of the input signal.
下载图片 查看原文
Fig. 6. (a) Spectra of the SFWM in a 3.5-μm-wide waveguide, with the (1,2,2,1) combination and TE polarization. The pump is at 1550 nm. The different lines refer to the different positions of the output fiber: the blue line refers to the spectrum measured with the output fiber in the middle of the waveguide, and the red line refers to the spectrum measured with the output fiber at 1.1 μm with respect to the center of the waveguide. The two vertical arrows indicate a spurious signal due to Raman scattering occurring in the input fiber. (b) Intensity profile at the output facet of the waveguide, for the peak at 1469 nm in (a). (c) Intensity profile at the output facet of the waveguide, for the peak at 1640 nm in (a).
下载图片 查看原文
Fig. 7. Average on-chip photon generation rate for the SFWM process as a function of the on-chip average pump power. The blue circles are the experimental measurements, while the red line is the quadratic fit of the data belonging to the 0–0.5 mW range. The inset shows the low pump power region.
下载图片 查看原文
Fig. 8. (a) Spectrum of the sFWM with the (1,2,2,1) TE intermodal combination in a 3.5-μm-wide waveguide. The stimulating CW signal at 1640 nm is converted into the pulsed idler at 1469 nm. The smaller peaks are spurious signals due to the OSA. (b) Spectrum of the stimulated idler generation efficiency with the intermodal FWM combination (1,2,2,1) TE in a 3.5-μm-wide waveguide. The simulation was performed with a 3.66-μm-wide waveguide. The blue circles are the measured data, while the orange line is the simulation. This measurement was performed by synchronously scanning the signal wavelength and the monochromator wavelength in order to read the idler power corresponding to the input signal. The simulated spectrum was shifted by −3.3 dBm in order to match the experimental data.
下载图片 查看原文
Fig. 9. Phase-matched wavelengths as a function of the waveguide width for the (1,2,2,1) combination, TE polarization, and 1550 nm pump. The experimental idler and signal are reported in blue and red, respectively, while the corresponding simulated values are reported by the light blue and orange points, where the lines are a guide for the eye. The phase-matched signal wavelengths have been deduced by using Eq. (1) and the measured idler wavelengths. For some widths (those with the error bars), we performed repeated measurements (ten measurements) on nominally identical waveguides. The theory and the experiment are in agreement.
下载图片 查看原文
Fig. 10. Spectrum of the SFWM for the (1,2,2,1) combination, TE polarization, and a 2-μm-wide waveguide. The pump is at 1550 nm with an on-chip peak power of about 3.9 W (3.3 W on the first-order mode, 0.6 W on the second one). The idler is generated at 1202 nm. The peak at 1434 nm is the anti-Stokes peak of the Si Raman scattering. The two vertical arrows indicate the spurious signals due to Raman scattering occurring in the input fiber.
下载图片 查看原文
Fig. 11. Spectra of intermodal SFWM in a 3.8-μm-wide waveguide. Both TE and TM measurements are reported. The position of the output fiber is reported in the legend. The peaks refer to the indicated combinations. The pump is at 1550 nm.
下载图片 查看原文
Table1. Calculated Mode Field Overlap for a 3.5 μm×243 nm Si Waveguidea
| | | | (1,1,1,1) | 1 | 0 | | (2,2,2,2) | 0.997 | −0.023 | | (1,2,2,1) | 0.666 | −3.528 |
|
查看原文
Table2. Intermodal Combinations Measured in Fig. 11a
| Polarization | [nm] | [nm] | | (1,1,2,2) | TE | 1211 | 1205 | | (1,2,2,1) | TE | 1479 | 1479 | | (1,3,3,1) | TE | 1346 | 1340 | | (1,2,2,1) | TM | 1525 | 1531 | | (1,3,3,1) | TM | 1480 | 1492 |
|
查看原文
Stefano Signorini, Mattia Mancinelli, Massimo Borghi, Martino Bernard, Mher Ghulinyan, Georg Pucker, Lorenzo Pavesi. Intermodal four-wave mixing in silicon waveguides[J]. Photonics Research, 2018, 6(8): 08000805.


 PDF全文
PDF全文

