基于TDLAS技术测量高温环境中CO2的温度和浓度  下载: 1528次
Measurements of CO2 Temperature and Concentration in High Temperature Environment Based on Tunable Diode Laser Absorption Spectroscopy
浙江大学能源工程学院能源清洁利用国家重点实验室, 浙江 杭州 310027
图 & 表
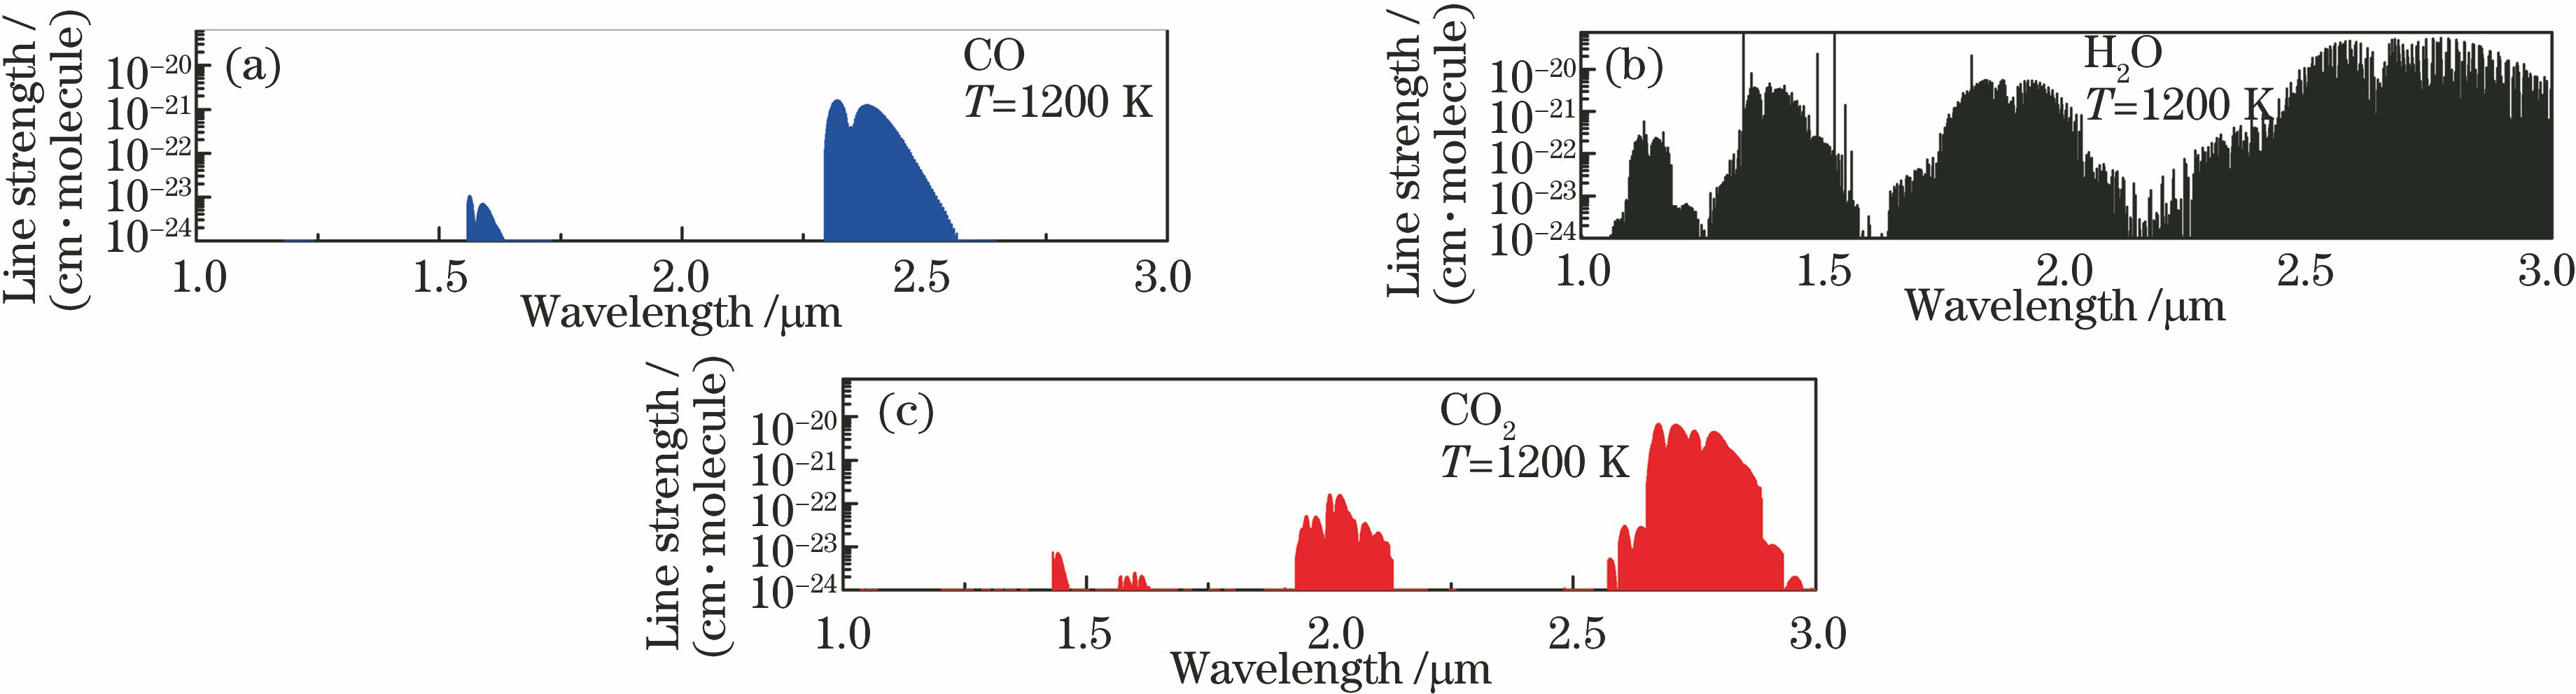
图 1. (a) CO,(b) H2O和(c) CO2在1~3 μm波长范围内的吸收谱线线强
Fig. 1. Absorption line strength of (a) CO, (b) H2O and (c) CO2 in the wavelength range of 1-3 μm
下载图片 查看原文
图 2. 模拟得到的吸收光谱
Fig. 2. Simulated absorption spectra
下载图片 查看原文
图 3. 谱线对的计算结果。(a)谱线对1;(b)谱线对2;(c)谱线对3
Fig. 3. Simulated results of line pairs. (a) Line pair 1; (b) line pair 2; (c) line pair 3
下载图片 查看原文
图 4. (a)谱线线强与温度的关系;(b)吸收谱线线强比值随温度变化以及谱线线强比值的温度敏感性
Fig. 4. (a) Variations of line strength with temperature; (b) line strength ratio and their sensitivity with temperature
下载图片 查看原文
图 5. 高温测量系统示意图
Fig. 5. Diagram of the high temperature measurement system
下载图片 查看原文
图 6. (a)光谱吸收信号以及采用Voigt线型函数进行多峰拟合的结果及(b)拟合残差
Fig. 6. (a) Spectral absorption signal and multi-peak fitting results using Voigt function and (b) fitting residual
下载图片 查看原文
表 1CO2吸收谱线的谱线参数
Table1. CO2 spectral absorption-line parameters
| Linepair | Centerwavenumberν0 /cm-1 | Centerwavelengthλ /nm | Line-intensityS0 (T= 900 K) /(10-7 cm-2·Pa-1) | Low transitionenergy E″/cm-1 |
|---|
| 1 | 4990.418 | 2003.8402 | 2.81 | 2462.6758 | | 4990.665 | 2003.7410 | 6.55 | 1276.4475 | | 2 | 4995.9702 | 2001.6132 | 4.33 | 1702.4031 | | 4995.9798 | 2001.6094 | 0.151 | 4059.1287 | | 4995.9844 | 2001.6075 | 4.9 | 1586.8582 | | 4996.1085 | 2001.5578 | 24.2 | 273.868 | | 3 | 5001.4987 | 1999.4007 | 22.7 | 519.535 | | 5001.9159 | 1999.2339 | 2.38 | 2193.5452 | | 5001.9468 | 1999.2216 | 1.48 | 2551.011 | | 5002.4869 | 1999.0057 | 21.8 | 578.0115 |
|
查看原文
表 2不同工况下测量得到的温度
Table2. Measured temperature under different operating conditions
| Volume fraction ofCO2/% | Measured temperature /K |
|---|
| 873 K | 973 K | 1073 K | 1173 K | 1273 K |
|---|
| 10 | 881.6 | 994.4 | 1087.8 | 1160.0 | 1260.1 | | 8 | 868.9 | 946.8 | 1055.6 | 1160.9 | 1284.6 | | 6 | 890.7 | 996.7 | 1100.3 | 1205.7 | 1241.6 | | 4 | 898.3 | 950.1 | 1042.1 | 1135.3 | 1228.6 |
|
查看原文
表 3测量得到的温度值与设定值的偏差
Table3. Deviation of measured temperatures with given temperature
| Volume fraction ofCO2 /% | Deviation /% |
|---|
| 873 K | 973 K | 1073 K | 1173 K | 1273 K |
|---|
| 10 | 0.98 | 2.20 | 1.38 | -1.11 | -1.01 | | 8 | -0.47 | -2.70 | -1.62 | -1.03 | 0.91 | | 6 | 2.03 | 2.44 | 2.55 | 2.79 | -2.47 | | 4 | 2.90 | -2.35 | -2.88 | -3.21 | -3.49 |
|
查看原文
表 4不同工况下测量得到的CO2的浓度
Table4. Measured CO2 concentration under different operating conditions
| Volume fraction ofCO2/% | Measured volume fraction of CO2 |
|---|
| 873 K | 973 K | 1073 K | 1173 K | 1273 K |
|---|
| 10 | 9.90 | 9.80 | 9.86 | 10.14 | 10.20 | | 8 | 8.12 | 8.15 | 8.09 | 8.17 | 8.14 | | 6 | 6.12 | 6.18 | 6.08 | 6.11 | 5.89 | | 4 | 4.12 | 3.87 | 3.89 | 3.85 | 3.87 |
|
查看原文
表 5不同工况下测量得到的CO2浓度值与设定值的偏差
Table5. Deviation of measured CO2 concentration with given value under different operating conditions
| Volume fraction ofCO2 /% | Deviation /% |
|---|
| 873 K | 973 K | 1073 K | 1173 K | 1273 K |
|---|
| 10 | -1.00 | -2.00 | -1.40 | 1.40 | 2.00 | | 8 | 1.50 | 1.88 | 1.13 | 2.13 | 1.75 | | 6 | 2.00 | 3.00 | 1.33 | 1.83 | -1.83 | | 4 | 3.75 | -3.25 | -4.75 | -3.75 | -3.25 |
|
查看原文
崔海滨, 王飞, 李玫仪. 基于TDLAS技术测量高温环境中CO2的温度和浓度[J]. 激光与光电子学进展, 2018, 55(5): 053003. Haibin Cui, Fei Wang, Meiyi Li. Measurements of CO2 Temperature and Concentration in High Temperature Environment Based on Tunable Diode Laser Absorption Spectroscopy[J]. Laser & Optoelectronics Progress, 2018, 55(5): 053003.


 PDF全文
PDF全文

