Photonics Research, 2019, 7 (6): 06000647, Published Online: May. 17, 2019   

Mode splitting revealed by Fano interference Download: 537次

Author Affiliations
1 State Key Laboratory of Applied Optics, Changchun Institute of Optics, Fine Mechanics and Physics, Chinese Academy of Sciences, Changchun 130033, China
2 University of Chinese Academy of Sciences, Beijing 100049, China
Figures & Tables

Fig. 1. (a) Lineshape comparison between Lorentz (red line) and Fano (blue dotted line) with the same Q-factor. (ω0,T0) is the extremum of the Lorentzian dip, and (ω1,T1), (ω2,T2) are the two extrema of Fano. (b) Schematic diagram of the add-drop coupling configuration used here and its optical spectral responses. κext and κexd denote the coupling rates of the in-through and add-drop fibers with the resonator, respectively. If there is the Rayleigh-scattering-induced unresolvable mode splitting, the add port shows an upward Lorentzian peak.

下载图片 查看原文

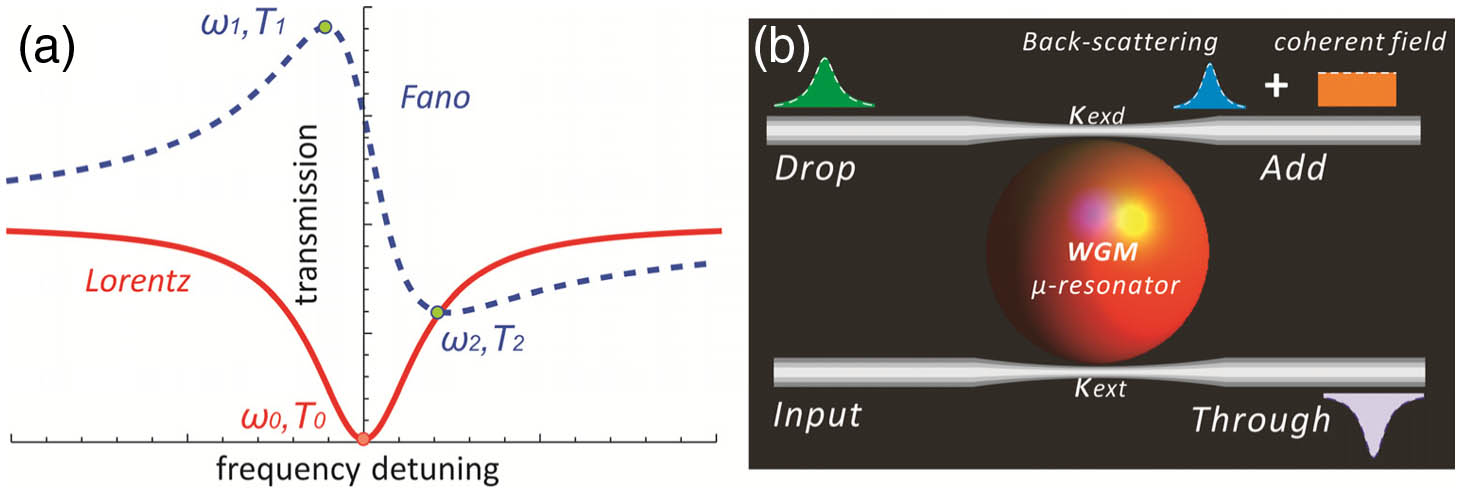
Fig. 2. (a) Dependence of the Fano profile on phase difference φ0. The black dot denotes the maximum, and the gray dot denotes the minimum. The extrema far away from the zero-detuning point are lost due to the limited plot range. (b) Fitted experimental results of a Fano periodical evolution. The fitting parameters are κ0=0.14  MHz and Ec0:αin=1.6. κext=1.92  MHz and κexd=2.4  MHz are uniquely determined by fitting the transmission spectrum and the Fano profile simultaneously. The Q-factor of this resonance is approximately 4.34×10⁷. (c), (d) Dependence of the frequency shift and intensity magnitude of the maximum, the minimum, and their difference on the amplitude ratio when φ0=8π/5. This phase is chosen as an example to illustrate the dependence, and for other phases except the integral multiple of π, the key points show similar dependence.

下载图片 查看原文

Fig. 3. (a)–(d) Transmitting (yellow) and back-scattering (green) spectral responses for different relative phases φ0. Solid lines are experimental results, and dotted lines are theoretical fittings. The mismatch is attributed to the laser power fluctuation and background modification induced by the fiber connectors. The parameters used in fitting are κ0=10.8  MHz, g=0.52  MHz, Γ=0.18  MHz, Ec0=0.985 normalized to the input field intensity, and κexd=3.7  MHz and κext=15.2  MHz are slightly changed due to vibration-induced coupling condition changes. The Q-factors are approximately 6.43×10⁶ for the symmetrical mode and 6.51×10⁶ for the asymmetrical mode, respectively. Note that to achieve an unresolved doublet caused by a machining defect, a new microsphere resonator with a similar diameter was utilized. (e) Back-scattering spectral responses for different coherent field intensities (0.138, 0.196, and 0.285 normalized to the input field intensity) with a relative phase φ0 around 0.5π. The profile becomes easily identifiable and immune against noise as the intensity increases. (f) Dependence of the intensity difference |TmaxTmin| on the amplitude ratio. The red dotted line is the theoretical result using the experimental parameters.

下载图片 查看原文

Fig. 4. Frequency difference between the two extrema of the Fano-based doublet for φ0=0. Here 2g starts from 0.2 MHz, Γ=0.05g, and κext equals 0.4, 14.5, and 20 for under-, critical-, and over-coupling conditions, respectively, and other parameters are the same as in the experiment. The fitting curves are 8.56+0.061×(2g)1.787, 16.66+0.037×(2g)1.781, and 19.82+0.032×(2g)1.781, respectively. The length of the fitting curve denotes the range 2gΓ+κext+κext+κ0 for each condition.

下载图片 查看原文

Yue Wang, Hongchun Zhao, Yancheng Li, Fengfeng Shu, Mingbo Chi, Yang Xu, Yihui Wu. Mode splitting revealed by Fano interference[J]. Photonics Research, 2019, 7(6): 06000647.

本文已被 1 篇论文引用
被引统计数据来源于中国光学期刊网
引用该论文: TXT   |   EndNote

相关论文

加载中...

关于本站 Cookie 的使用提示

中国光学期刊网使用基于 cookie 的技术来更好地为您提供各项服务,点击此处了解我们的隐私策略。 如您需继续使用本网站,请您授权我们使用本地 cookie 来保存部分信息。
全站搜索
您最值得信赖的光电行业旗舰网络服务平台!