基于YOLOV3改进的实时车辆检测方法  下载: 1416次
Improved Real-Time Vehicle Detection Method Based on YOLOV3
江苏大学汽车与交通工程学院, 江苏 镇江 212013
图 & 表
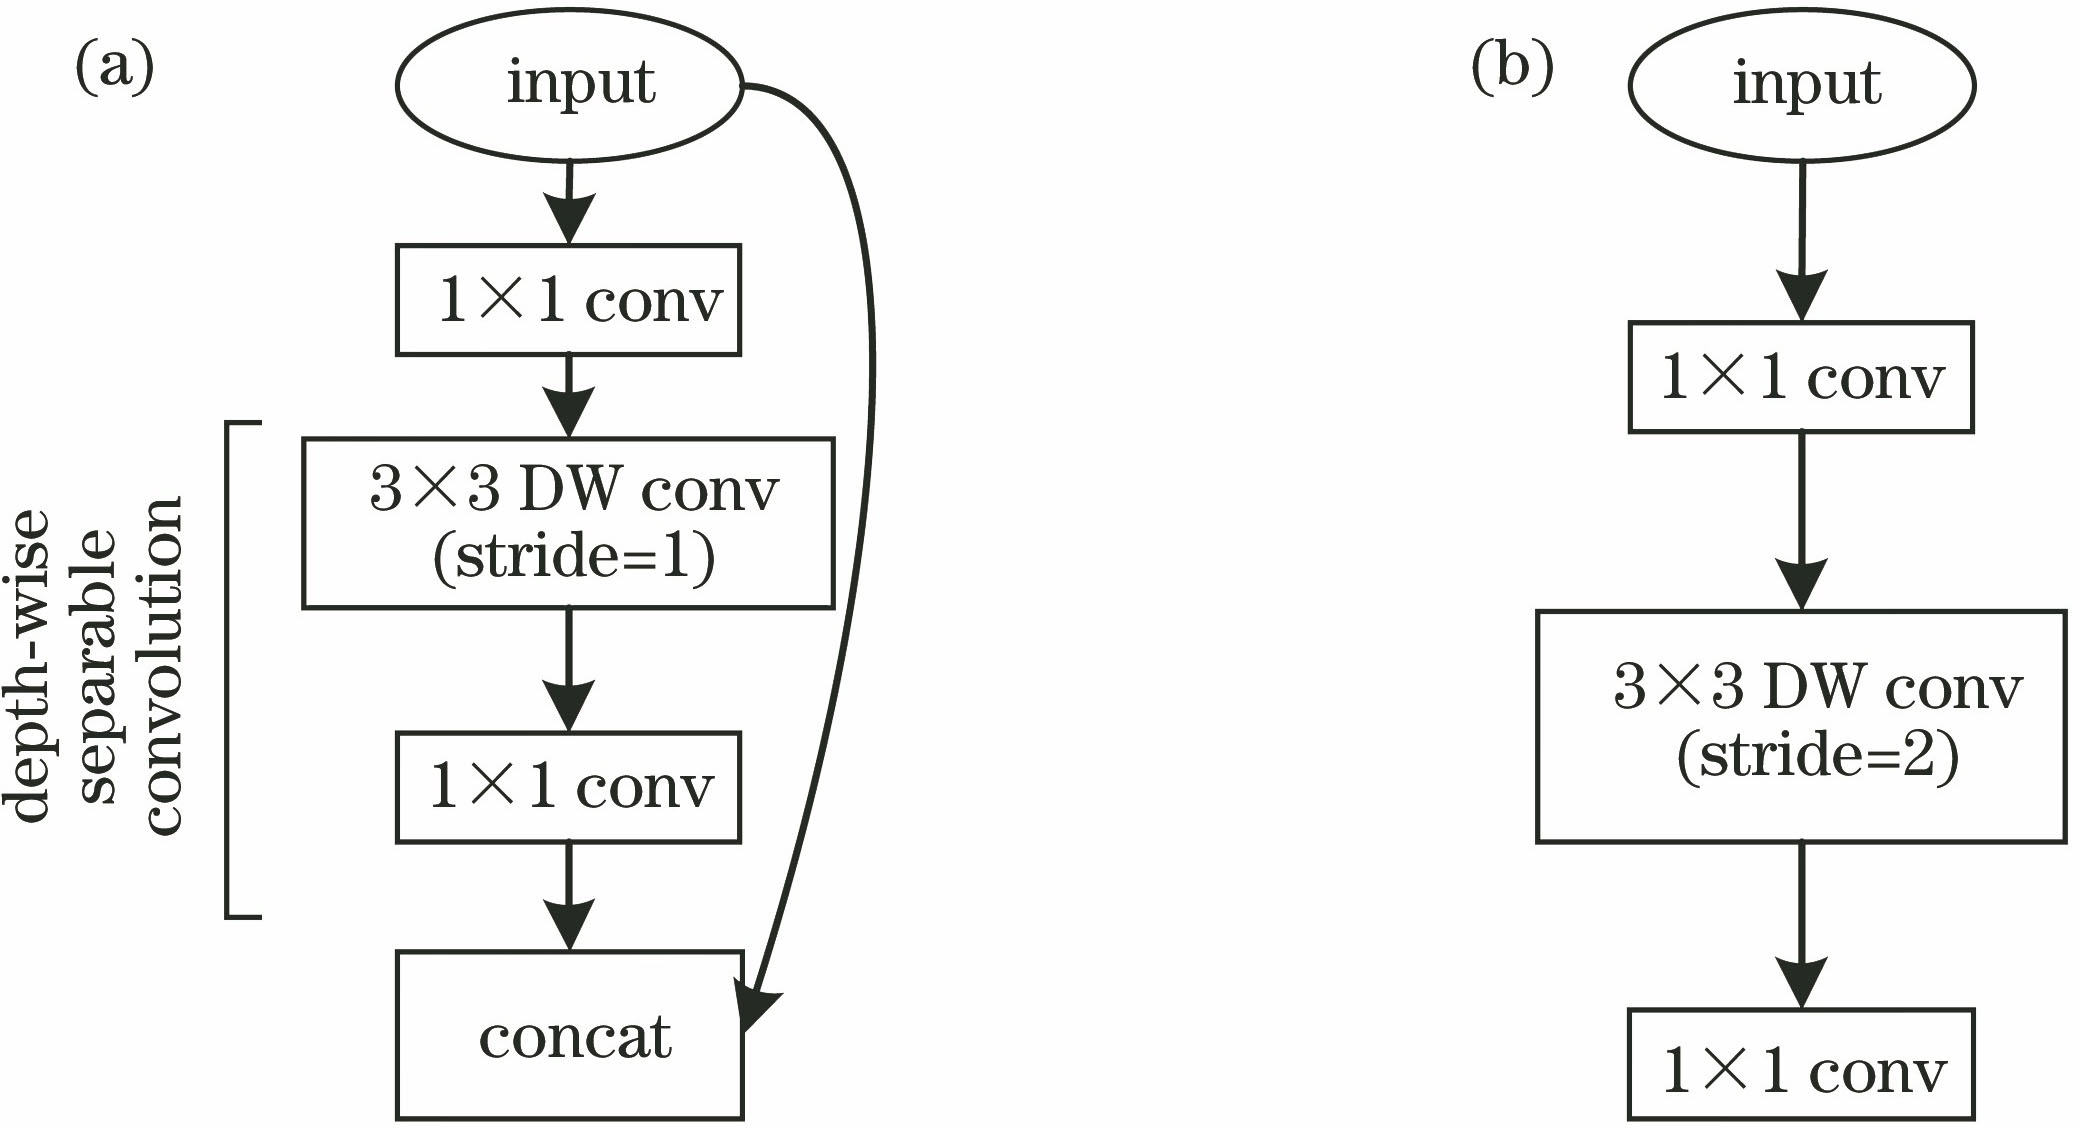
图 1. 反残差网络。(a)步长为1;(b)步长为2
Fig. 1. Inverted residual network. (a) Stride is 1; (b) stride is 2
下载图片 查看原文
图 2. 网络最后三层不同尺寸特征图。(a) 52×52;(b) 26×26;(c) 13×13
Fig. 2. Feature maps of different sizes in the last three layers of network. (a) 52×52; (b) 26×26; (c) 13×13
下载图片 查看原文
图 3. 改进后的网络结构
Fig. 3. Improved network structure
下载图片 查看原文
图 4. 不同模型的P-R曲线
Fig. 4. P-R curves for different models
下载图片 查看原文
图 5. 模型在不同场景下的检测结果。(a)原图;(b) YOLOV3检测结果;(c)本文改进后的模型检测结果
Fig. 5. Model detection results in different scenarios. (a) Original images; (b) detection results of YOLOV3; (c) detection results of improved model
下载图片 查看原文
表 1不同模型的网络层数及大小对比
Table1. Comparison of network layers and sizes of different models
| Model | Layer | Parameter | Size /MB |
|---|
| SSD | 88 | 27188676 | 103 | | YOLOV2 | 75 | 50983561 | 194 | | YOLOV3 | 256 | 61587112 | 235 | | Proposed | 223 | 22314120 | 85.6 |
|
查看原文
表 2不同改进策略对mAP的影响
Table2. Influence of different improvement strategies on mAP
| Improvement strategy | Inverted residuals | GN | SoftNMS | Focal-loss |
|---|
| Change of mAP /% | -3.17 | 1.15 | 1.39 | 1.78 |
|
查看原文
表 3不同模型检测结果对比
Table3. Comparison of test results of different models
| Model | mAP /% | Time /ms |
|---|
| SSD | 89.88 | 48.8 | | YOLOV2 | 89.60 | 30.2 | | YOLOV3 | 91.91 | 42.3 | | Proposed | 93.06 | 28.5 |
|
查看原文
李汉冰, 徐春阳, 胡超超. 基于YOLOV3改进的实时车辆检测方法[J]. 激光与光电子学进展, 2020, 57(10): 101507. Hanbing Li, Chunyang Xu, Chaochao Hu. Improved Real-Time Vehicle Detection Method Based on YOLOV3[J]. Laser & Optoelectronics Progress, 2020, 57(10): 101507.


 PDF全文
PDF全文

