基于微通道板的单光子激光测高技术研究  下载: 1055次封面文章
Photon-Counting Laser Altimetry Based on Microchannel Plate
1 中国科学院西安光学精密机械研究所, 陕西 西安 710119
2 中国科学院大学, 北京 100049
图 & 表
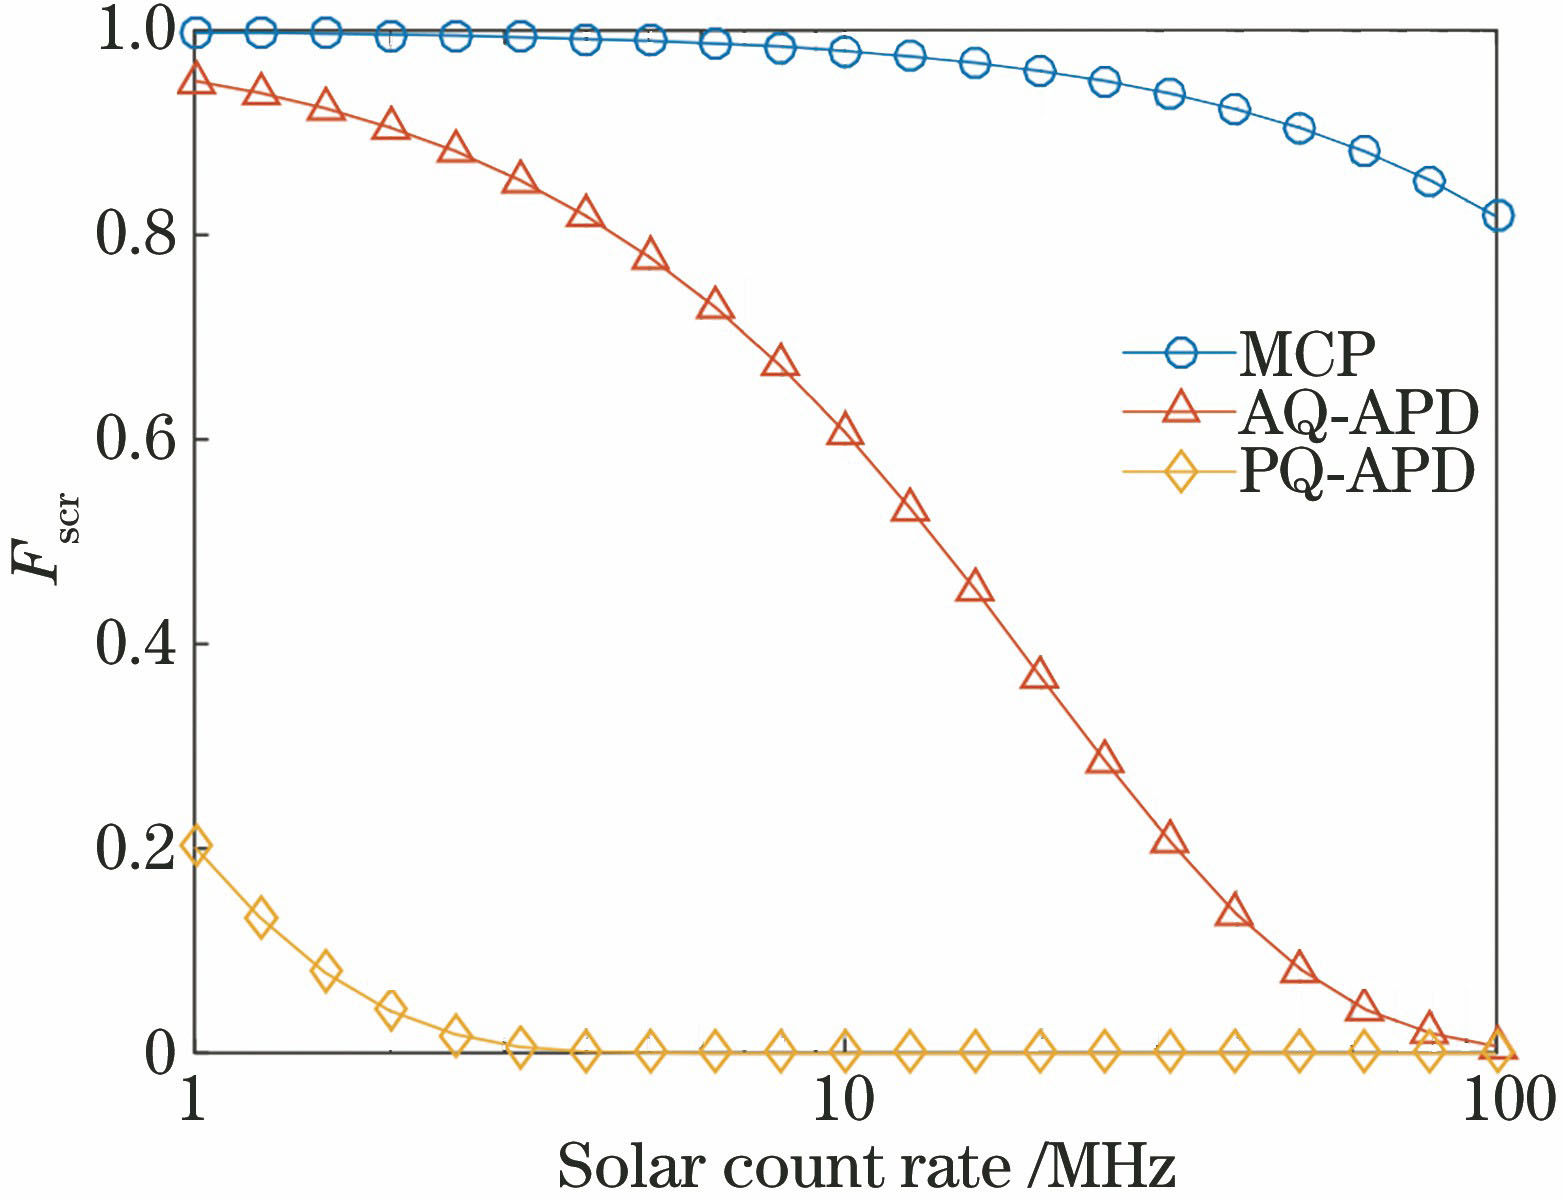
图 1. 探测器的计数率下降因子
Fig. 1. Signal count reduction factor of different detectors
下载图片 查看原文
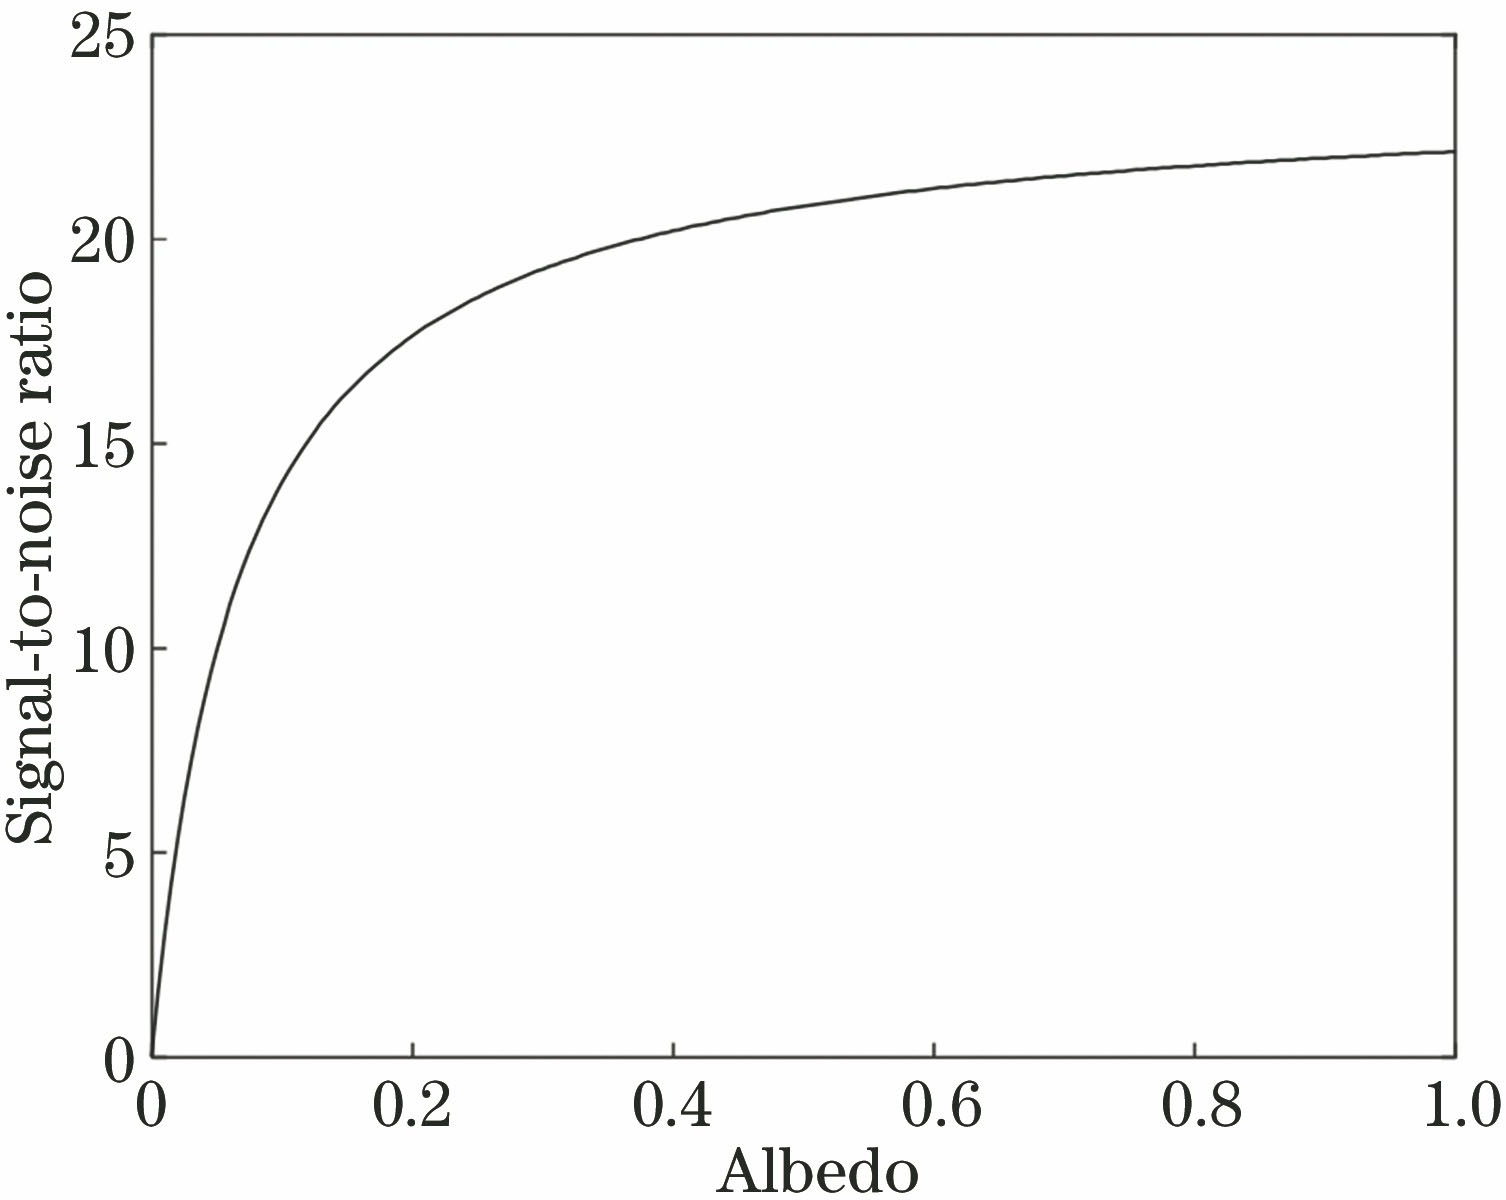
图 2. 反射率和信噪比的关系
Fig. 2. Relationship between signal-to-noise ratio and albedo
下载图片 查看原文
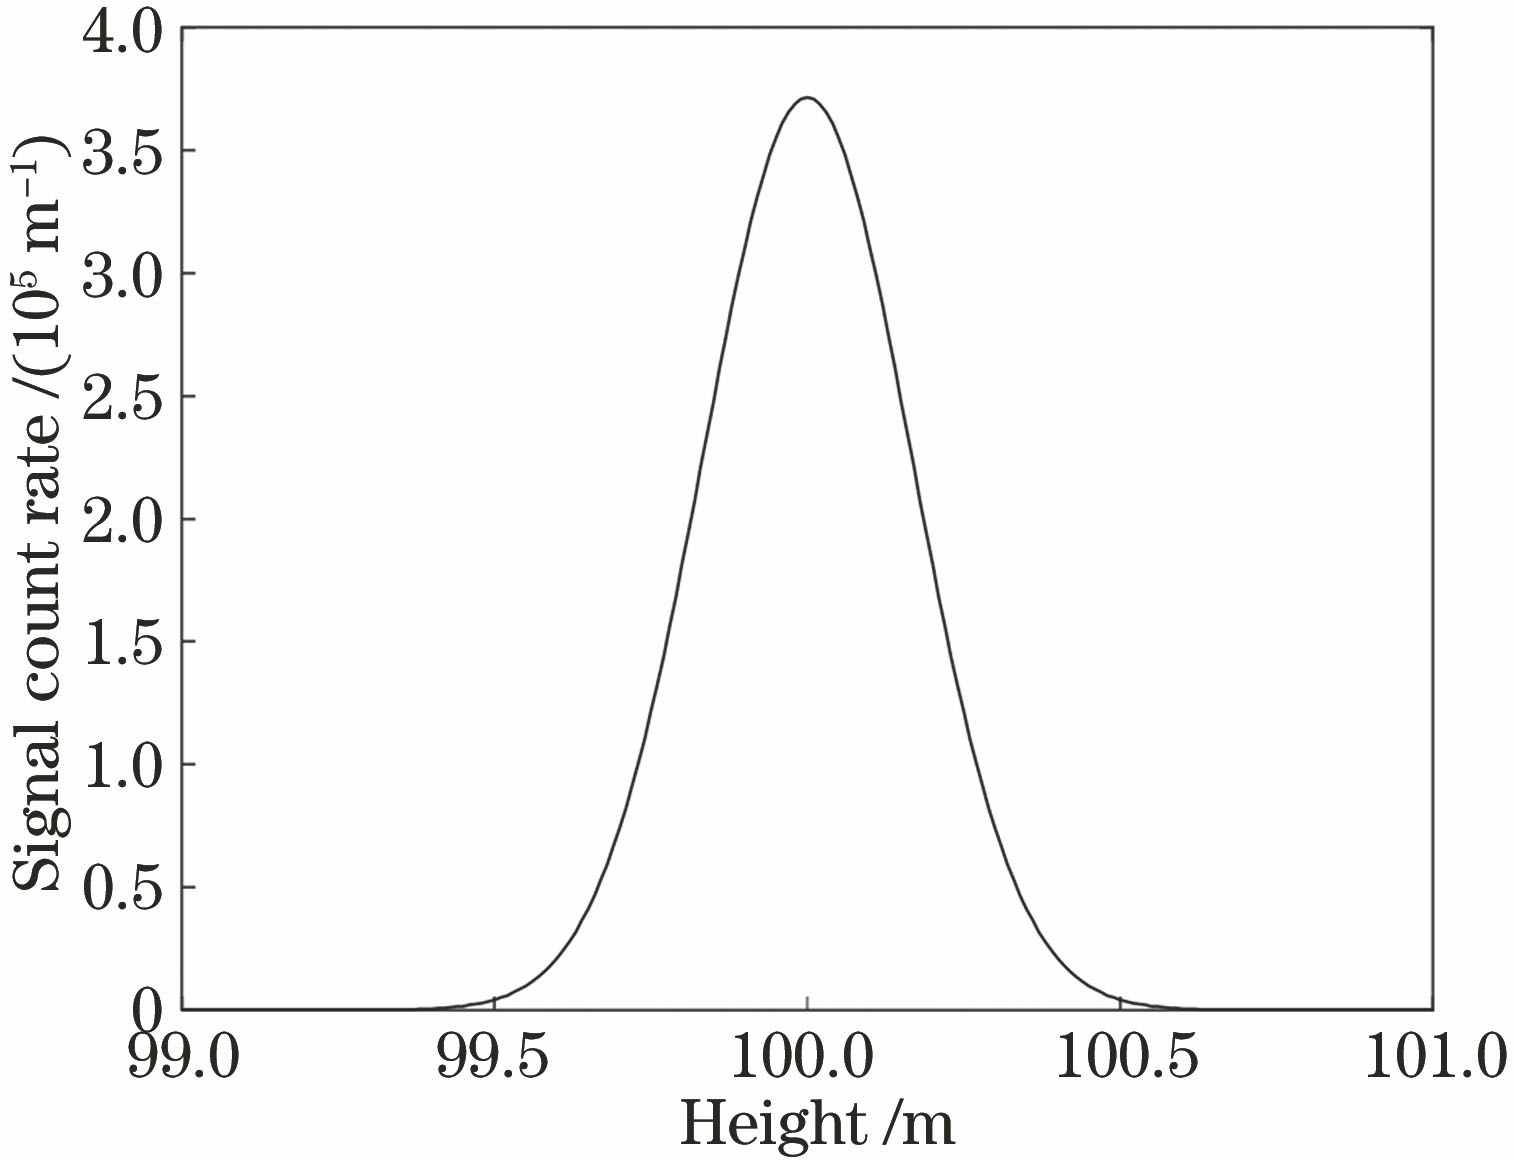
图 3. 回波脉冲波形
Fig. 3. Echo pulse waveform
下载图片 查看原文
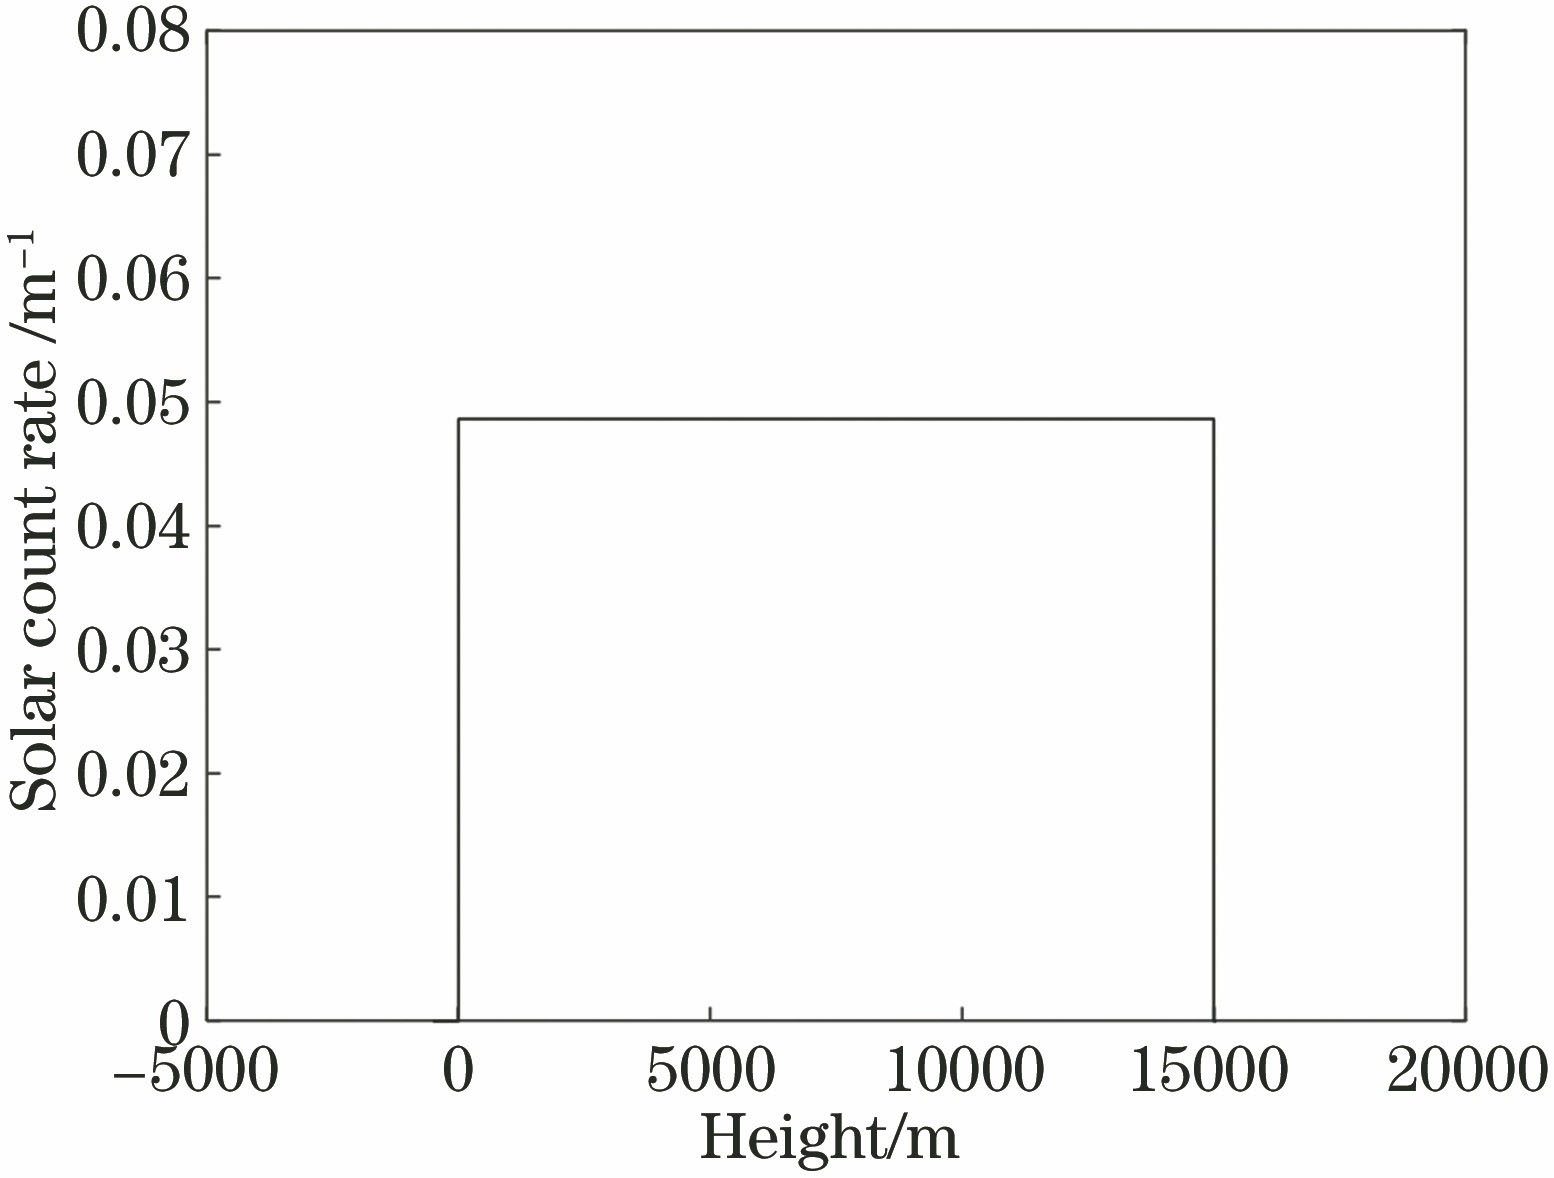
图 4. 背景噪声分布
Fig. 4. Background noise distribution
下载图片 查看原文
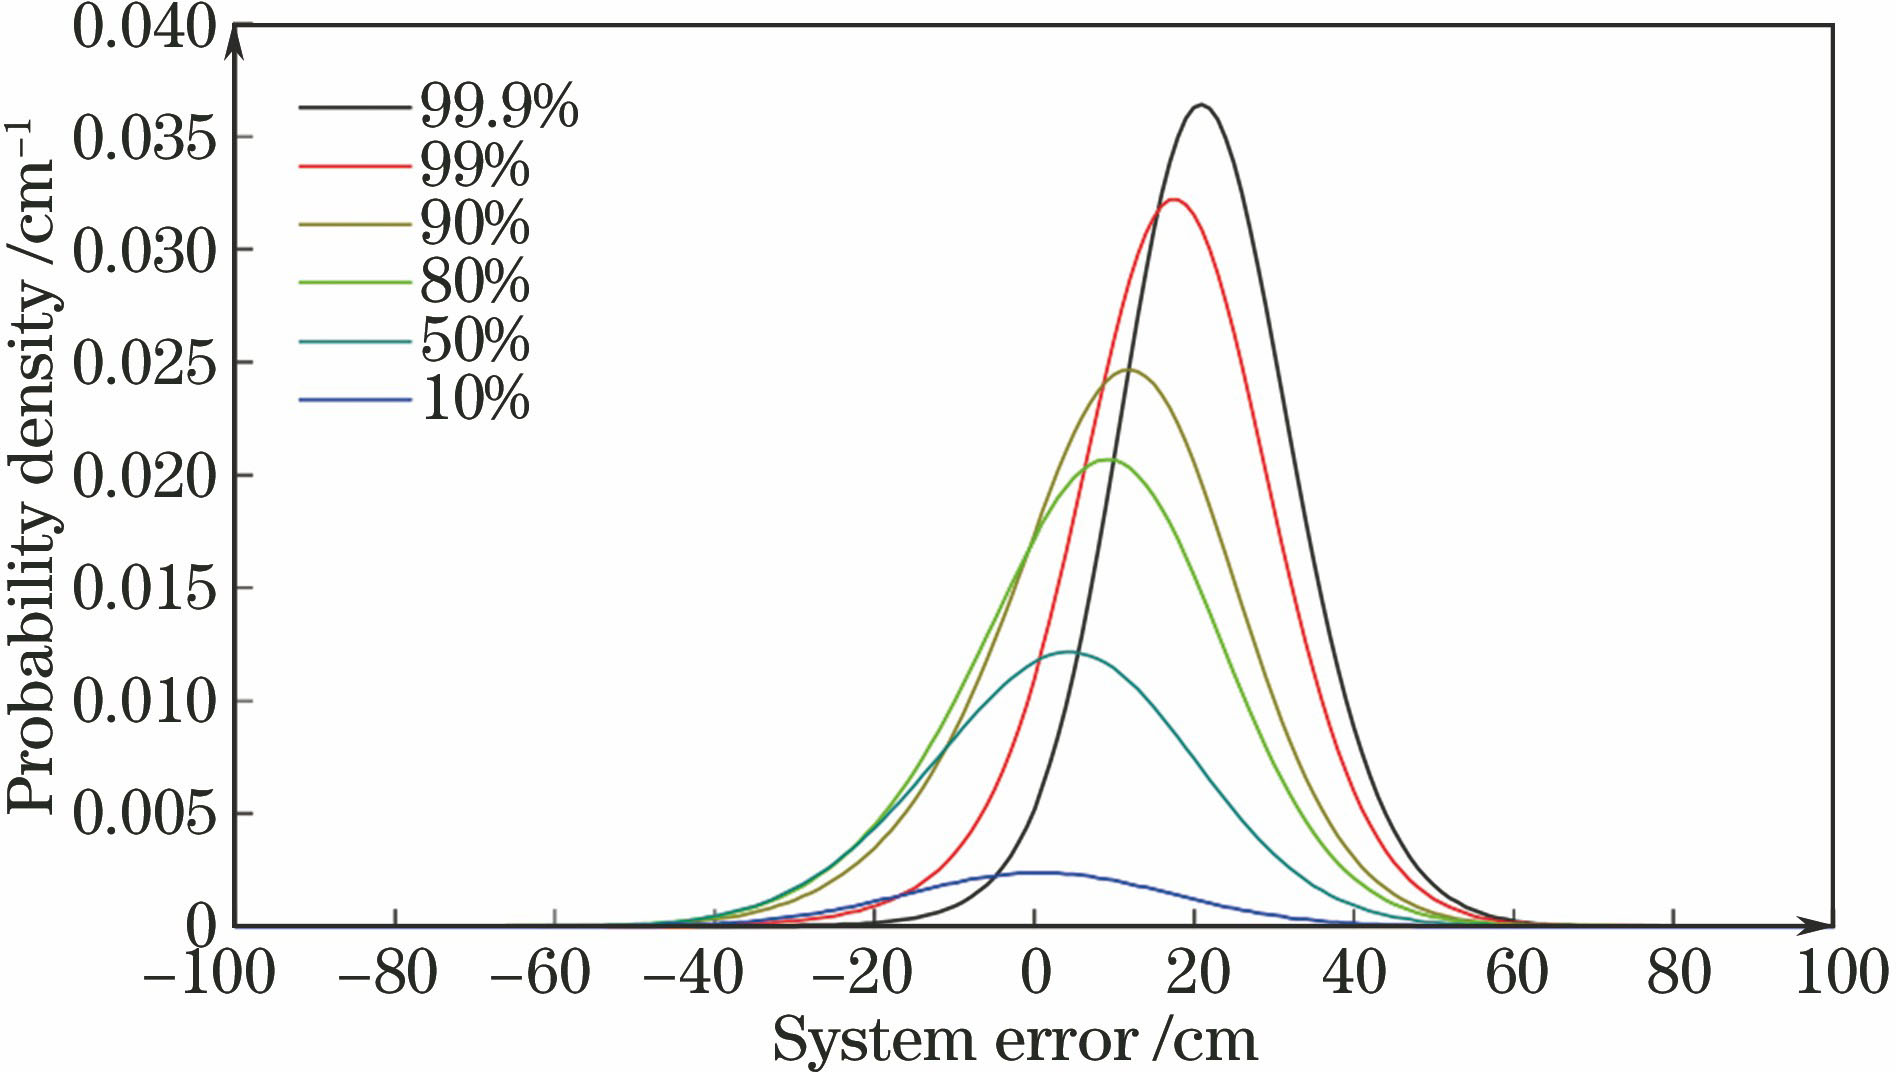
图 5. 不同探测率下的误差概率分布
Fig. 5. Probability distribution of errors at different detection rates
下载图片 查看原文
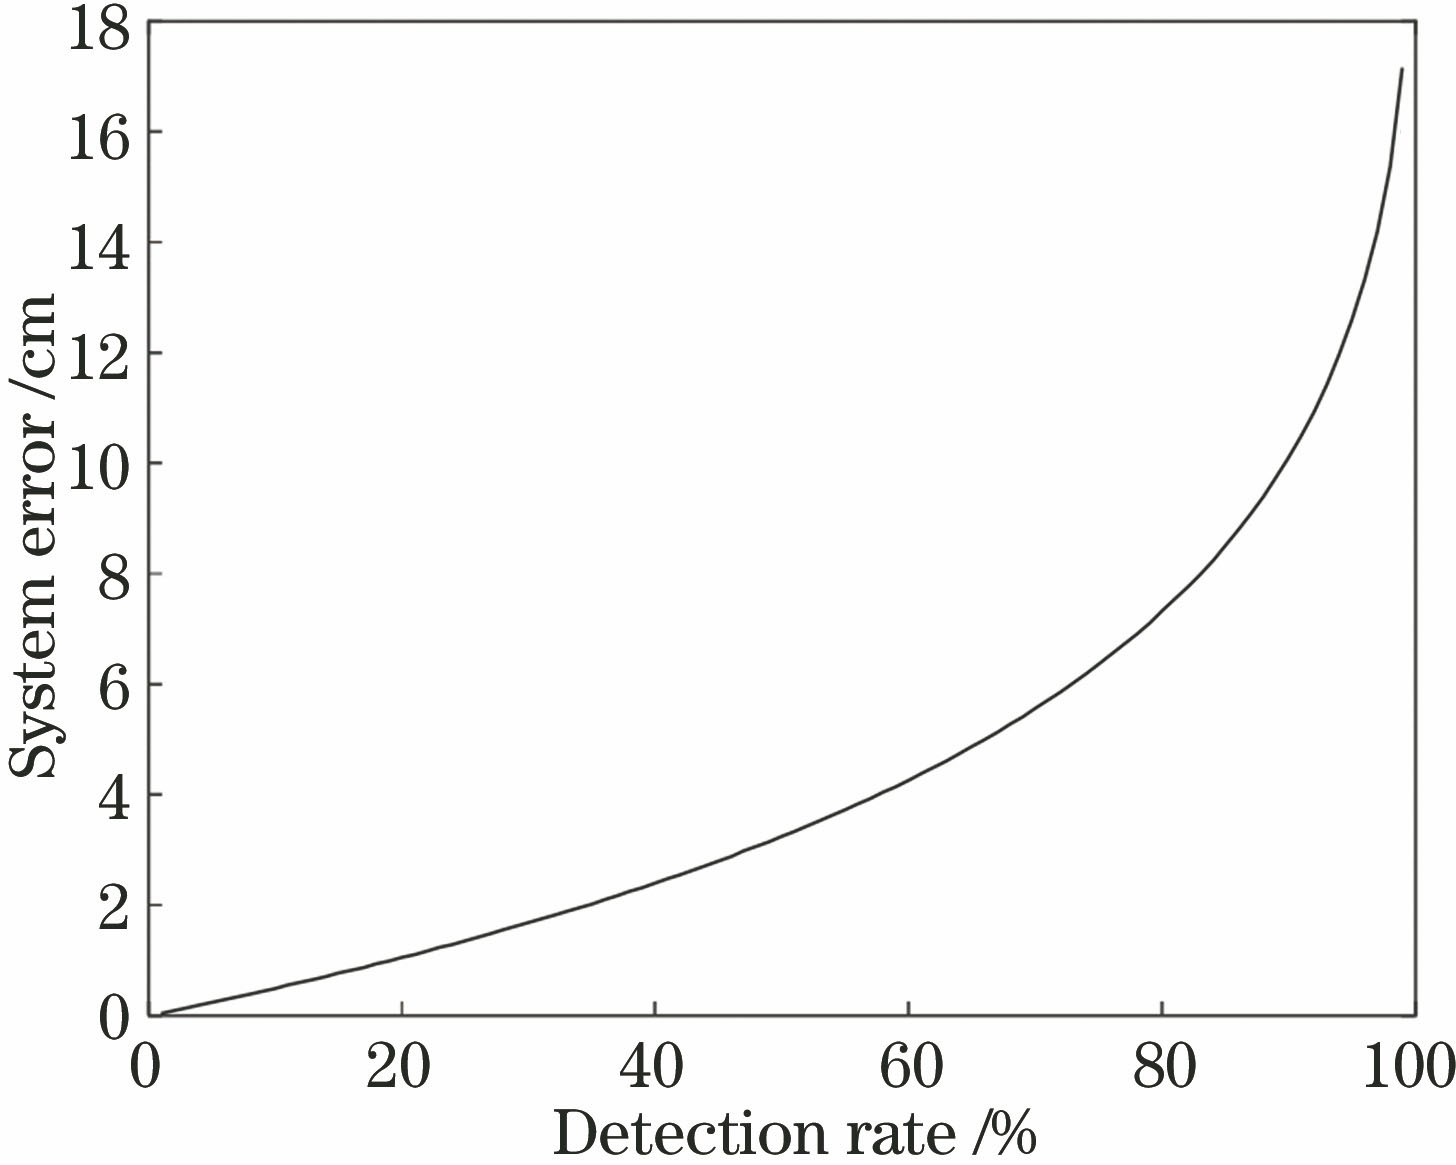
图 6. 系统误差和探测率的关系
Fig. 6. Relationship between system error and detection rate
下载图片 查看原文
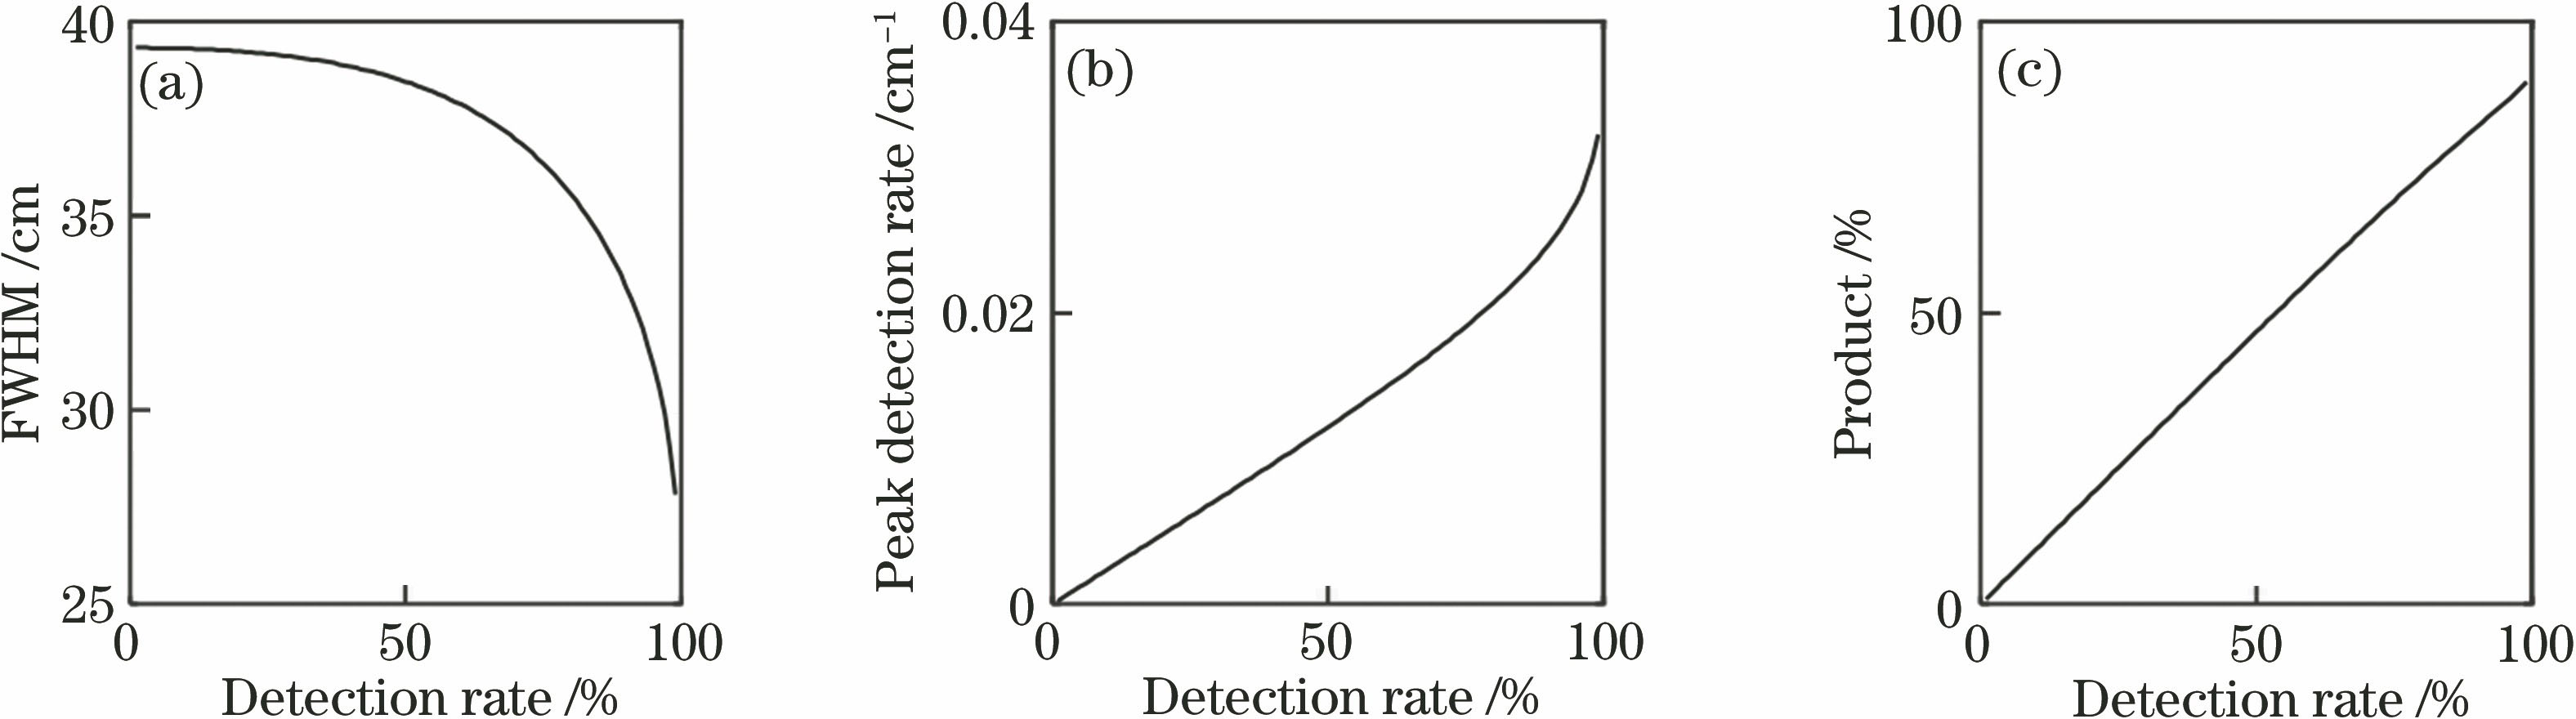
图 7. 不同参数与探测率的关系。(a)半峰全宽与探测率的关系;(b)峰值探测率与探测率的关系;(c)峰值半峰全宽积与探测率的关系
Fig. 7. Relationship between different parameters and detection rate. (a) Relationship between FWHM and detection rate; (b) relationship between peak detection rate and detection rate; (c) relationship between detection rate and the product of peak height and FWHM
下载图片 查看原文
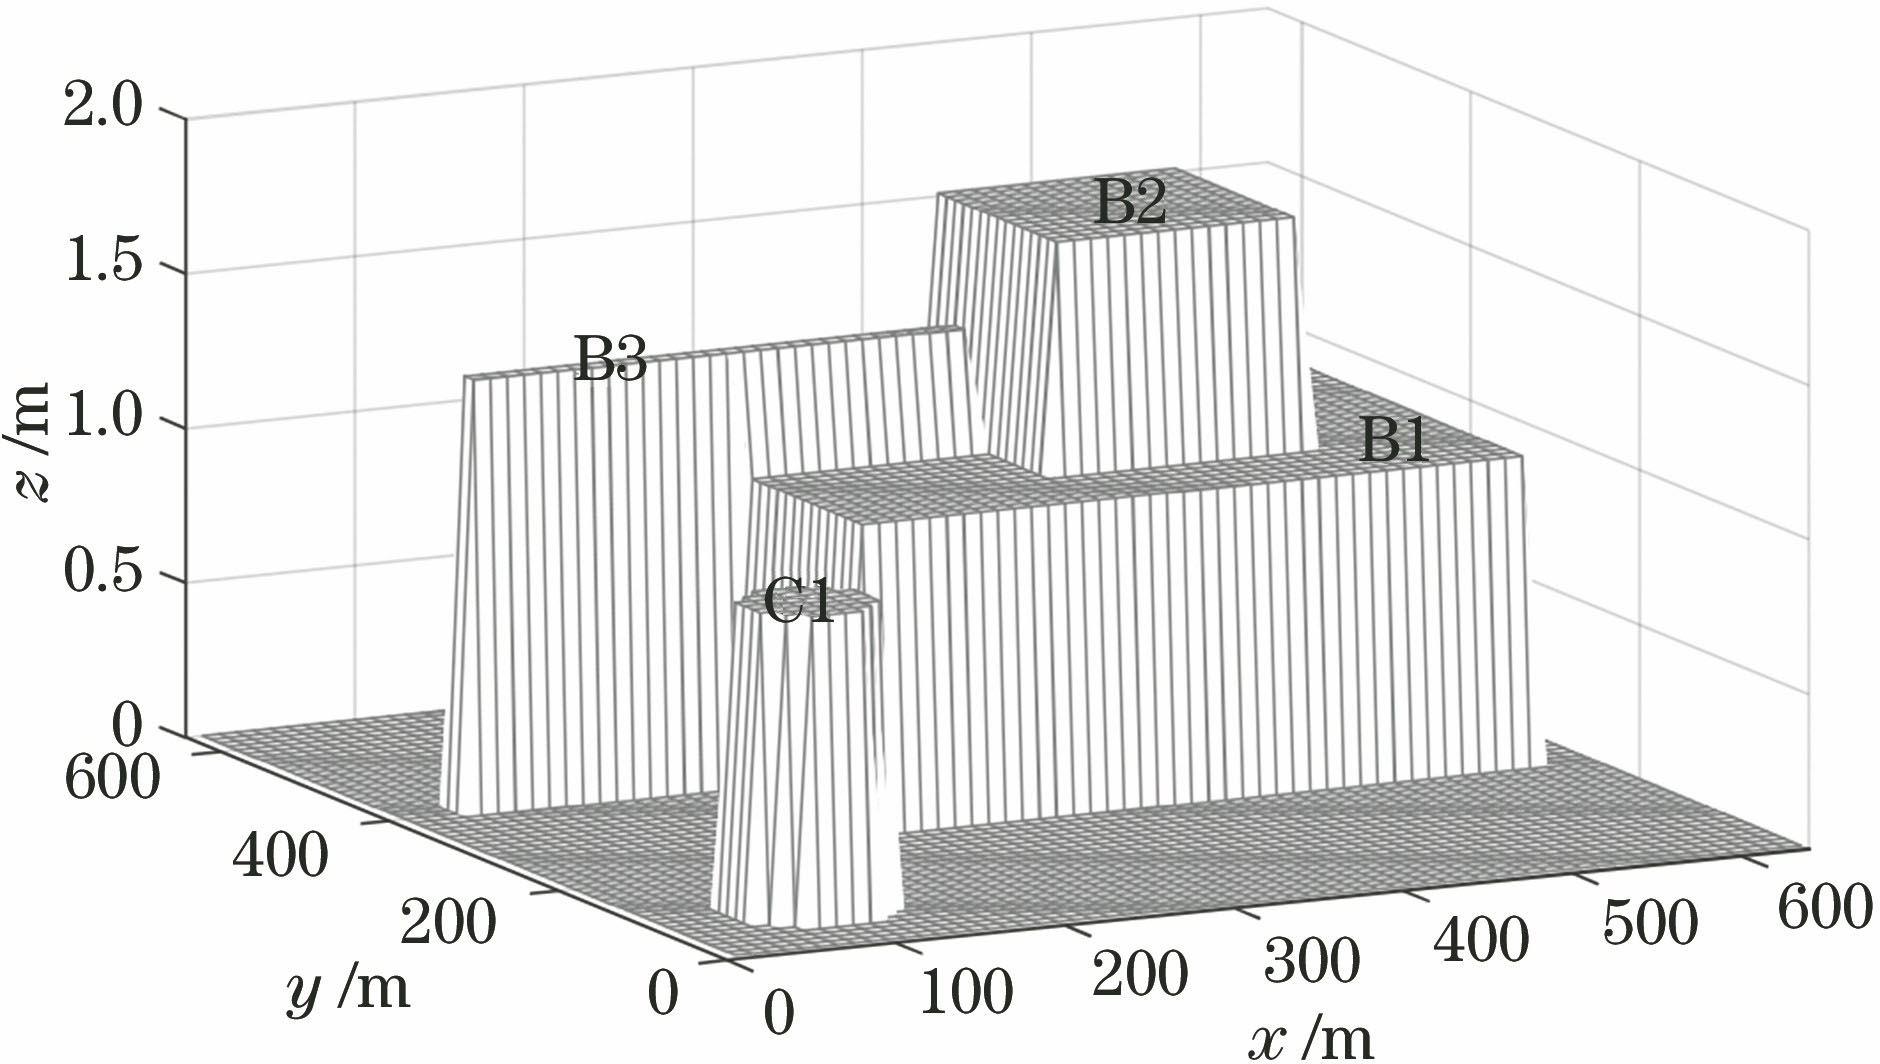
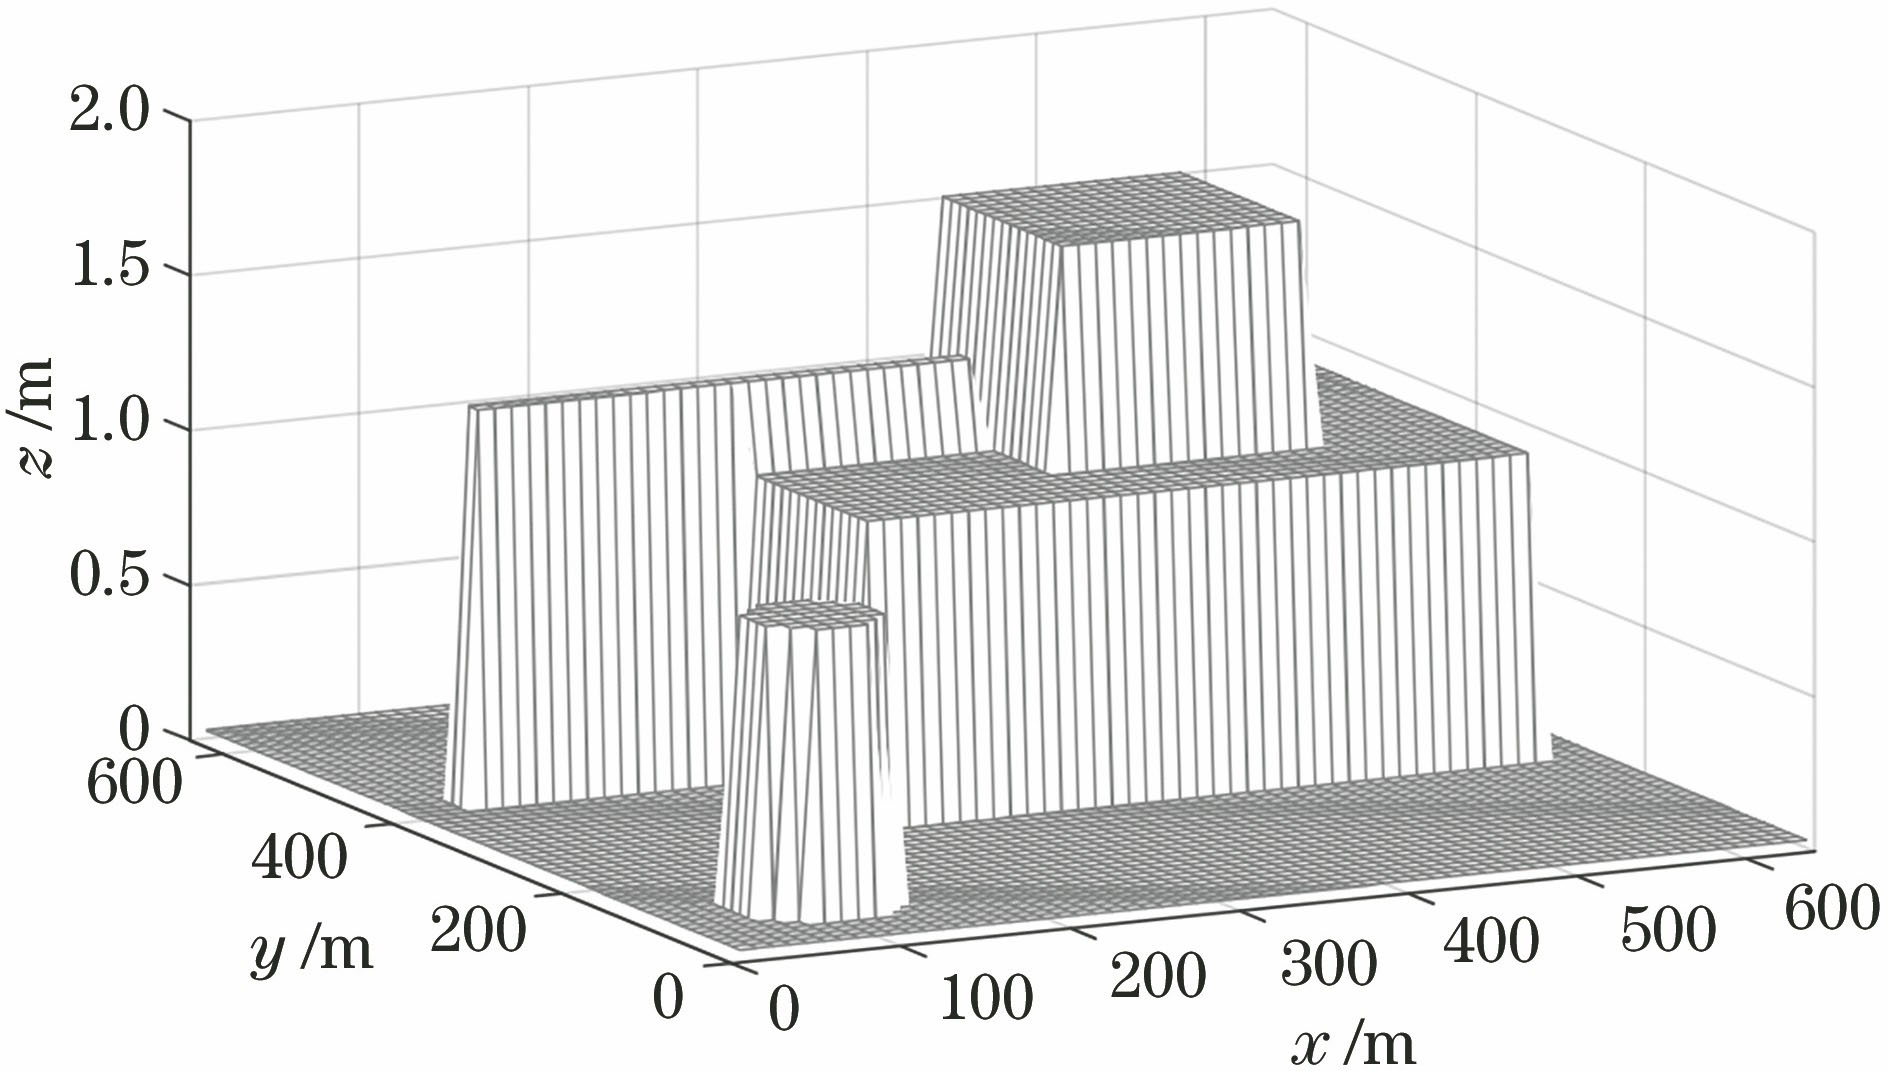
图 8. 输入的高程模型
Fig. 8. Input topography model
下载图片 查看原文
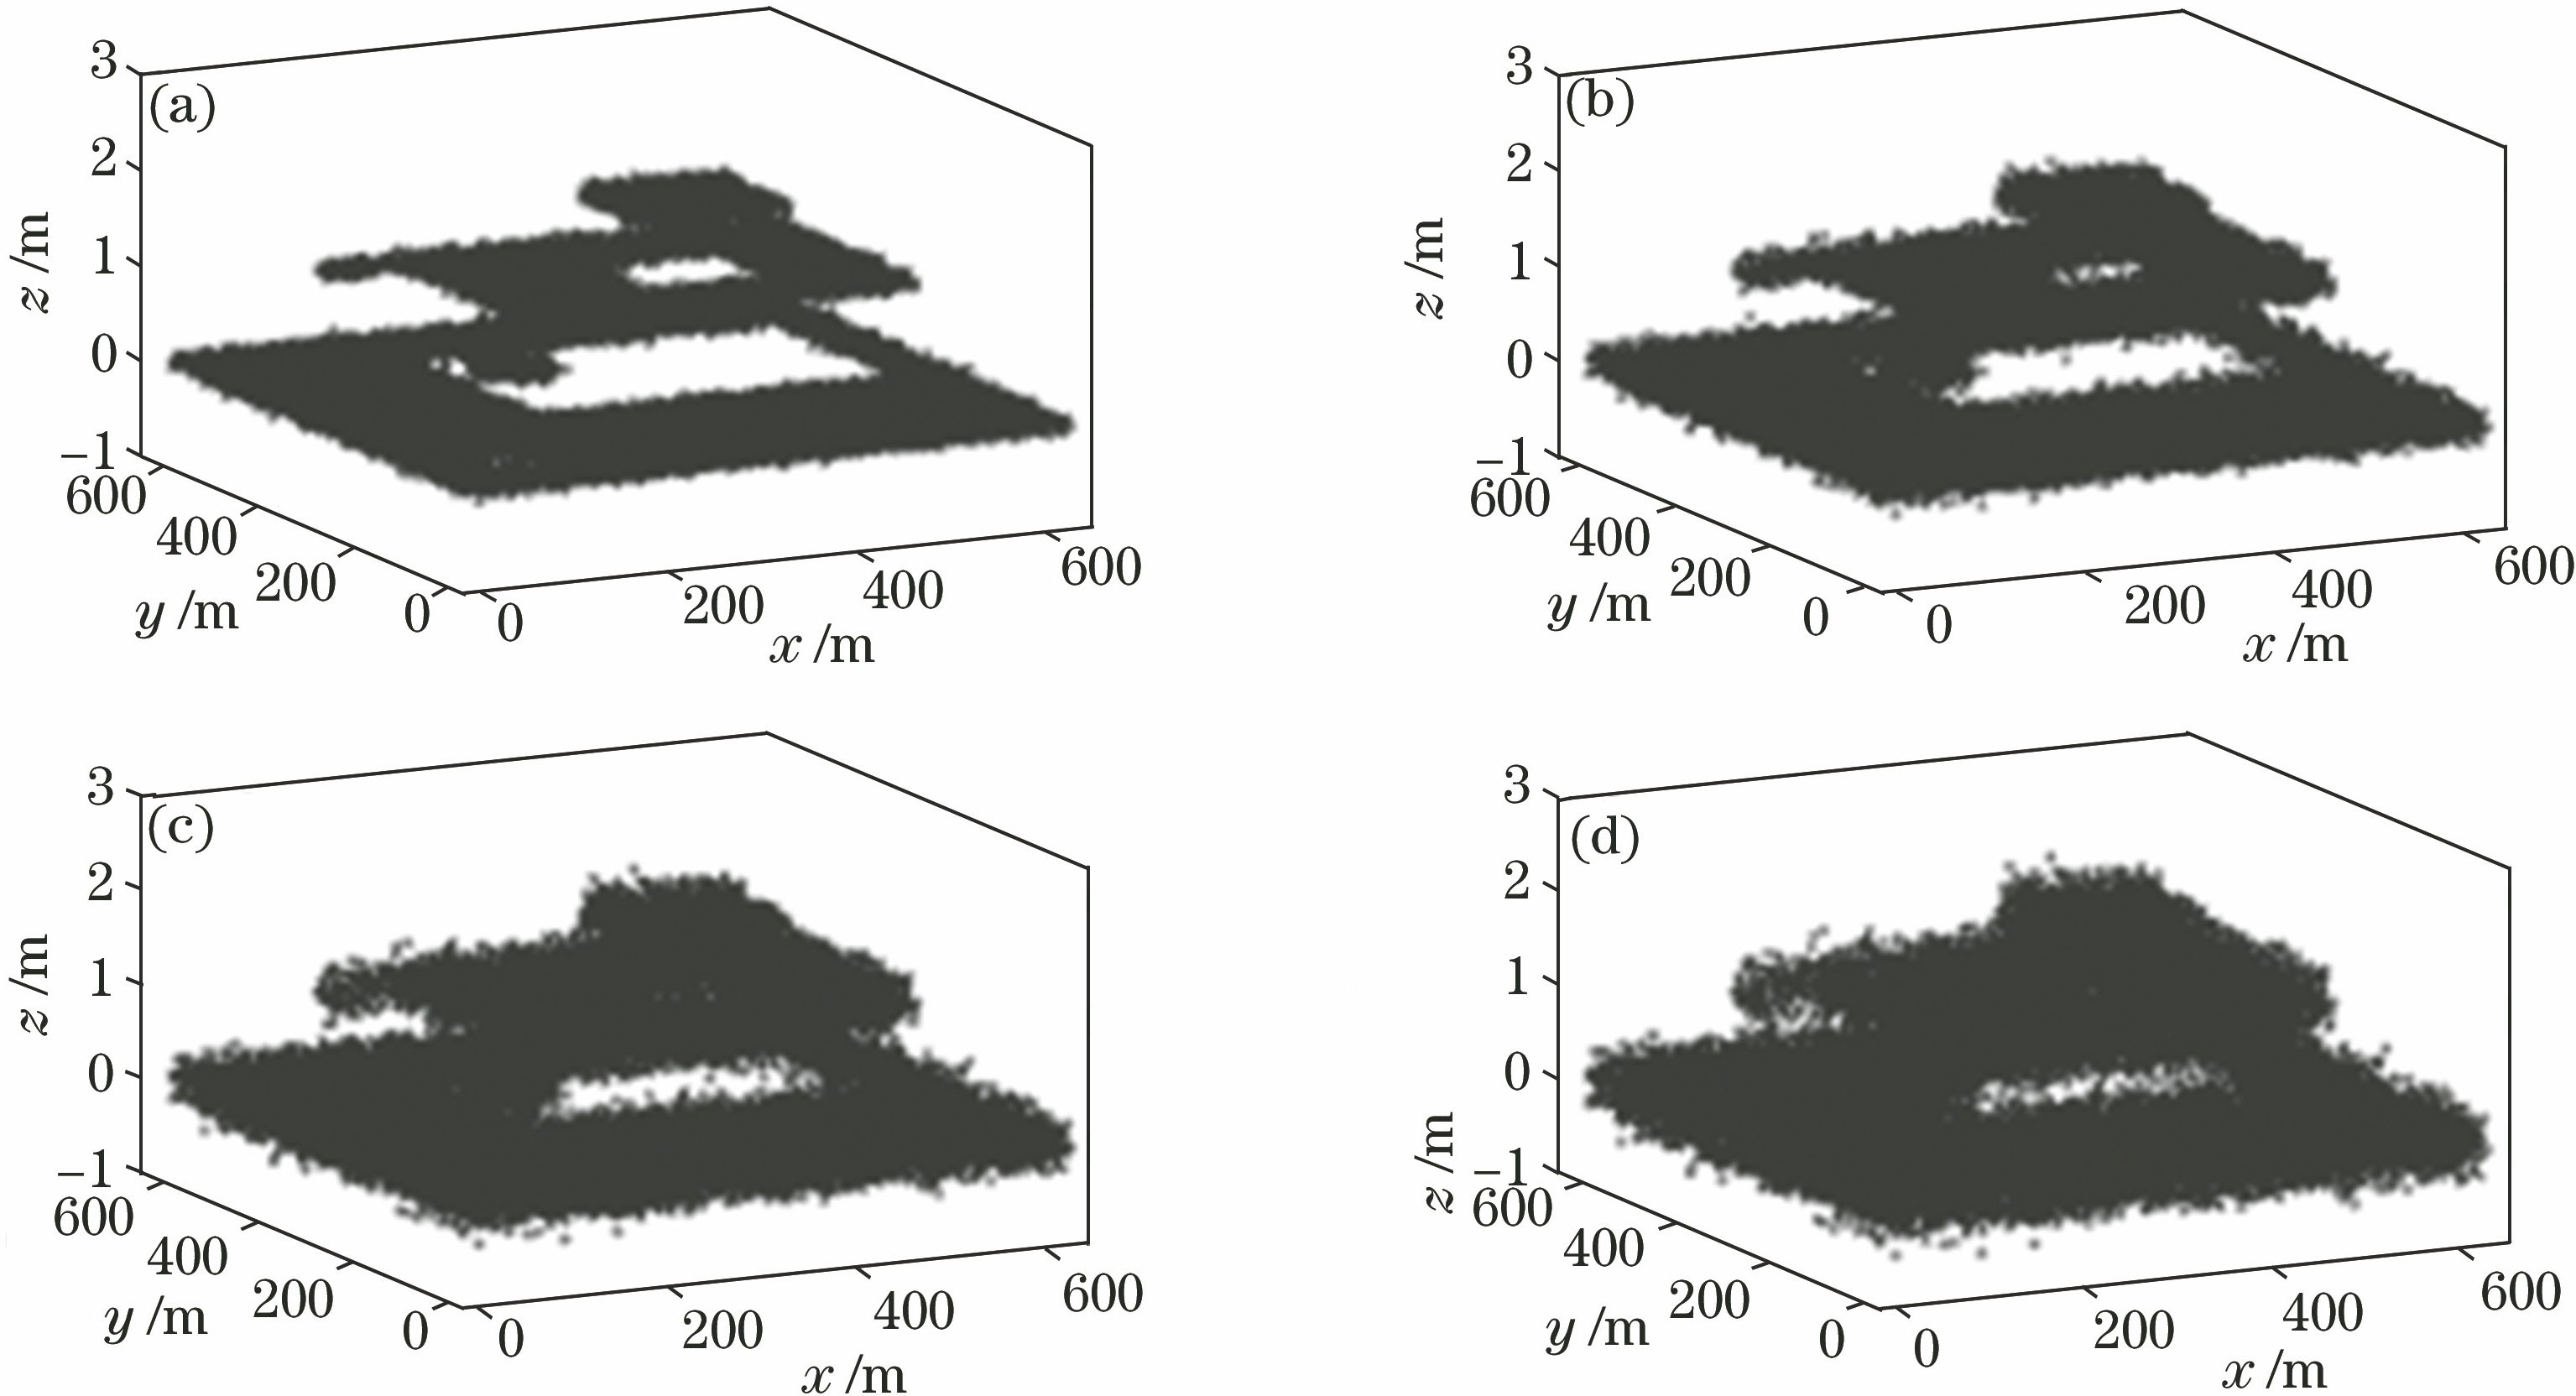
图 9. 事件点云图。(a) Δz=0.1 m; (b)Δz=0.2 m; (c) Δz=0.3 m; (d) Δz=0.39 m
Fig. 9. Point clouds of event. (a) Δz=0.1 m; (b) Δz=0.2 m; (c) Δz=0.3 m; (d) Δz=0.39 m
下载图片 查看原文
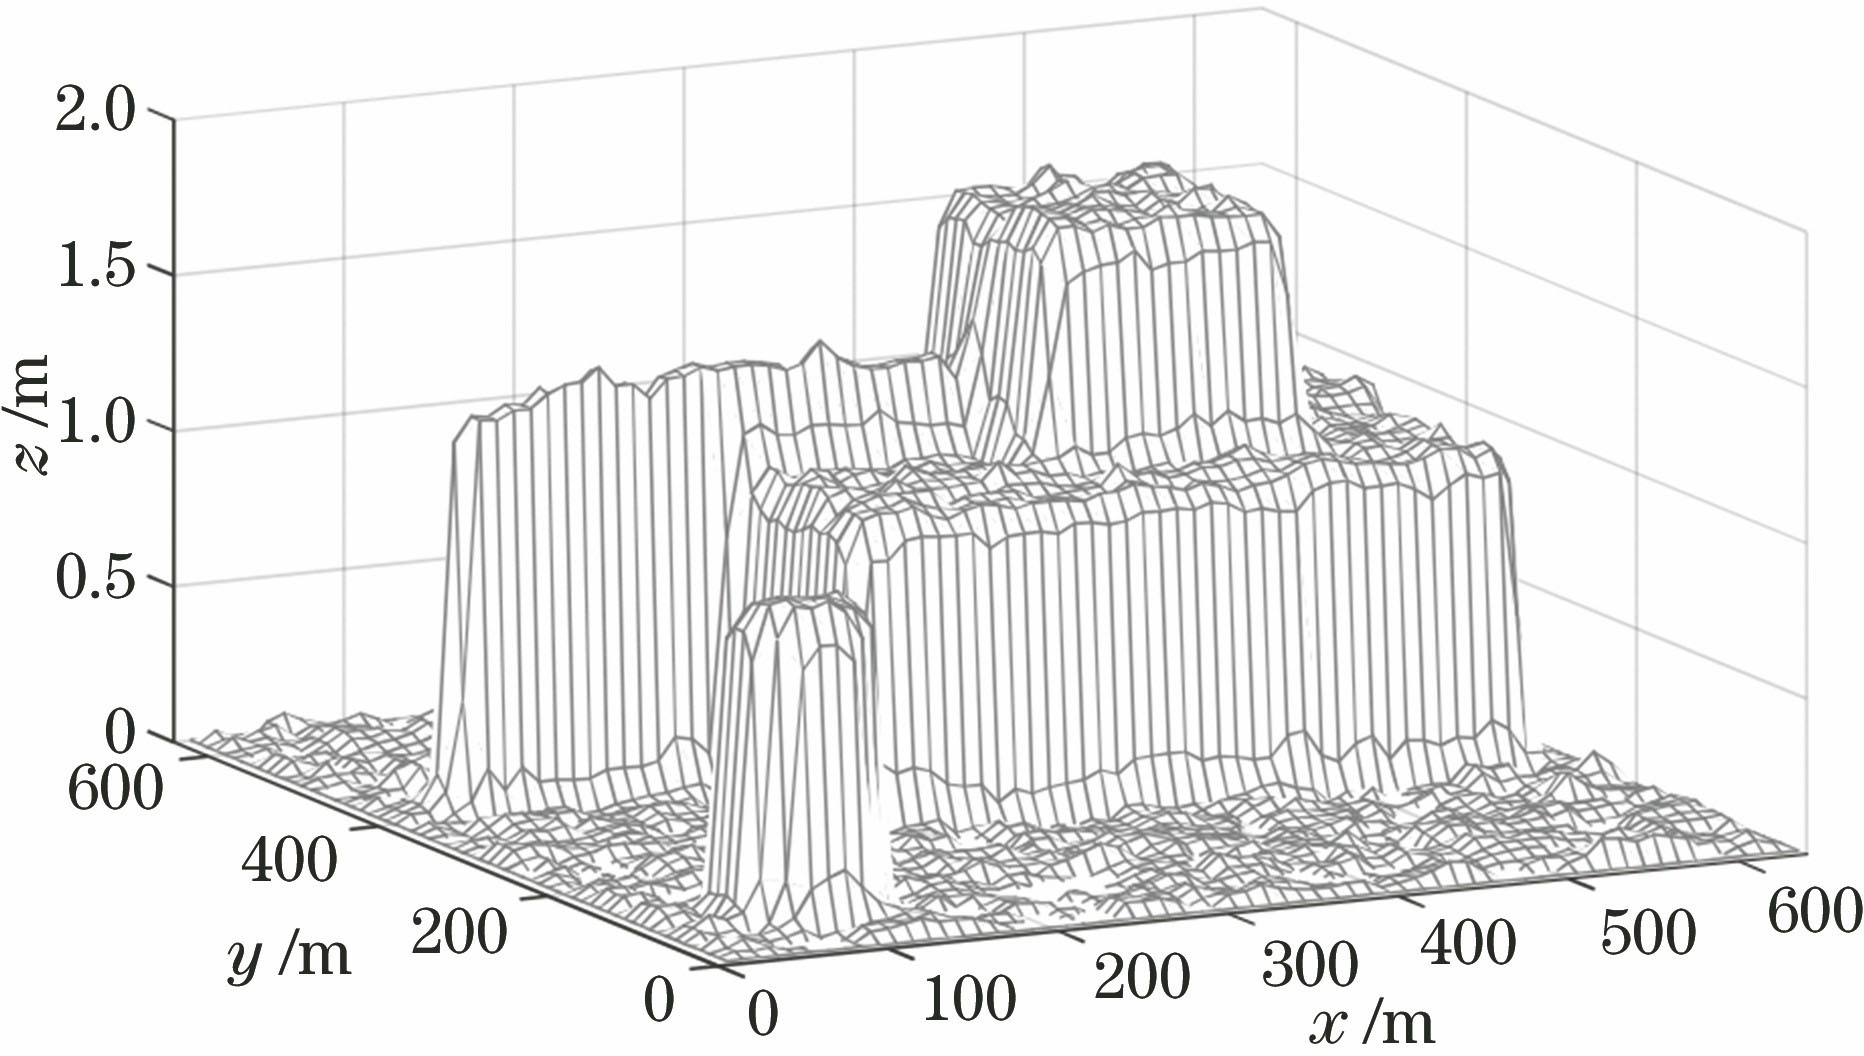
图 10. 输出的高程模型
Fig. 10. Output topography model
下载图片 查看原文
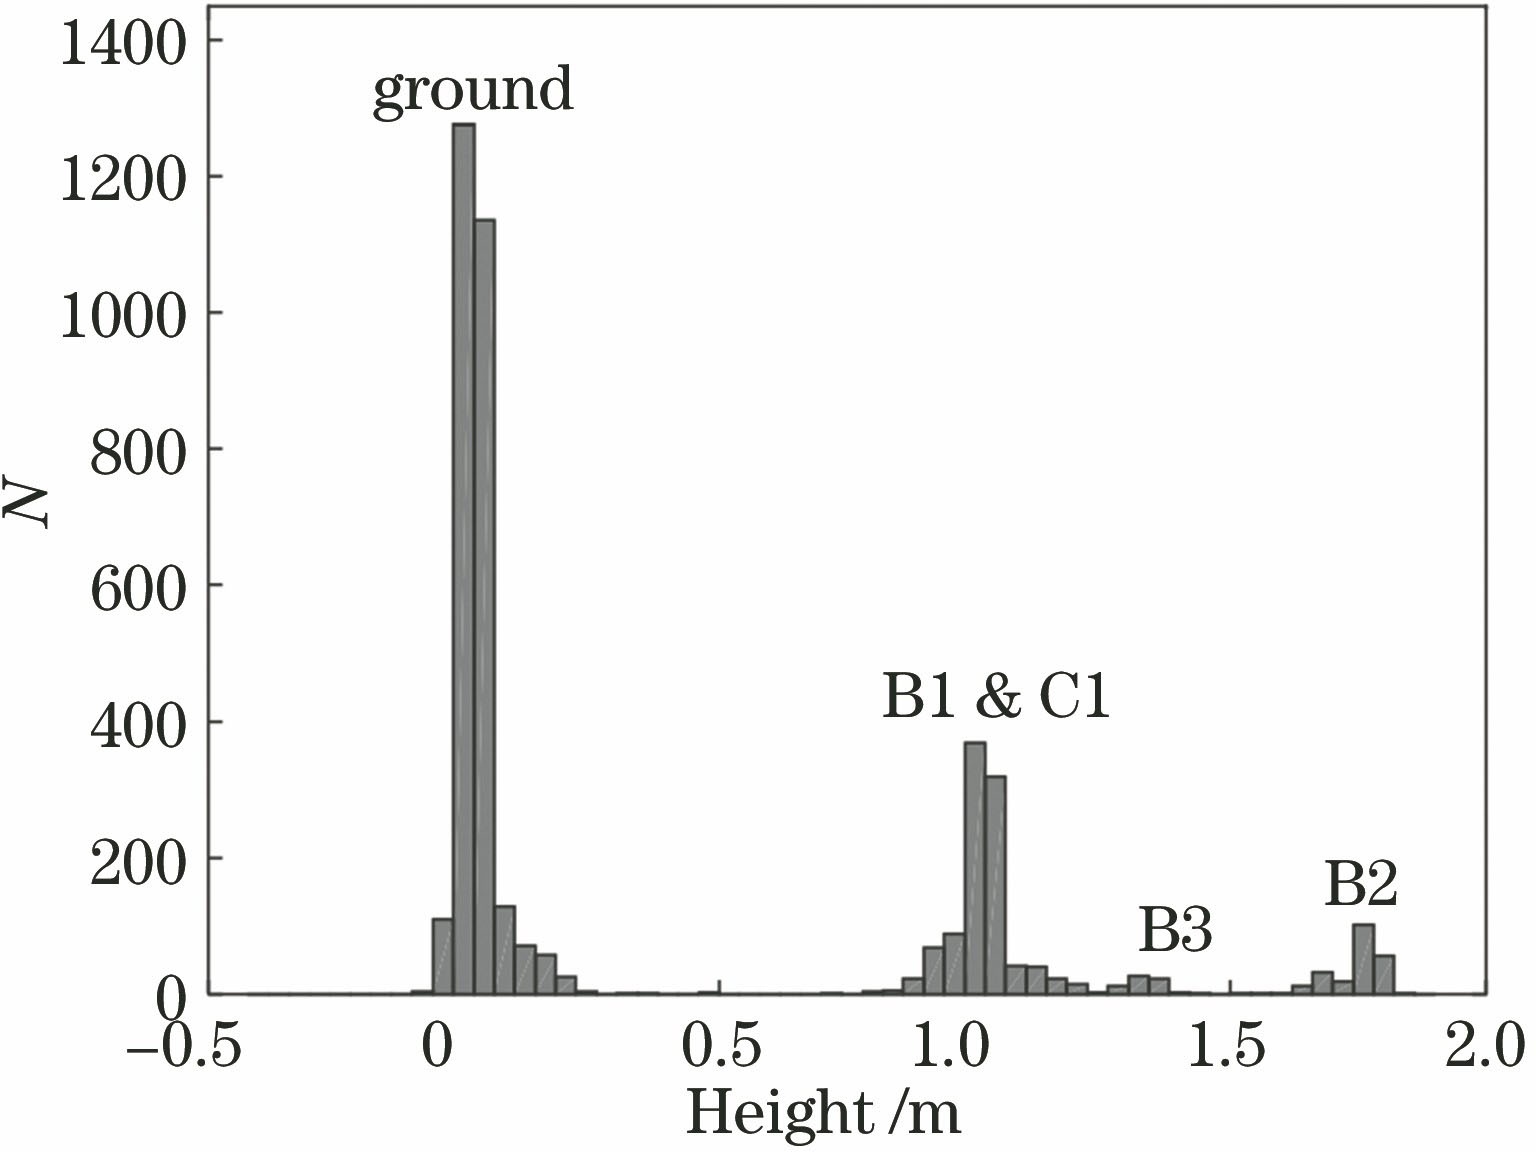
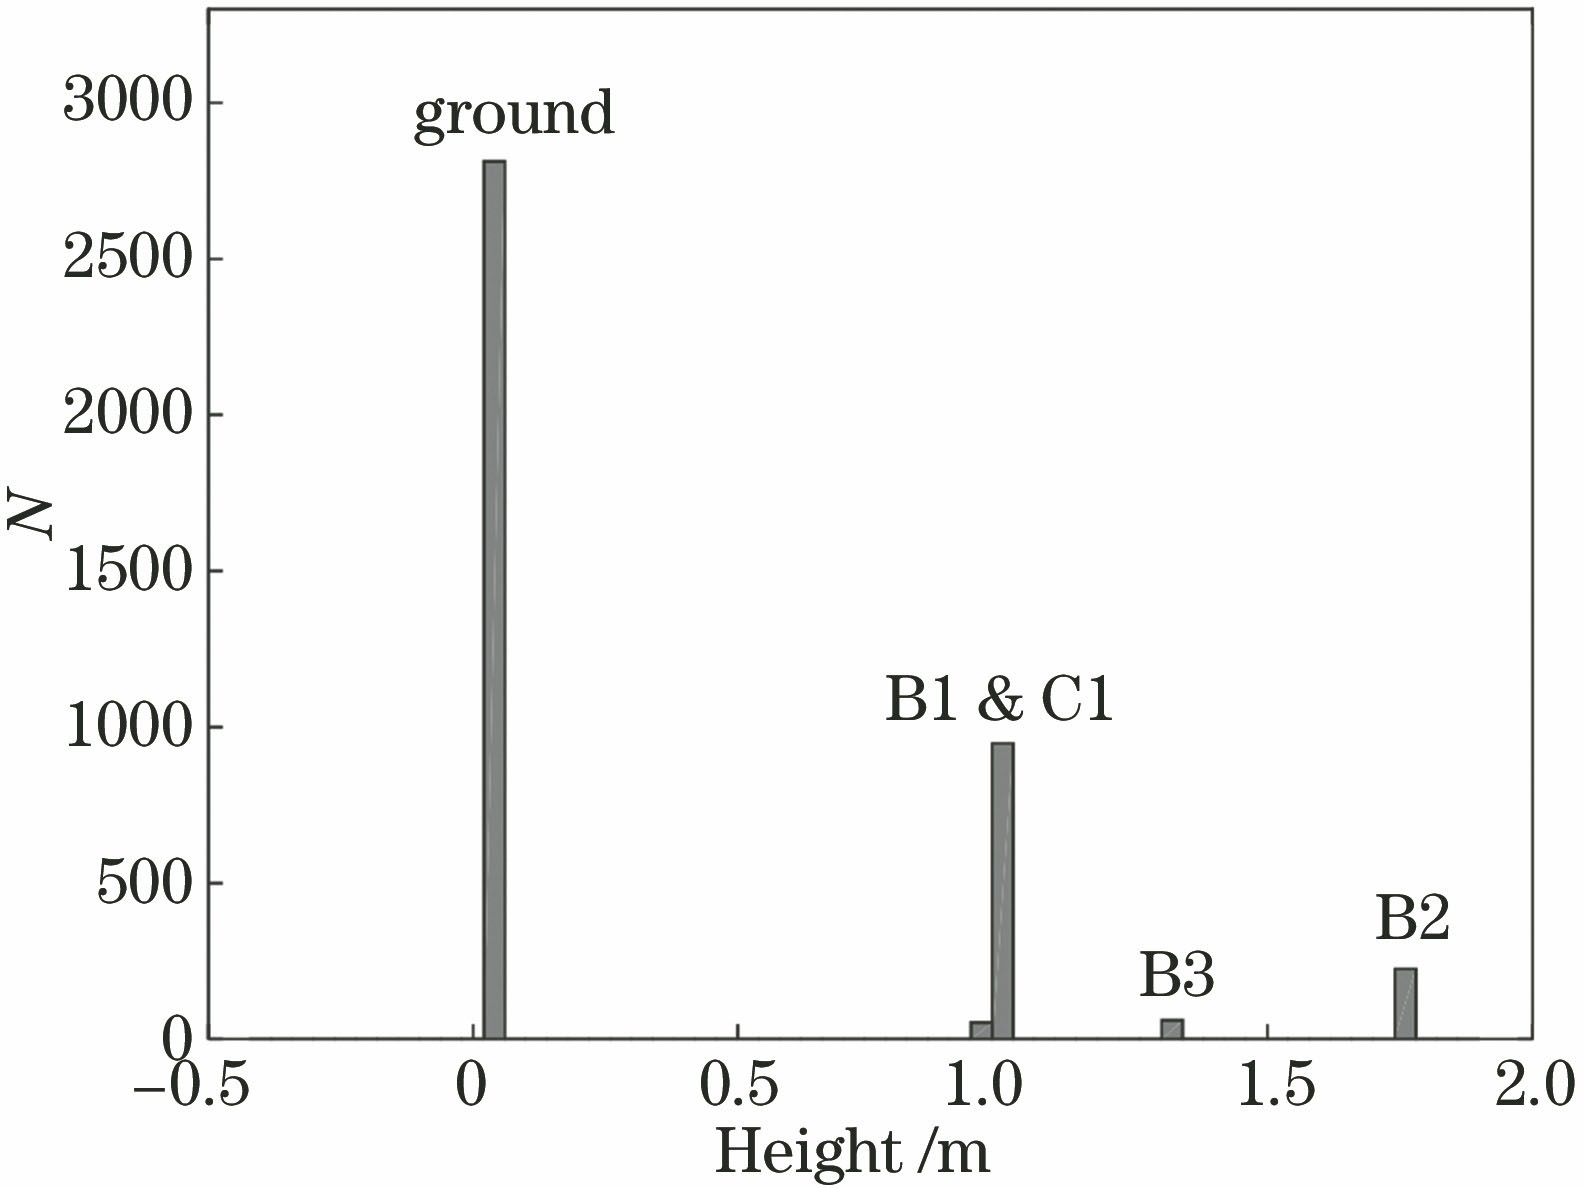
图 11. 输出高程的直方图
Fig. 11. Histogram of output topography
下载图片 查看原文
图 12. 地物模型的遥感图像
Fig. 12. Remote sensing image of ground object model
下载图片 查看原文
图 13. 优化后的高程模型
Fig. 13. Topography model after optimizing
下载图片 查看原文
图 14. 优化后的高程直方图
Fig. 14. Topography histogram after optimizing
下载图片 查看原文
表 1ATLAS的性能参数
Table1. Performance parameters of ATLAS
| Parameter | Value |
|---|
| Laser wavelength /nm | 532 | | Spot diameter /m | 10 | | Pulse duration /ns | 1 | | Repetition rate /kHz | 10 | | Repetition period (30 km) /ms | 0.1 | | Peak laser power /mJ | 250-900 | | Orbital height /km | 600 | | Step /m | 0.688 |
|
查看原文
表 2典型大气模型的影响
Table2. Influence of typical atmosphere model
| Atmosphere model | Radiance /(W·cm-2·μm-1·sr-1) | Transmittance |
|---|
| Albedo is 0 | Albedo is 1 |
|---|
| Tropical | 103.935×10⁻³ | 6.400×10⁻² | 0.625 | | Mid-latitude summer | 4.057×10⁻³ | 6.365×10⁻² | 0.622 | | Mid-latitude winter | 3.911×10⁻³ | 6.320×10⁻² | 0.640 | | Sub-arctic summer | 4.060×10⁻³ | 6.355×10⁻² | 0.621 | | Sub-arctic winter | 3.915×10⁻³ | 6.336×10⁻² | 0.640 | | US standard 1976 | 4.061×10⁻³ | 6.358×10⁻² | 0.622 |
|
查看原文
表 3不同探测率下的峰值探测率和半峰全宽
Table3. Peak detection rate and FWHM at different detection rates
| Detection rate /% | Peak detection rate /% | FWHM /cm |
|---|
| 10 | 0.24 | 39.32 | | 50 | 1.21 | 39.30 | | 80 | 2.06 | 38.45 | | 90 | 2.47 | 35.56 | | 99 | 3.22 | 33.19 | | 99.9 | 3.64 | 25.07 |
|
查看原文
米小什, 赵惠, 樊学武, 盛立志. 基于微通道板的单光子激光测高技术研究[J]. 光学学报, 2018, 38(12): 1228001. Xiaoshi Mi, Hui Zhao, Xuewu Fan, Lizhi Sheng. Photon-Counting Laser Altimetry Based on Microchannel Plate[J]. Acta Optica Sinica, 2018, 38(12): 1228001.


 PDF全文
PDF全文

