光学学报, 2019, 39 (2): 0212001, 网络出版: 2019-05-10
滤光片对非色散成像系统获取污染气体柱浓度的影响  下载: 731次
Influence of Filter on Column density of Polluted Gas in Non-Dispersive Imaging System
图 & 表
图 1. 不同带通滤光片的透光峰型和透光波长范围。(a) λc=458 nm, w1/2=2 nm; (b) λc=450 nm, w1/2=10 nm; (c) λc=450 nm, w1/2=40 nm
Fig. 1. Transmittance peak types and wavelength ranges of different band-pass filters. (a) λc=458 nm, w1/2=2 nm; (b) λc=450 nm, w1/2=10 nm; (c) λc=450 nm, w1/2=40 nm
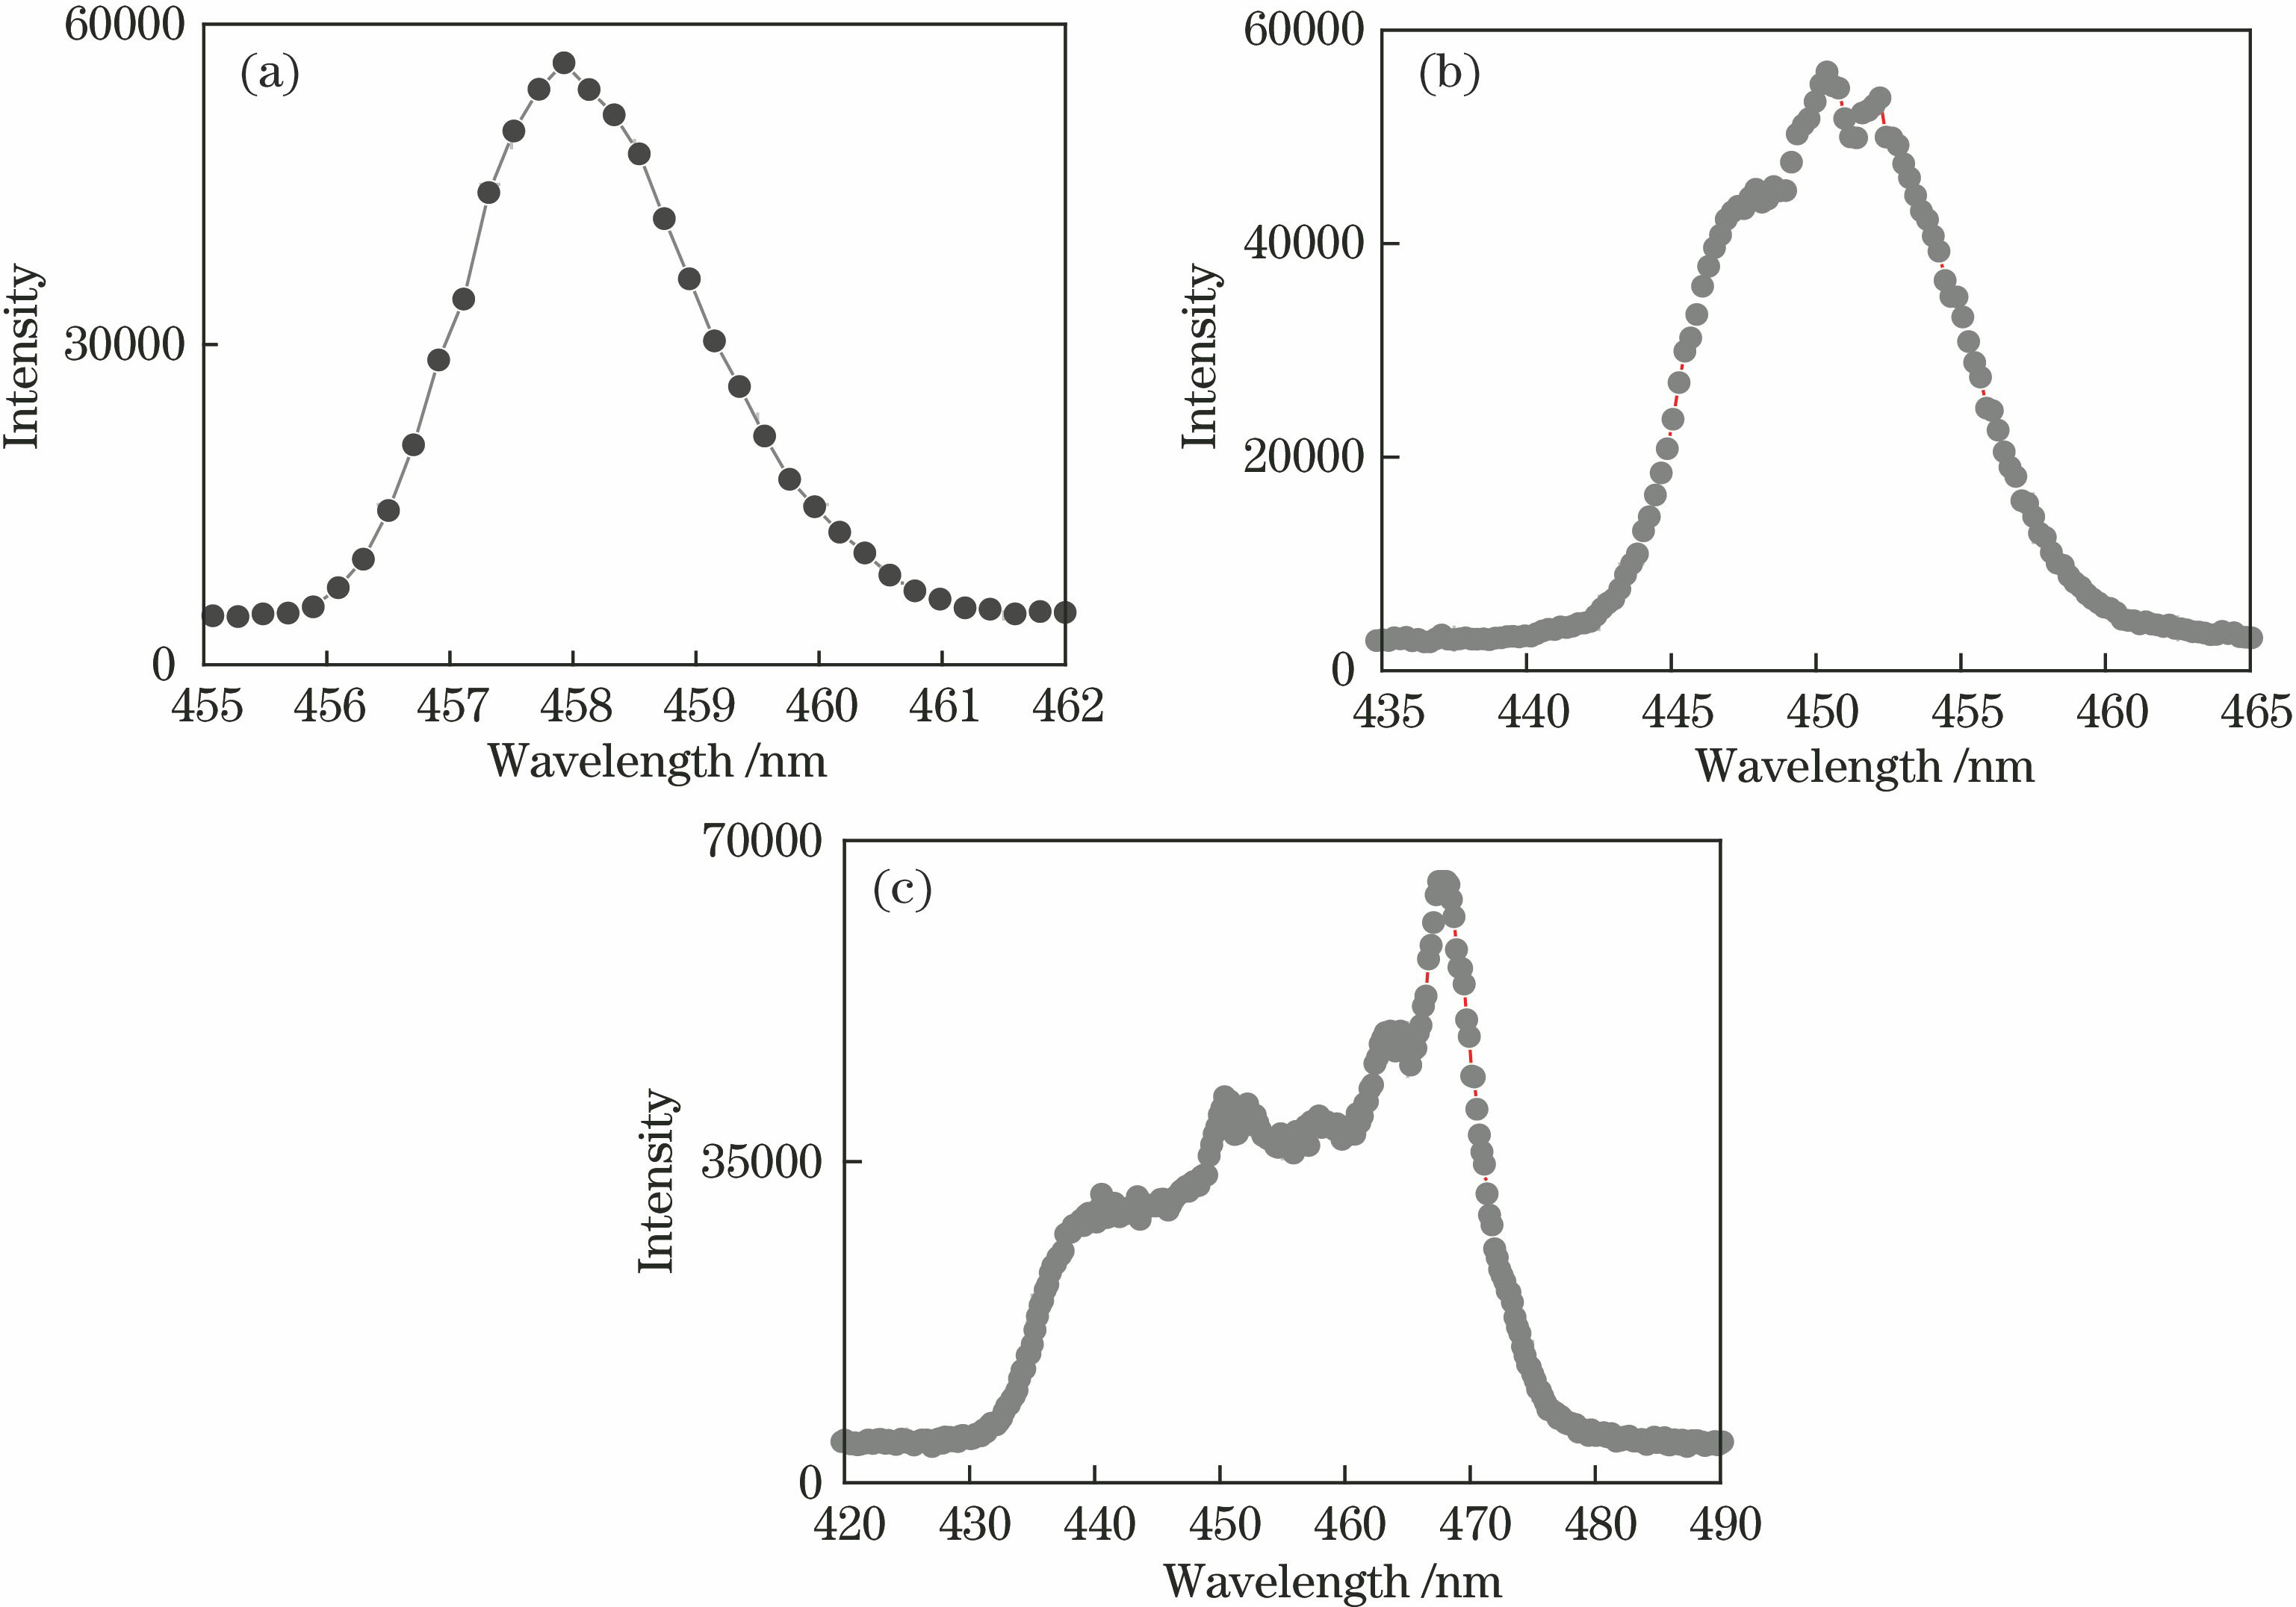
图 2. 中心波长与入射角度的关系。(a)透光光谱;(b)中心波长与入射角度的关系曲线
Fig. 2. Relationship between central wavelength and incident angle. (a) Transmittance spectra; (b) curve of central wavelength versus incident angle


图 6. 不同曝光时间的烟羽图。(a) 2 s; (b) 0.5 s
Fig. 6. Plume maps under different exposure time. (a) 2 s; (b) 0.5 s

图 7. SNR与曝光时间和叠加图片数目的关系曲线
Fig. 7. SNR versus exposure time and number of superimposed images

图 8. 光学密度与NO2柱浓度的关系。(a) λc=458 nm, w1/2=2 nm; (b) λc=450 nm, w1/2=10 nm; (c) λc=450 nm, w1/2=40 nm
Fig. 8. Relationship between column density of NO2 and optical density. (a) λc=458 nm, w1/2=2 nm; (b) λc=450 nm, w1/2=10 nm; (c) λc=450 nm, w1/2=40 nm


图 11. NO2的光学密度及柱浓度分布图。(a)中心波长为450 nm的滤光片的光学密度;(b)中心波长为600 nm的滤光片获得的光学密度;(c) NO2的差分光学密度;(d) NO2柱浓度二维分布图
Fig. 11. Distributions of optical density and column density of NO2. (a) Optical density of filter with central wavelength of 450 nm; (b) optical density of filter with central wavelength of 600 nm; (c) differential optical density of NO2; (d) two-dimensional column density distribution of NO2

表 1滤光片中心波长及其变化范围
Table1. Central wavelength of filter and its range of variation
|
张英华, 李昂, 谢品华, 杨雷, 徐晋, 张朝刚, 胡肇焜. 滤光片对非色散成像系统获取污染气体柱浓度的影响[J]. 光学学报, 2019, 39(2): 0212001. Yinghua Zhang, Ang Li, Pinhua Xie, Lei Yang, Jin Xu, Chaogang Zhang, Zhaokun Hu. Influence of Filter on Column density of Polluted Gas in Non-Dispersive Imaging System[J]. Acta Optica Sinica, 2019, 39(2): 0212001.


 PDF全文
PDF全文

