Photonics Research, 2018, 6 (5): 05000B74, Published Online: Jul. 6, 2018
Toward mid-infrared nonlinear optics applications of silicon carbide microdisks engineered by lateral under-etching [Invited]  Download: 670次
Figures & Tables
Fig. 1. Evolution of the theoretical intrinsic Q λ = 1.55 μm Q
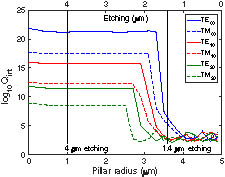
Fig. 2. (a) Intensity mode profile of a simulated WGM at λ = 1.55 μm

Fig. 3. (a) Scheme of the evanescent coupling technique, and (b) coupling between the tapered fiber and a 10 μm disk.

Fig. 4. (a) Experimental transmitted spectrum for a 10 μm diameter disk with 4 μm of lateral under-etching. Two polarizations are plotted: 0° in blue and 90° in red. Note that some modes appear in both polarizations. Below, two FSRs are plotted. Using mode solver, we inferred that they correspond to the TE 20 TE 40

Fig. 5. (a) Experimental (blue) and simulated (red) TM normalized transmitted spectra for a 10 μm diameter disk with 4 μm Si lateral under-etching. (b) TM (blue) and TE (black) polarizations of the transmitted spectra for a 10 μm diameter disk with a 4 μm lateral under-etching.

Fig. 6. Effective index as a function of wavelength of the WGMs for a 10 μm disk with (a) 4 μm and (b) 1.4 μm Si lateral under-etching.

Fig. 7. (a) Experimental transmission spectrum from a 10 μm diameter disk with 1.4 μm Si lateral under-etching in blue. Equivalent simulated transmission spectrum with FDTD in red and mode solver resonances in green. (b) Zoom of the resonance. (c) Power mode profile obtained with mode solver.

Fig. 8. Group velocity dispersion D λ x y λ = 4 μm

Fig. 9. Dispersion parameter D λ x y

Fig. 10. Theoretical maximum generated frequency comb bandwidth as a function of FSR for a pump power of 1.5 W, a GVD D λ = 1 ps / ( nm · km ) 1 ). The different curves are for Q 1 × 10 4 5 × 10 6

David Allioux, Ali Belarouci, Darren Hudson, Eric Magi, Milan Sinobad, Guillaume Beaudin, Adrien Michon, Neetesh Singh, Regis Orobtchouk, Christian Grillet. Toward mid-infrared nonlinear optics applications of silicon carbide microdisks engineered by lateral under-etching [Invited][J]. Photonics Research, 2018, 6(5): 05000B74.


 PDF全文
PDF全文

