基于响应面分析的激光除漆工艺参数优化  下载: 1035次
Laser Paint Removal Process Parameter Optimization via Response Surface Methodology
1 江苏大学机械工程学院, 江苏 镇江 212013
2 南京先进激光技术研究院, 江苏 南京 210038
图 & 表
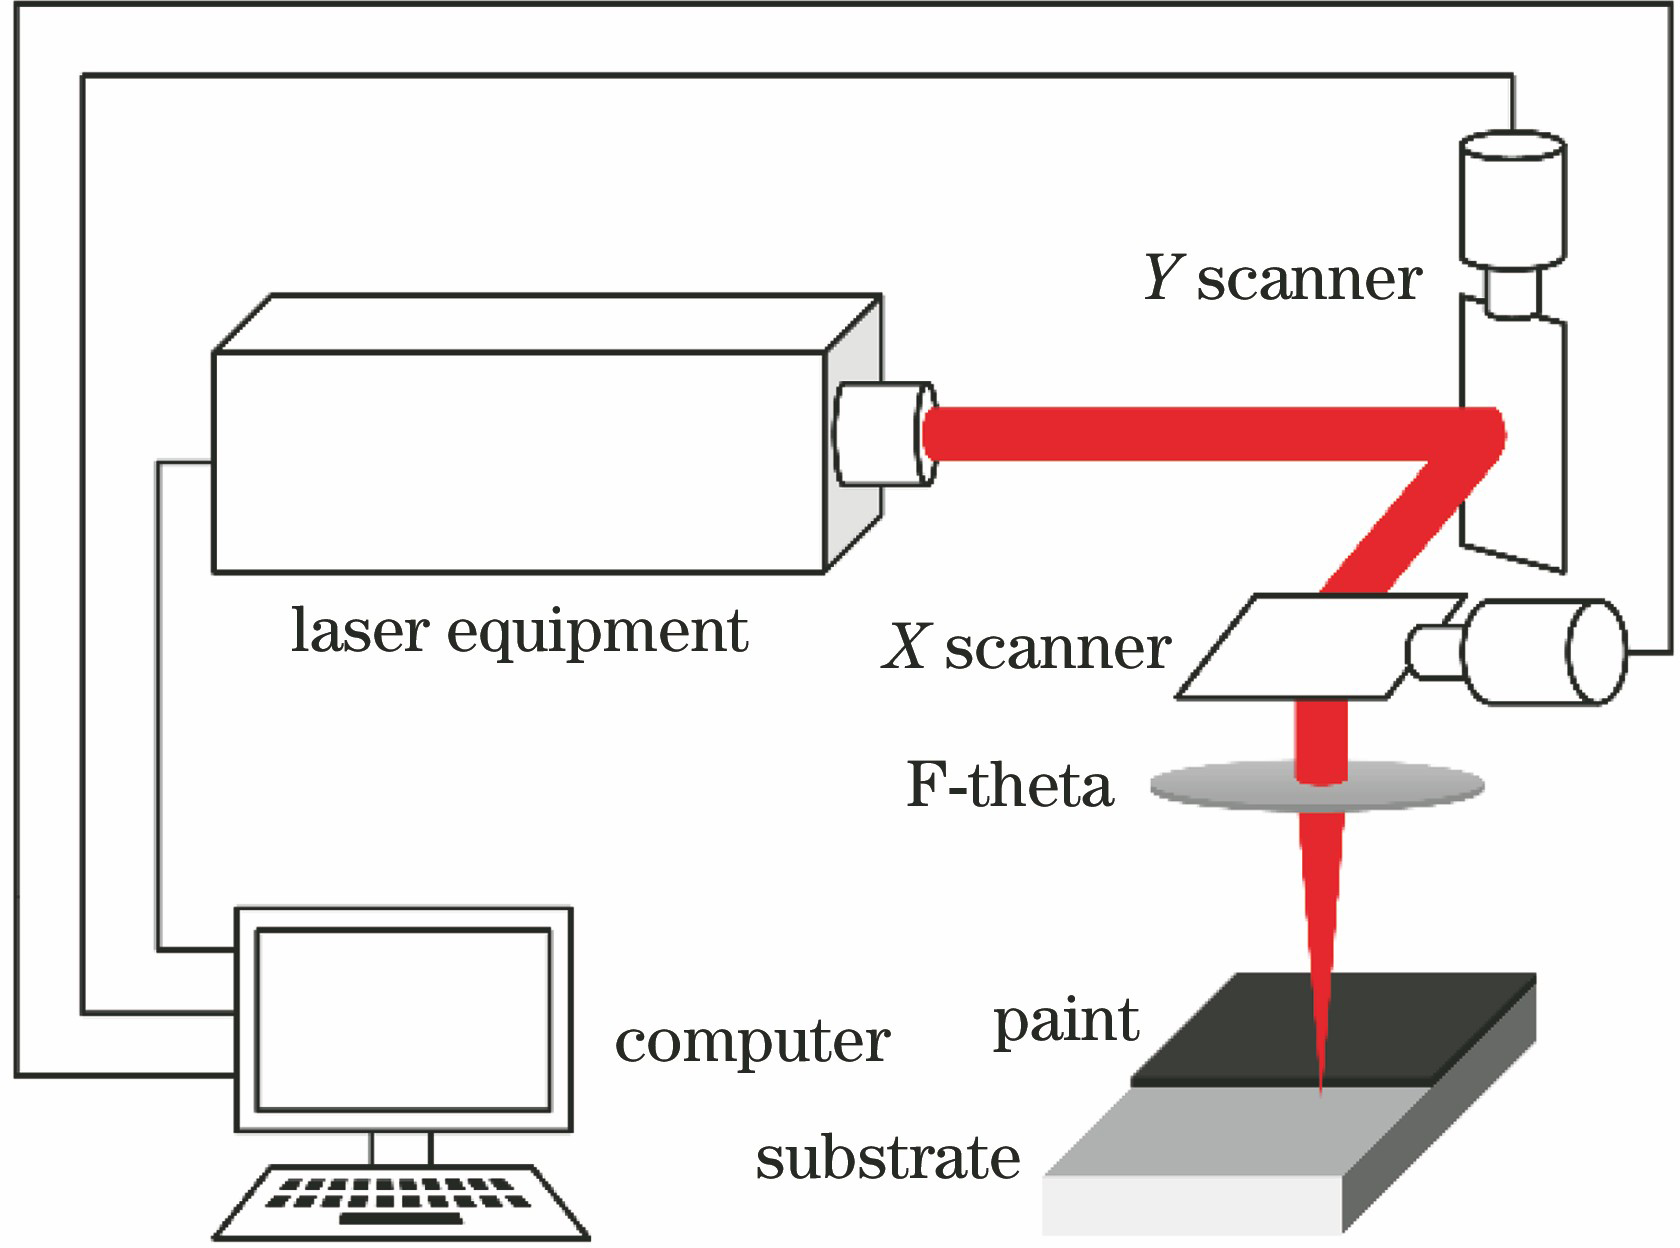
图 1. 激光除漆示意图
Fig. 1. Diagram of laser paint removal
下载图片 查看原文
图 2. 各因素交互作用对表面成分的影响
Fig. 2. Effect of interaction of all factors on surface composition
下载图片 查看原文
图 3. 不同搭接率下清洗表面的微观形貌与元素成分。(a) 50%;(b) 75%
Fig. 3. Cleaning surface micromorphology and elemental composition under different overlap rates. (a) 50%; (b) 75%
下载图片 查看原文
图 4. 光斑搭接率和功率对表面成分的影响。(a)等高线图;(b)响应曲面图
Fig. 4. Effects of spot overlap rate and power on surface composition. (a) Contour graph; (b) response graph
下载图片 查看原文
图 5. 光斑搭接率和扫描次数对表面成分的影响。(a)等高线图;(b)响应曲面图
Fig. 5. Effects of spot overlap rate and number of scans on surface composition. (a) Contour graph; (b) response graph
下载图片 查看原文
图 6. 各因素交互作用对表面粗糙度的影响
Fig. 6. Effect of interaction of all factors on surface roughness
下载图片 查看原文
图 7. 不同功率下清洗表面的微观形貌与线粗糙度。(a) 20 W;(b) 25 W
Fig. 7. Cleaning surface micromorphology and line roughness at different powers. (a) 20 W; (b) 25 W
下载图片 查看原文
图 8. 功率和扫描次数对表面粗糙度的影响。(a)等高线图;(b)响应曲面图
Fig. 8. Effects of power and number of scans on surface roughness. (a) Contour graph; (b) response graph
下载图片 查看原文
图 9. 功率和光斑搭接率对表面粗糙度的影响。(a)等高线图;(b)响应曲面图
Fig. 9. Effects of power and spot overlap rate on surface roughness. (a) Contour graph; (b) response graph
下载图片 查看原文
表 1304不锈钢的主要化学成分
Table1. Main chemical composition of 304 stainless steel
| Element | C | Si | Mn | Cr | Ni | S | P | N | Fe |
|---|
| Mass fraction /% | ≤0.08 | ≤1.0 | ≤2.0 | 18.0-20.0 | 8.0-10.5 | ≤0.03 | ≤0.035 | ≤0.1 | Bal. |
|
查看原文
表 2激光除漆系统的主要技术参数
Table2. Main technical parameters of laser paint removal system
| Parameter | Value |
|---|
| Wavelength /nm | 1064 | | Power /W | ≤ 100 | | Pulse width /ns | 100 | | Frequency /kHz | 10-100 | | Scan speed /(mm·s-1) | ≤8000 | | Focal length /mm | 160 | | Waist diameter /mm | 0.05 |
|
查看原文
表 3实验因素和水平设计
Table3. Experimental factors and level design
| Factor | Extreme value |
|---|
| Low(-1) | Medium(0) | High(+1) |
|---|
| Power P /W | 15 | 20 | 25 | | Spot overlap rate γ /% | 25 | 50 | 75 | | Number of scans N | 2 | 3 | 4 |
|
查看原文
表 4实验设计矩阵与实验结果
Table4. Design matrix and experimental results
| No. | Parameter | Result |
|---|
| P /W | γ /% | N | S | Sa /μm |
|---|
| 1 | 25 | 25 | 3 | 50 | 0.6966 | | 2 | 25 | 50 | 2 | 60 | 0.8036 | | 3 | 25 | 75 | 3 | 20 | 1.1528 | | 4 | 25 | 50 | 4 | 30 | 1.5258 | | 5 | 15 | 50 | 2 | 40 | 1.5620 | | 6 | 20 | 50 | 3 | 85 | 0.5980 | | 7 | 20 | 50 | 3 | 85 | 0.6330 | | 8 | 15 | 50 | 4 | 85 | 1.0620 | | 9 | 20 | 50 | 3 | 80 | 0.7070 | | 10 | 20 | 75 | 4 | 10 | 1.0588 | | 11 | 20 | 50 | 3 | 80 | 0.7860 | | 12 | 20 | 75 | 2 | 20 | 1.0844 | | 13 | 20 | 50 | 3 | 75 | 0.5900 | | 14 | 20 | 25 | 2 | 30 | 0.8038 | | 15 | 20 | 25 | 4 | 65 | 0.8788 | | 16 | 15 | 25 | 3 | 40 | 0.9316 | | 17 | 15 | 75 | 3 | 60 | 0.9498 |
|
查看原文
表 5表面成分模型的方差分析结果
Table5. ANOVA for surface composition model
| Source | Sum of squares | Degree of freedom | Mean square | F | Probability |
|---|
| Model | 10321.99 | 9 | 1146.89 | 16.62 | 0.0006 | | P | 528.13 | 1 | 528.13 | 7.65 | 0.0278 | | γ | 703.13 | 1 | 703.13 | 10.19 | 0.0152 | | Pγ | 625.00 | 1 | 625.00 | 9.06 | 0.0197 | | PN | 1406.25 | 1 | 1406.25 | 20.38 | 0.0027 | | γN | 506.25 | 1 | 506.25 | 7.34 | 0.0303 | | γ2 | 3968.38 | 1 | 3968.38 | 57.52 | 0.0001 | | N2 | 1592.85 | 1 | 1592.85 | 23.09 | 0.0020 | | Lack of fit | 393.75 | 3 | 131.25 | 5.89 | 0.0599 | | Note: residual-square R2=0.9553; adjusted residual-square =0.8978; predicted residual-square =0.4040; adeq precision AP=11.479. | |
|
查看原文
表 6表面粗糙度模型的方差分析结果
Table6. ANOVA for surface roughness model
| Source | Sum of squares | Degree of freedom | Mean square | F | Probability |
|---|
| Model | 1.30 | 9 | 0.14 | 25.26 | 0.0002 | | γ | 0.11 | 1 | 0.11 | 19.17 | 0.0032 | | Pγ | 0.048 | 1 | 0.048 | 8.42 | 0.0230 | | PN | 0.37 | 1 | 0.37 | 65.52 | <0.0001 | | P2 | 0.32 | 1 | 0.32 | 56.24 | 0.0001 | | N2 | 0.38 | 1 | 0.38 | 66.34 | <0.0001 | | Lack of fit | 0.012 | 3 | 0.004 | 0.60 | 0.6484 | | Note: R2=0.9701, =0.9317, =0.8196, AP=15.336. | |
|
查看原文
表 7优化准则和权重
Table7. Optimization criteria and weight
| Name | Criteria | Weight |
|---|
| Goal | Lower | Upper |
|---|
| P | In range | 15 | 25 | 1 | | γ | In range | 25 | 75 | 1 | | N | Equal to 3 | 2 | 4 | 1 | | S | Maximize | 75 | 100 | 1 | | Sa | Minimize | 0 | 1 | 1 |
|
查看原文
表 8优化结果
Table8. Optimization results
| Number | P /W | γ /% | N | S | Sa /μm |
|---|
| 1 | 19.18 | 46.06 | 3 | 82.9 | 0.661 |
|
查看原文
杨嘉年, 周建忠, 孙奇, 孟宪凯, 朱明, 郭召恒, 付强. 基于响应面分析的激光除漆工艺参数优化[J]. 激光与光电子学进展, 2019, 56(23): 231402. Jianian Yang, Jianzhong Zhou, Qi Sun, Xiankai Meng, Ming Zhu, Zhaoheng Guo, Qiang Fu. Laser Paint Removal Process Parameter Optimization via Response Surface Methodology[J]. Laser & Optoelectronics Progress, 2019, 56(23): 231402.


 PDF全文
PDF全文

